

Robinhood Markets (HOOD): the full file — the numbers, the owners, and what the filings actually show
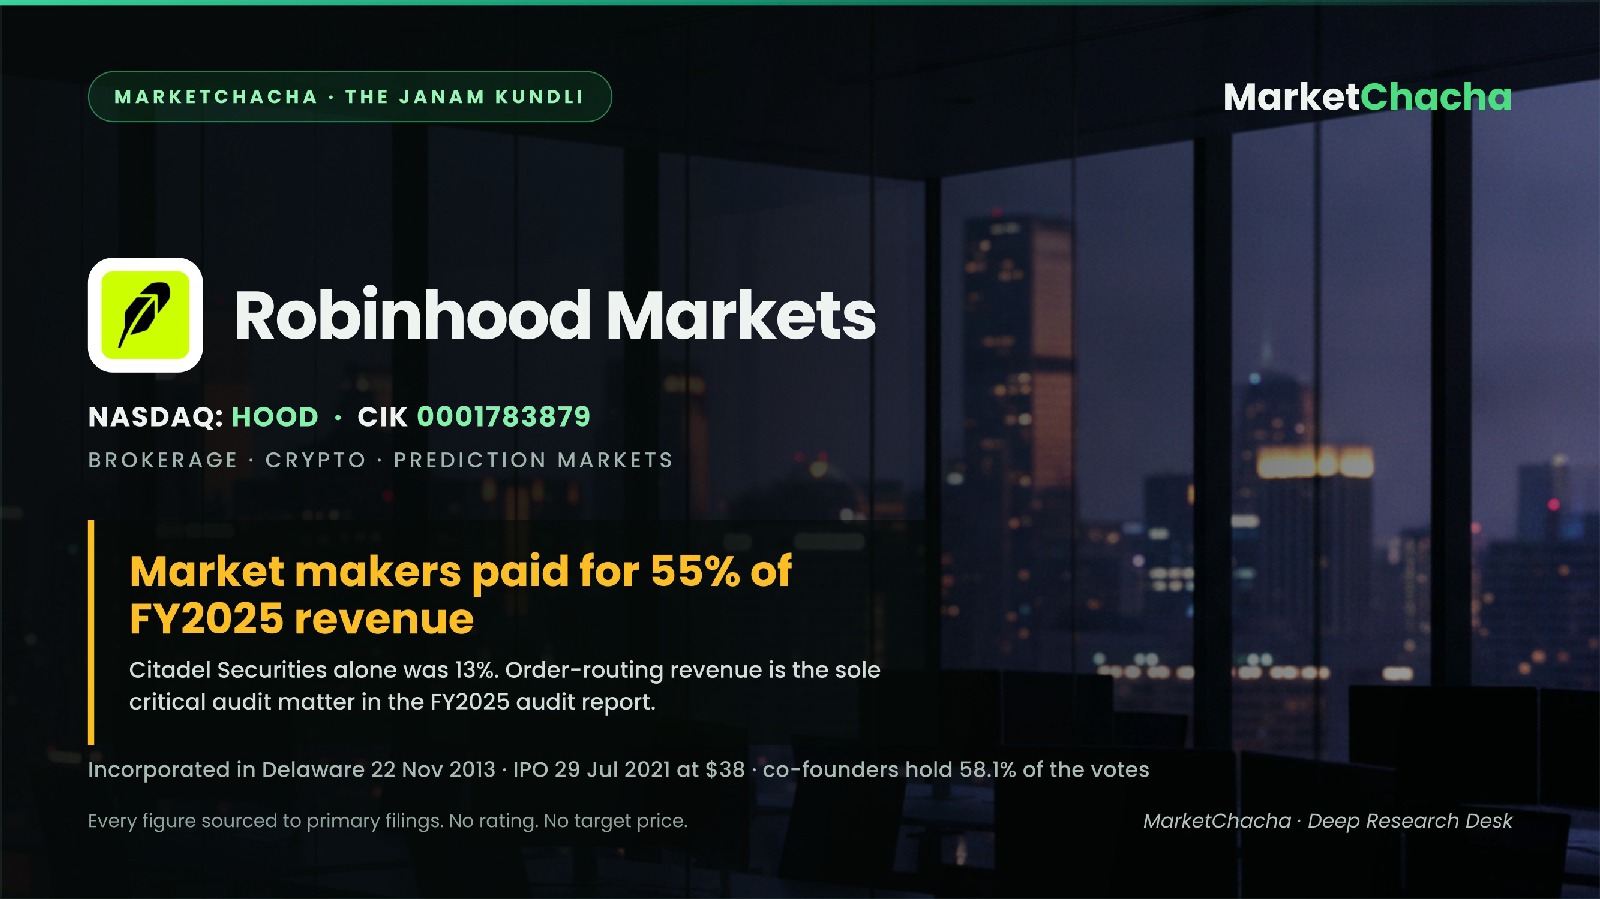
Robinhood Markets, Inc. runs a commission-free retail brokerage app. It does not charge the customer for the trade; it is paid by the market makers it routes those trades to, it lends the customer money against their shares, and it earns interest on the cash sitting idle in their account. In FY2025 those three engines produced $4,473 million of net revenue and $1,883 million of net income.
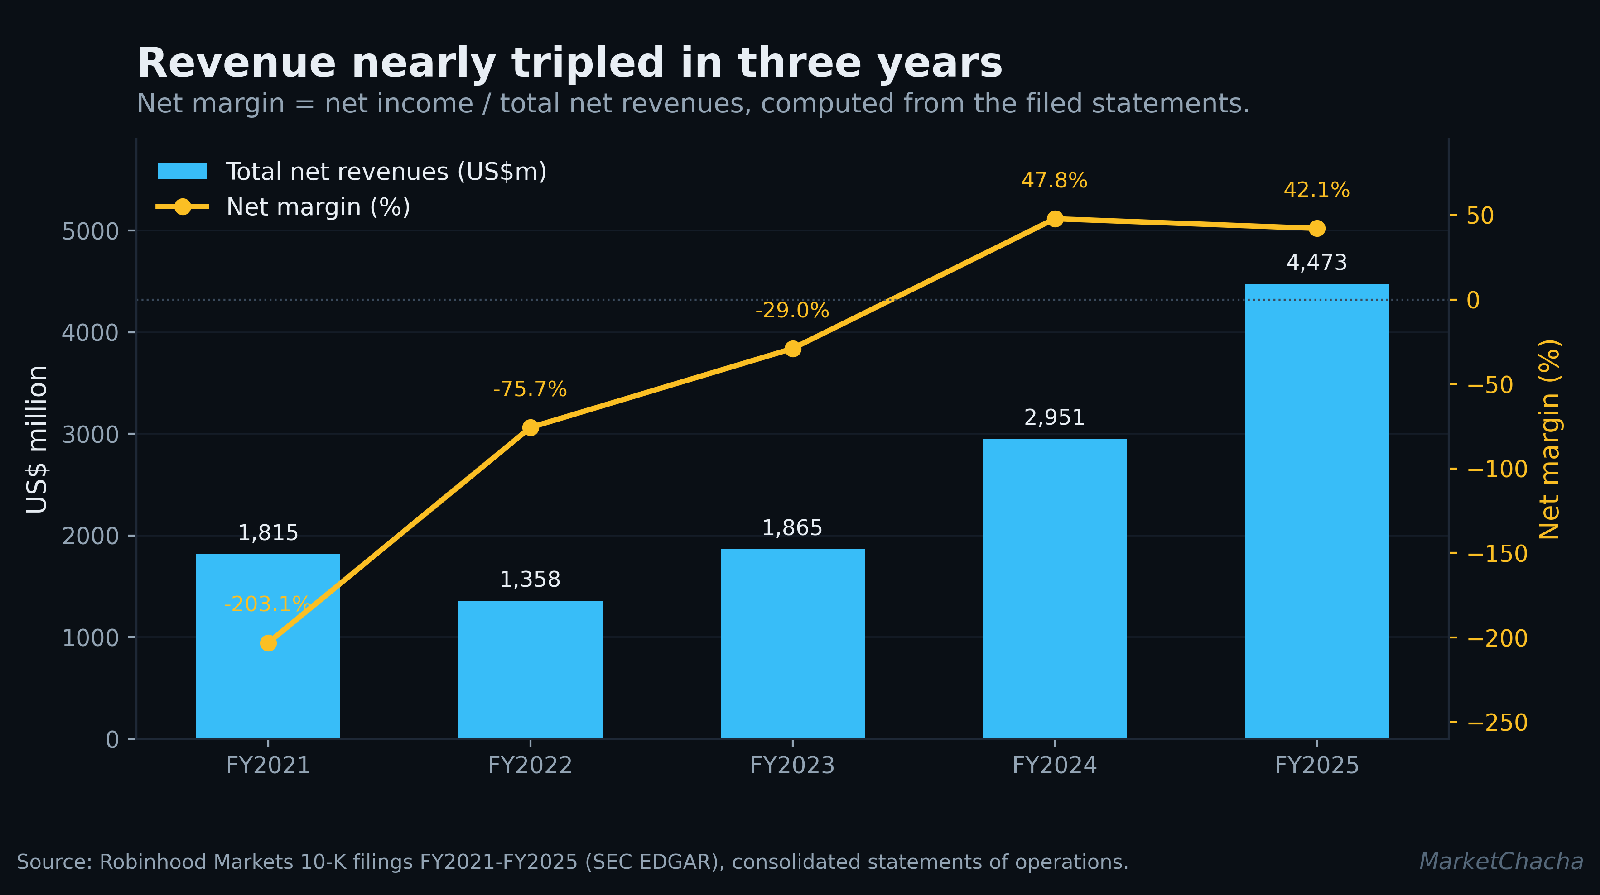
The record shows a company that has gone from a $3.7 billion loss in its IPO year to a 42% net margin in four years, that draws 55% of its revenue from a handful of named trading firms, whose founders hold 58.1% of the votes on 12.3% of the shares, and which has settled enforcement matters with the SEC, FINRA, and at least three state regulators since 2020. Every one of those statements comes from a filed document. This report links all of them.
Origin — the company's birth certificate
Robinhood Markets, Inc. was incorporated in the State of Delaware on 22 November 2013 by Vladimir Tenev and Baiju Bhatt, who met as Stanford roommates. There has been no name change and no reverse merger; the entity that listed is the entity that was incorporated. Its principal executive offices are at 85 Willow Road, Menlo Park, California.
The company listed its Class A common stock on Nasdaq under "HOOD" on 29 July 2021. The IPO sold 55,000,000 shares at $38.00 — 52,375,000 new shares from the company and 2,625,000 sold by the founders and the then-CFO. The prospectus disclosed on its cover that after the offering Mr Tenev would hold an economic interest of about 7.8% of the capital but 26.1% of the voting power, because the founders' Class B shares carry ten votes each. That structure is still in place today.
The stock closed at $34.82 on its first day and at $108.13 on 21 August 2026. Measured from the $38 IPO price that is a gain of 184.6% over 5.06 years, a compound 22.9% a year; measured from the first-day close, 210.5%, or 25.1% a year. Measured from the 31 December 2021 close of $17.76 it is +508.8%, or 47.6% a year. It is also 29.7% below the $153.86 twelve-month high.
The business — what they actually sell
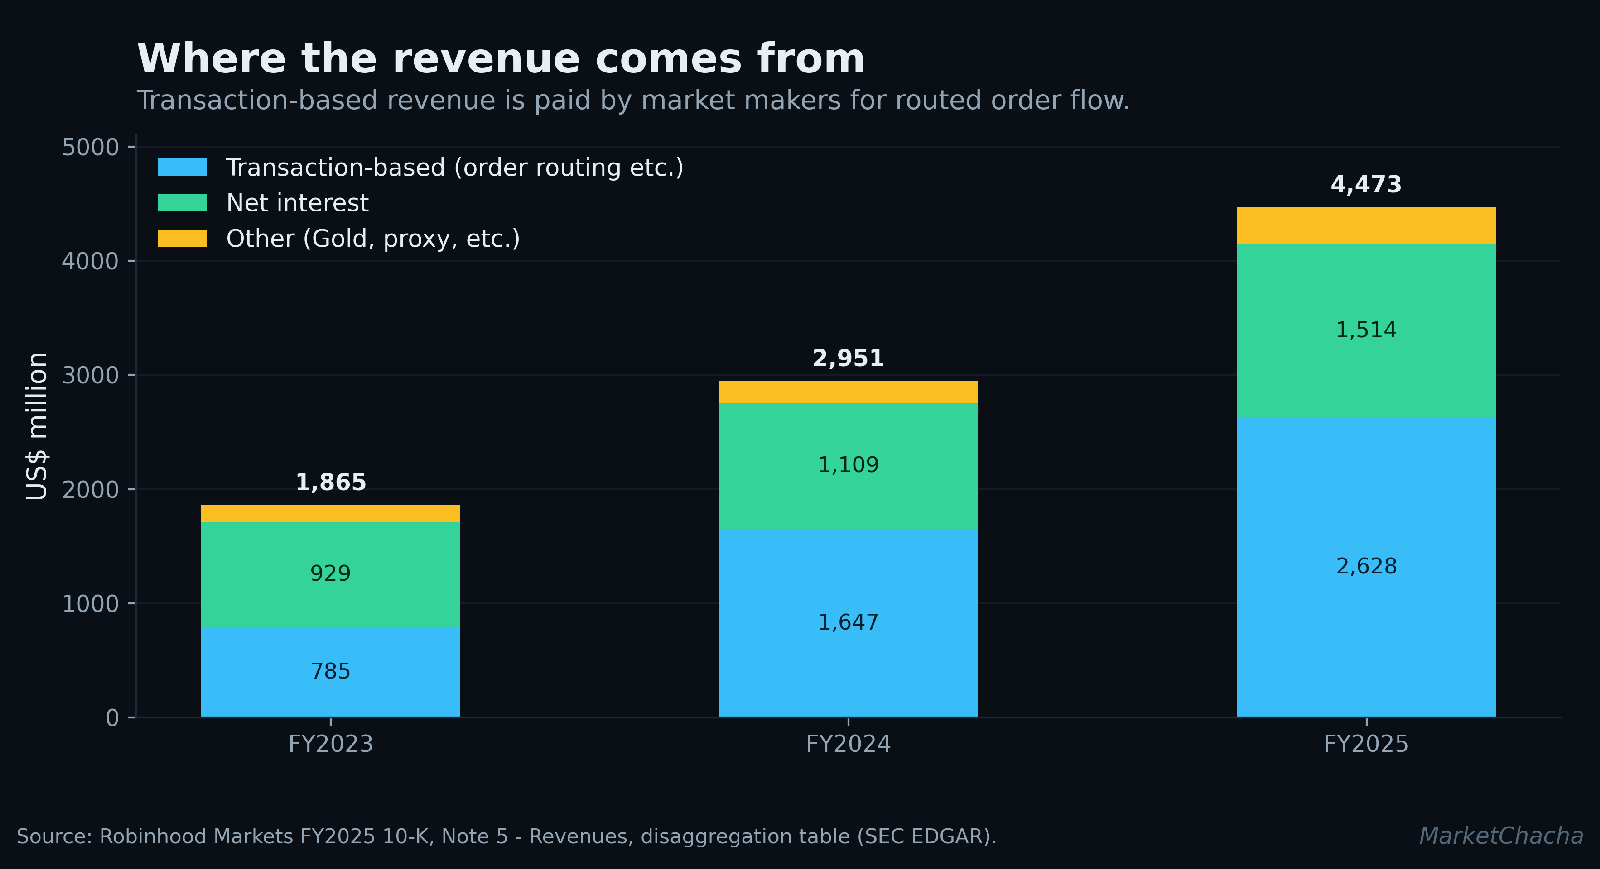
Robinhood reports a single operating segment and splits revenue three ways. In FY2025: transaction-based revenues $2,628m (options $1,123m, cryptocurrencies $901m, equities $302m, other $302m); net interest revenues $1,514m (margin interest $573m, interest on segregated cash $319m, cash sweep $229m, securities lending $190m, interest on corporate cash $167m, credit card $64m); and other revenues $331m (Gold subscriptions $179m, proxy revenues $63m, other $89m).
The single most important line in the audit report is this: of the $2,628m of transaction-based revenue, $2,326m was "revenues earned from routing user orders to market makers". That is payment for order flow. It is also the sole critical audit matter Ernst & Young identified in the FY2025 audit — meaning the auditor flagged it as the area involving especially challenging judgment.
Who actually buys from them
Robinhood discloses this with unusual precision. The customer-concentration note in the FY2025 10-K states that market makers and liquidity providers accounted for 55% of total net revenues in FY2025 (FY2024: 56%; FY2023: 40%). Two counterparties are named:
- Citadel Securities, LLC — 13% of total net revenues in FY2025, 12% in FY2024, 12% in FY2023
- Wintermute Trading Ltd — 6% in FY2025, 10% in FY2024, 2% in FY2023
- All others individually below 10% — 36%, 34% and 26% respectively
In the quarter ended 30 June 2026 the total fell to 47% while Citadel Securities rose to 16% — the highest single-counterparty share disclosed in any period we examined. Wintermute Trading Ltd, a UK-registered crypto trading firm, dropped below the 10% disclosure threshold and is no longer separately named.
The risk factors add a detail worth reading twice: settlement with crypto liquidity providers is bilateral rather than through a clearing house, and the company states it "is not uncommon for us to have an intra-day outstanding net receivable of $100 million that we are owed by any one cryptocurrency Liquidity Provider," with payment obligations "generally unsecured during the interval between delivery and payment." Robinhood also states it "routinely" carries unsecured payment-for-order-flow receivables from equities and options liquidity providers.
Where it is actually made — infrastructure and supply chain
There is no factory. Item 2 Properties discloses only leased headquarters in Menlo Park, California with commitments running to 2036, plus leased offices "throughout the United States and other countries around the world." No data-centre locations, cloud vendor or site-by-site list are disclosed. Property, software and equipment carried a net book value of just $154m against $38,137m of total assets.
The functional supply chain is regulatory and counterparty infrastructure, and that is disclosed: Robinhood Securities, LLC clears its own trades; Robinhood Financial LLC introduces them; Robinhood Derivatives, LLC is the CFTC-regulated futures commission merchant behind event contracts; and customer cash sweeps into "a network of program banks" the filing does not name. Prediction-market clearing moved in June 2026 to Rothera, described in the Q2 2026 release as "a CFTC-licensed exchange and clearinghouse independently managed through Robinhood's joint venture with Susquehanna International Group."
Five years of numbers
| US$ million | FY2021 | FY2022 | FY2023 | FY2024 | FY2025 |
| Total net revenues | 1,815 | 1,358 | 1,865 | 2,951 | 4,473 |
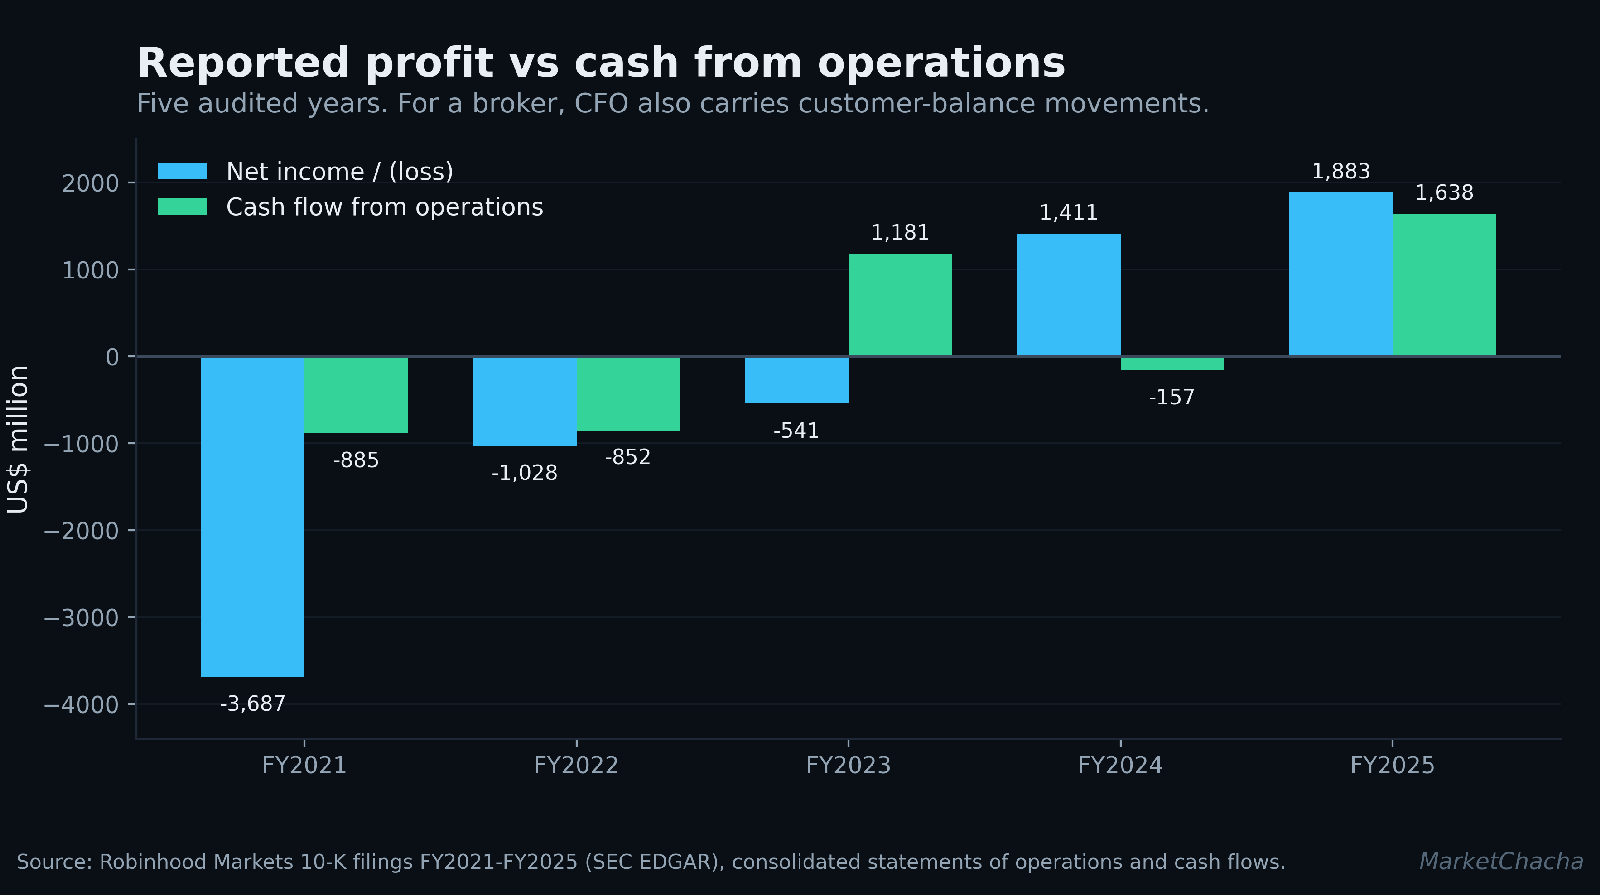
| Net income / (loss) | (3,687) | (1,028) | (541) | 1,411 | 1,883 |
| Net margin | (203.1%) | (75.7%) | (29.0%) | 47.8% | 42.1% |
| Cash from operations | (885) | (852) | 1,181 | (157) | 1,638 |
| Share-based compensation | — | — | 871 | 304 | 305 |
| Total assets | 19,769 | 23,337 | 17,624 | 26,187 | 38,137 |
| Total equity | 7,293 | 6,956 | 6,696 | 7,972 | 9,151 |
Revenue CAGR, FY2021 to FY2025: (4,473 ÷ 1,815) ^ (1/4) − 1 = 25.3% a year. A profit CAGR cannot be computed across a sign change; from FY2024 to FY2025 net income rose 33.5% and diluted EPS rose from $1.56 to $2.05, or 31.4%.
Income statement — FY2025 vs FY2024
| US$ million | FY2025 | FY2024 | Change | % |
| Transaction-based revenues | 2,628 | 1,647 | +981 | +59.6% |
| Net interest revenues | 1,514 | 1,109 | +405 | +36.5% |
| Other revenues | 331 | 195 | +136 | +69.7% |
| Total net revenues | 4,473 | 2,951 | +1,522 | +51.6% |
| Brokerage and transaction | 211 | 164 | +47 | +28.7% |
| Technology and development | 897 | 818 | +79 | +9.7% |
| Operations | 130 | 112 | +18 | +16.1% |
| Provision for credit losses | 114 | 76 | +38 | +50.0% |
| Marketing | 399 | 272 | +127 | +46.7% |
| General and administrative | 628 | 455 | +173 | +38.0% |
| Total operating expenses | 2,379 | 1,897 | +482 | +25.4% |
| EBITDA (PBT + D&A + interest expense) | 2,226 | 1,165 | +1,061 | +91.1% |
| EBITDA margin | 49.8% | 39.5% | +10.3pp | — |
| Other income, net | 14 | 10 | +4 | +40.0% |
| Depreciation and amortisation | 86 | 77 | +9 | +11.7% |
| Finance cost (credit facilities) | 32 | 24 | +8 | +33.3% |
| Profit before tax | 2,108 | 1,064 | +1,044 | +98.1% |
| Tax charge / (benefit) | 225 | (347) | +572 | n.m. |
| Net income | 1,883 | 1,411 | +472 | +33.5% |
| Diluted EPS (US$) | 2.05 | 1.56 | +0.49 | +31.4% |
| Net margin | 42.1% | 47.8% | −5.7pp | — |
Balance sheet — FY2025 vs FY2024
| US$ million | FY2025 | FY2024 | Change | % |
| Cash and cash equivalents | 4,261 | 4,332 | −71 | −1.6% |
| Segregated cash and securities | 5,749 | 4,724 | +1,025 | +21.7% |
| Receivables from users, net | 17,994 | 8,239 | +9,755 | +118.4% |
| Securities borrowed | 2,408 | 3,236 | −828 | −25.6% |
| Goodwill | 385 | 179 | +206 | +115.1% |
| Intangible assets, net | 168 | 38 | +130 | +342.1% |
| Total assets | 38,137 | 26,187 | +11,950 | +45.6% |
| Payables to users | 11,986 | 7,448 | +4,538 | +60.9% |
| Securities loaned | 11,626 | 7,463 | +4,163 | +55.8% |
| Other current liabilities | 914 | 266 | +648 | +243.6% |
| Borrowings | 0 | 0 | — | — |
| Total liabilities | 28,986 | 18,215 | +10,771 | +59.1% |
| Additional paid-in capital | 11,284 | 12,008 | −724 | −6.0% |
| Accumulated deficit | (2,152) | (4,035) | +1,883 | — |
| Total stockholders' equity | 9,151 | 7,972 | +1,179 | +14.8% |
Cash flow — FY2025 vs FY2024
| US$ million | FY2025 | FY2024 | Change |
| Cash from operations | 1,638 | (157) | +1,795 |
| Cash from investing | 141 | (148) | +289 |
| Cash from financing | (590) | (345) | −245 |
| Capital expenditure (PP&E + capitalised software) | (54) | (50) | −4 |
| Free cash flow (CFO − capex) | 1,584 | (207) | +1,791 |
The material variances, and what drove them. Revenue rose 51.6% while operating costs rose 25.4% — that operating leverage, not any one-off, is what doubled pre-tax profit. Four balance-sheet lines moved more than 40%, and three of them are the same event seen from different angles: receivables from users (+118.4%), payables to users (+60.9%) and securities loaned (+55.8%) are the margin-lending and securities-lending book expanding. Goodwill and intangibles rose because of three acquisitions closed in 2025 — TradePMR (26 February, $175m of net assets plus $100m of unvested Class A RSUs), Bitstamp (2 June, $224m) and a 90% interest in MIAXdx (12 May).
Earnings quality. Pre-tax profit rose 98.1% but net income rose only 33.5%, and the whole of that gap is the tax line: FY2024 carried a $347m tax benefit (a valuation-allowance release) against a $1,064m pre-tax profit, so FY2024's reported $1,411m of net income was larger than its pre-tax profit. About 24.6% of FY2024 net income therefore came from the tax line rather than from operations. FY2025's effective rate was 10.7%; FY2024's was −32.6%. Other income was 0.7% of FY2025 pre-tax profit — negligible, and clean.
The latest quarter, decoded
| US$ million | Q2 FY26 | Q1 FY26 | QoQ | Q2 FY25 | YoY |
| Transaction-based revenues | 776 | 623 | +24.6% | 539 | +44.0% |
| — Options | 342 | 260 | +31.5% | 265 | +29.1% |
| — Event contracts | 156 | 104 | +50.0% | 10 | +1,460% |
| — Equities | 129 | 82 | +57.3% | 66 | +95.5% |
| — Cryptocurrencies | 100 | 134 | −25.4% | 160 | −37.5% |
| — Other | 49 | 43 | +14.0% | 38 | +28.9% |
| Net interest revenues | 389 | 359 | +8.4% | 357 | +9.0% |
| — of which margin interest | 215 | 193 | +11.4% | 114 | +88.6% |
| Other revenues | 143 | 85 | +68.2% | 93 | +53.8% |
| Total net revenues | 1,308 | 1,067 | +22.6% | 989 | +32.3% |
| Total operating expenses | 734 | 656 | +11.9% | 550 | +33.5% |
| Other income, net | 135 | 0 | n.m. | 3 | n.m. |
| Profit before tax | 709 | 411 | +72.5% | 442 | +60.4% |
| — excluding other income | 574 | 411 | +39.7% | 439 | +30.8% |
| Tax | 136 | 65 | +109.2% | 56 | +142.9% |
| Effective tax rate | 19.2% | 15.8% | — | 12.7% | — |
| Net income | 573 | 346 | +65.6% | 386 | +48.4% |
What is inside the beat. Headline net income rose 48.4% year-on-year, but $135m of the $709m pre-tax profit — 19.0% — sat in "other income, net", and the company's own release attributes $129m of it to "gains primarily related to the deconsolidation of Robinhood Ventures Fund I (RVI)," worth $0.14 of the $0.62 diluted EPS. That is a non-cash accounting gain on a change in consolidation, not an operating result. Strip it out and pre-tax profit grew 30.8% year-on-year against revenue growth of 32.3% — still strong, and much closer to the top line. Working the other way, the quarter also absorbed one-time restructuring charges from the June 2026 workforce reduction. The effective tax rate has risen in each of the last three quarters, from 12.7% to 19.2%.
The mix shift is the story. Crypto revenue has now halved from its peak while event contracts went from $10m to $156m in a year and equities revenue nearly doubled. Robinhood's own operating data for the quarter: Funded Customers 28.4 million (+7%), Total Platform Assets $369 billion (+32%), Gold subscribers 4.8 million (+39%), ARPU $187 (+24%), margin book $21.6 billion (+127%), equity notional volumes $956 billion (+85%), event contracts traded 13.6 billion (over 10×).
Who owns it — and where those owners are registered
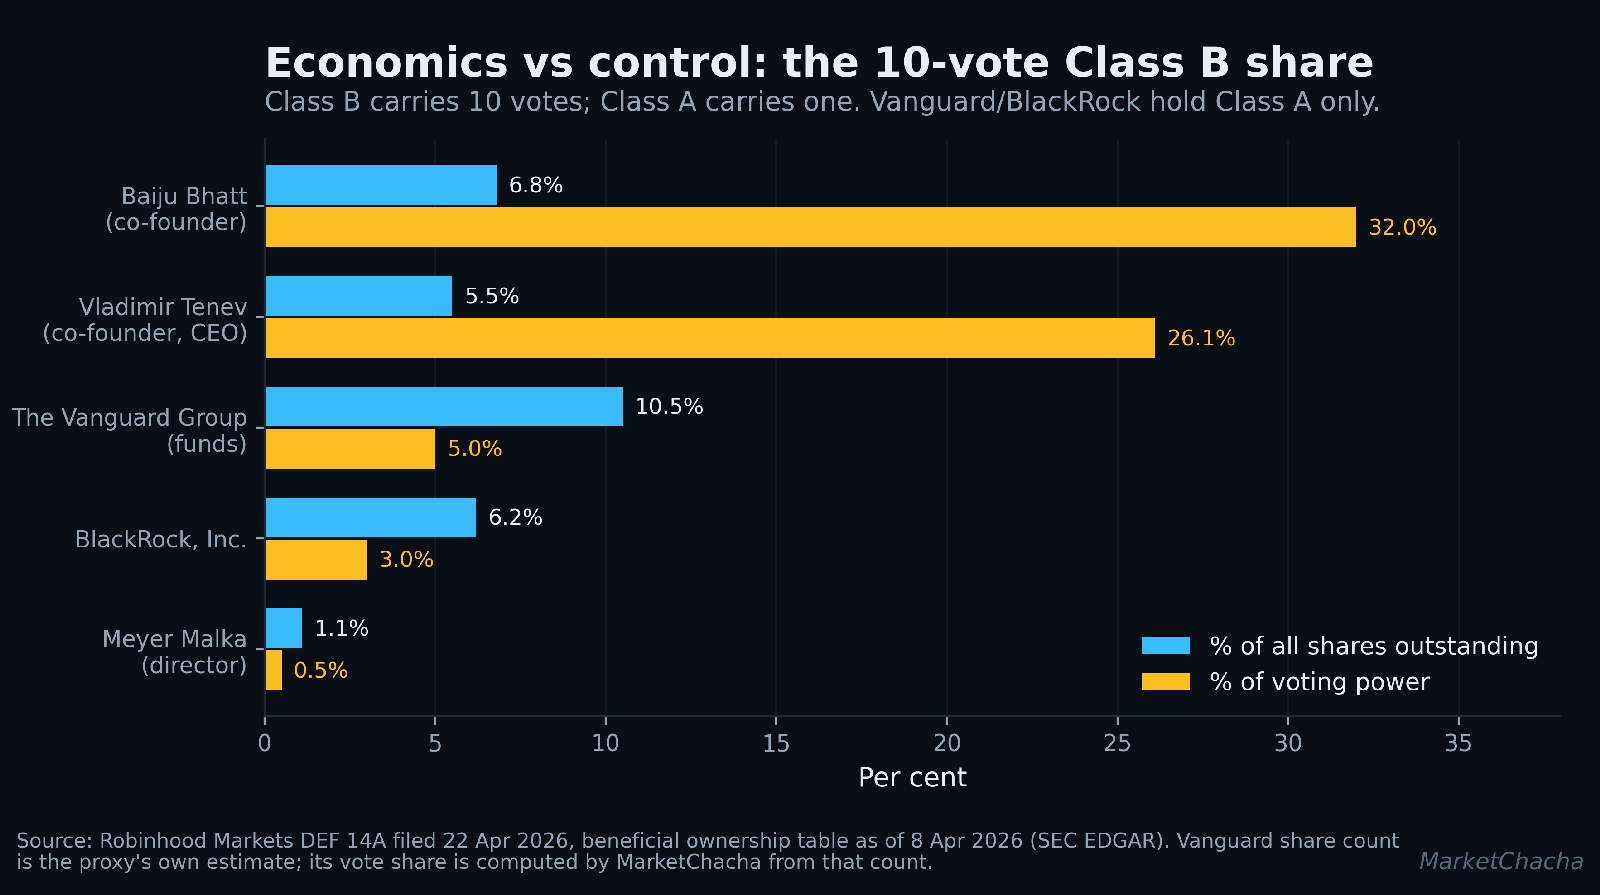
Per the beneficial ownership table in the 2026 proxy, as of 8 April 2026 there were 791,086,666 Class A shares (one vote) and 109,745,620 Class B shares (ten votes) outstanding, and no Class C.
- Baiju Bhatt, co-founder — 61,076,048 Class B shares, 55.7% of Class B, 32.0% of total voting power on roughly 6.8% of all shares.
- Vladimir Tenev, co-founder, Chairman and CEO — 49,234,651 Class B shares, 44.9% of Class B, 26.1% of the voting power on roughly 5.5% of all shares.
- All current executive officers and directors as a group (14 persons) — 11,689,215 Class A shares (1.5% of Class A), 109,745,620 Class B shares (100% of Class B), and 58.6% of total voting power.
- The Vanguard Group funds — approximately 94,436,459 Class A shares, 11.9% of Class A, per the proxy's own estimate. Vanguard's Schedule 13G/A filed 27 March 2026 reported zero voting and zero dispositive power following an internal realignment, with no subsidiary having yet reported separately.
- BlackRock, Inc. — 55,763,578 Class A shares (7.0%) per its Schedule 13G/A of 17 October 2025; 3% of voting power.
- No other holder of 5% or more is named in the proxy. There were 89 holders of record of Class A stock as of 11 February 2026 — a low number simply because most shares are held in street name through brokers.
Jurisdictions. Every named holder is US-domiciled. There is no offshore holding vehicle in the disclosed ownership chain — no Mauritius, Cayman, BVI or Luxembourg entity appears among the beneficial owners. That is a verified finding, not an omission.
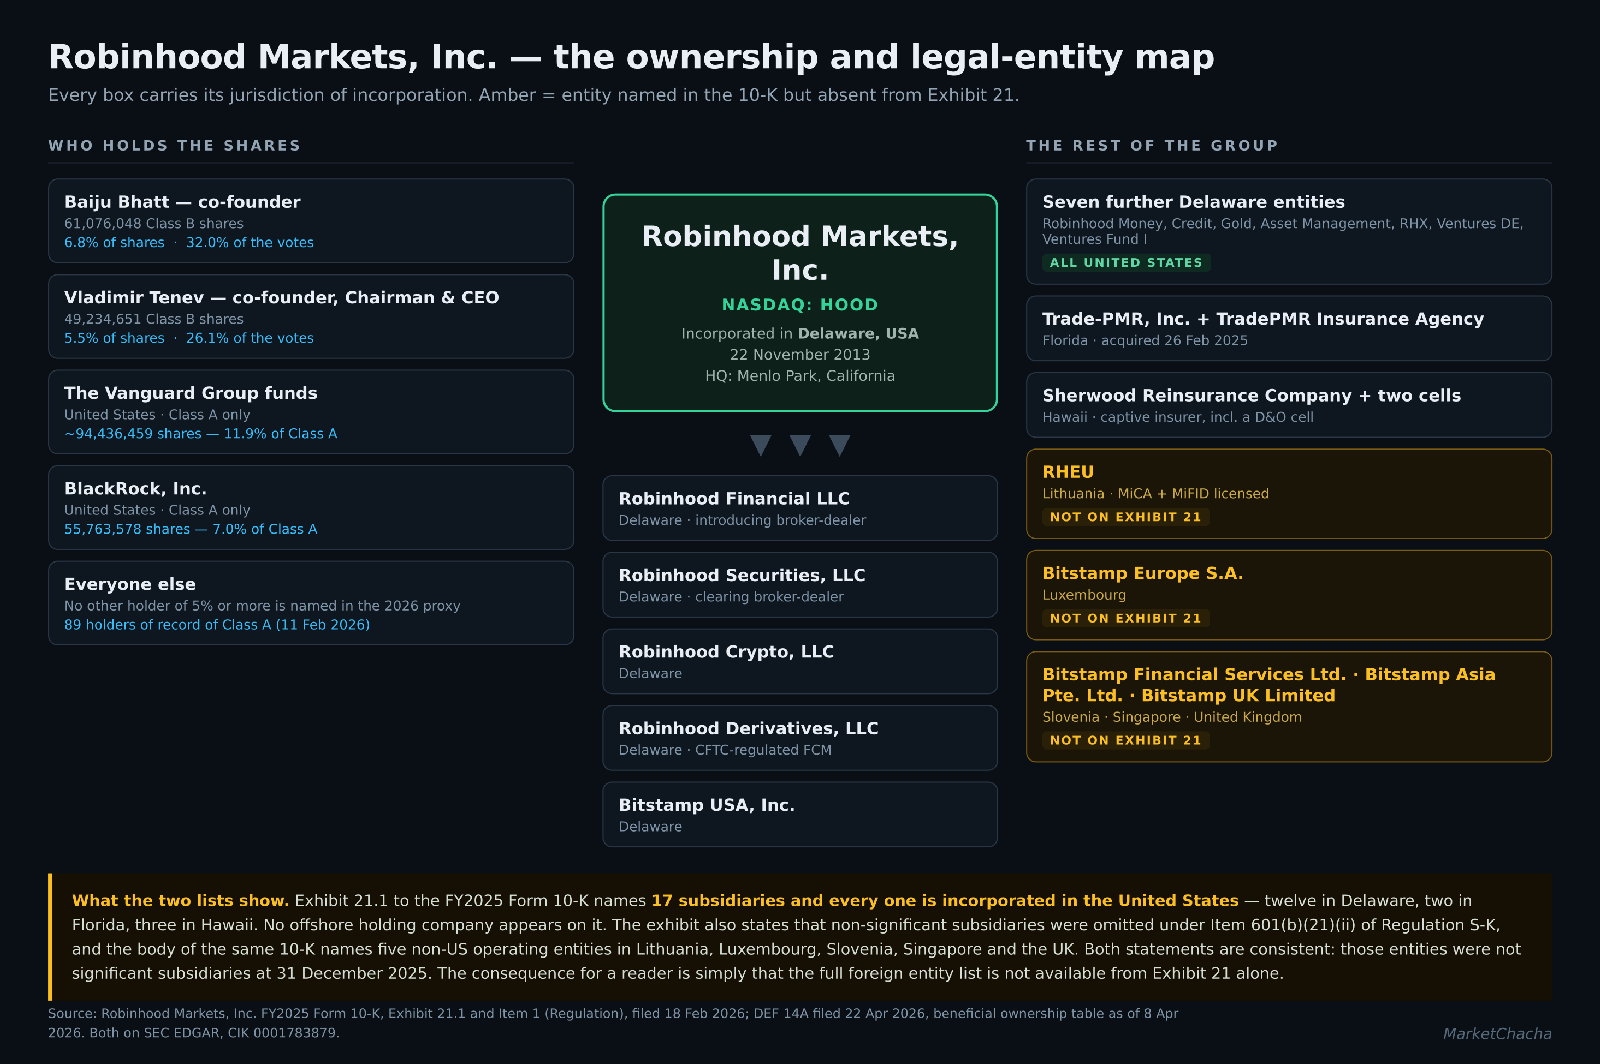
The subsidiary list has a gap worth naming. Exhibit 21.1 to the FY2025 10-K lists 17 subsidiaries, and every single one is incorporated in the United States — twelve in Delaware, two in Florida (Trade-PMR), three in Hawaii (Sherwood Reinsurance Company and two cells, including a D&O cell — a captive insurance structure, legal and common among large US companies). The exhibit also states that non-significant subsidiaries were omitted under Item 601(b)(21)(ii) of Regulation S-K. The body of the same 10-K names five non-US operating entities: RHEU (Lithuania), Bitstamp Europe S.A. (Luxembourg), Bitstamp Financial Services Ltd. (Slovenia), Bitstamp Asia Pte. Ltd. (Singapore) and Bitstamp UK Limited (United Kingdom). Both statements are consistent — those entities were not "significant subsidiaries" at 31 December 2025. The practical consequence for a reader is that the complete foreign entity list cannot be obtained from Exhibit 21 alone.
Insider transactions
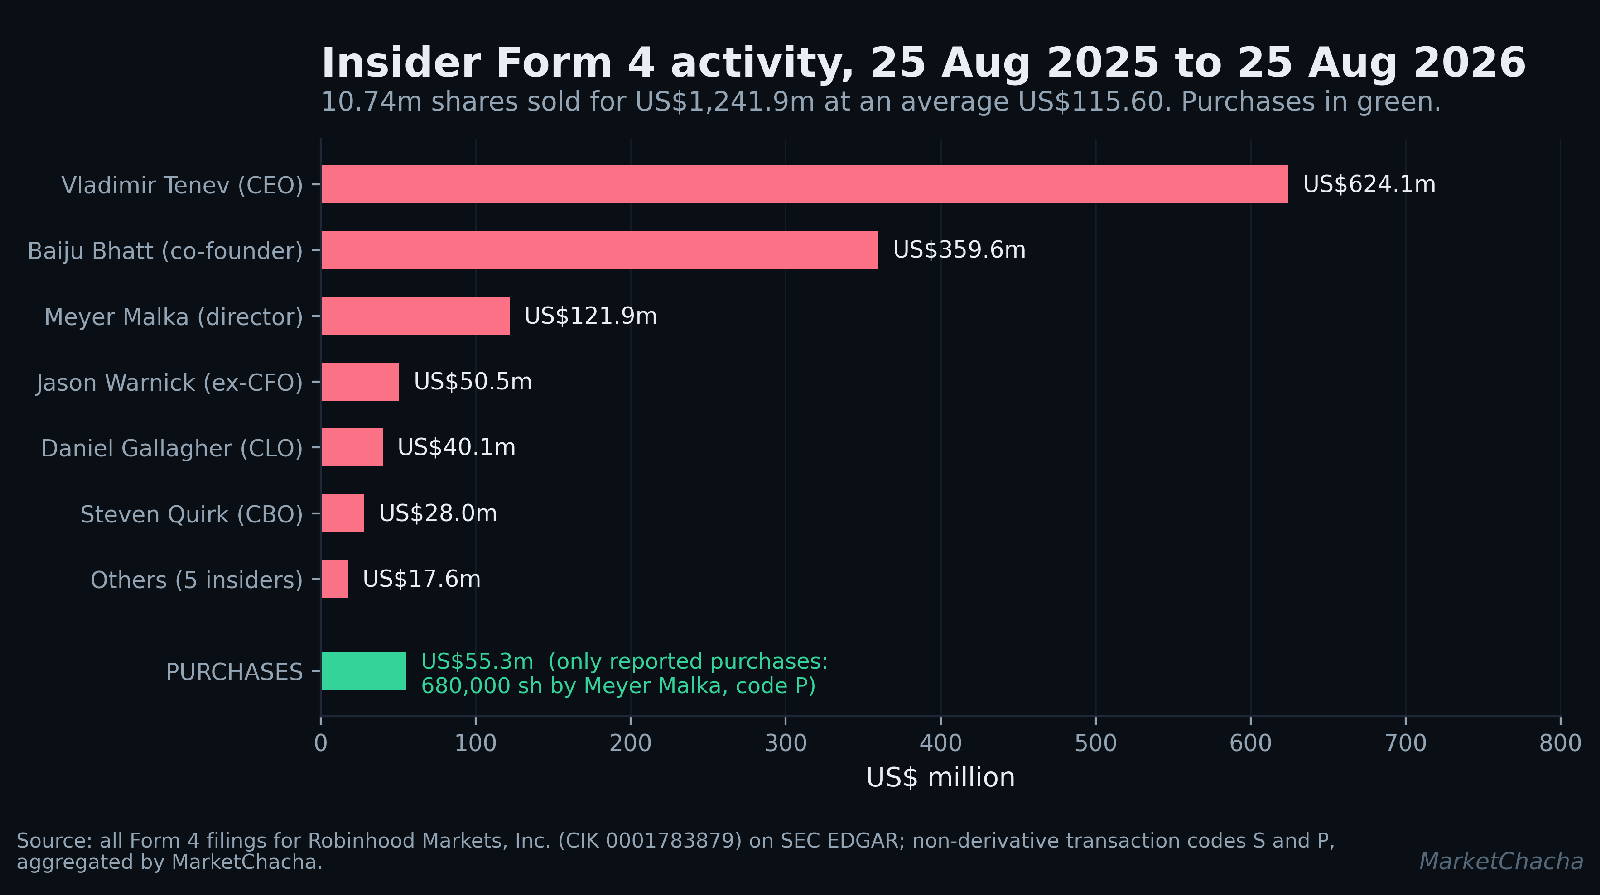
We read every Form 4 filed on Robinhood's EDGAR page and aggregated the non-derivative transactions dated between 25 August 2025 and 25 August 2026. Insiders sold 10,743,193 shares for approximately $1,241.9 million, at an average of $115.60. The largest sellers were Vladimir Tenev (5,400,932 shares, $624.1m) and Baiju Bhatt (3,000,251 shares, $359.6m). The only transactions reported under purchase code "P" in the window were 680,000 shares bought by director Meyer Malka for $55.3m between 28 May and 5 June 2026 at $80.39–$83.45.
Selling at this scale after a move of this size is ordinary and usually executed under pre-arranged Rule 10b5-1 plans. It is reported because it is large, one-directional and a hard number; it says nothing by itself about the business.
Separately, the proxy discloses that director Meyer Malka entered a variable prepaid forward contract on 21 November 2025 over 1,000,000 Class A shares held by Lassen Residential LLC, pledging those shares and eligible to receive up to approximately $89.3 million in cash, settling in November 2027 at an initial share price of $97.15 and a cap of $149.51. A further 2,828,430 warrants held by Ribbit Capital entities are pledged under put-spread-collar arrangements. Director hedging and pledging is legal and disclosed; it is noted because it changes the economic alignment of the shares involved.
Capital history — every time they raised money
- IPO, 29 July 2021 — 55,000,000 Class A shares at $38.00. No stock splits, bonuses or rights issues since.
- Buybacks — a $1.0 billion Class A repurchase authorisation approved 28 May 2024, increased by $500 million in April 2025 to $1.5 billion over two years. Spend: $608m in FY2023, $257m in FY2024, $653m in FY2025 (12 million shares). Through Q2 FY2026 the program had repurchased 27 million shares for $1.3 billion at an average of about $47. Q2 FY2026 alone was $414m for 4.4 million shares at about $94, of which $290m was bought in connection with the convertible offering and outside the existing authorisation.
- Convertible notes, 25 June 2026 — $2.2 billion of 0.00% convertible senior notes due 1 October 2029, sold under Rule 144A through Goldman Sachs and J.P. Morgan, including $200m from the initial purchasers' option exercised in full. The notes bear no regular interest and the principal does not accrete. This is the first meaningful borrowing on the balance sheet: long-term borrowings went from $0 at 31 December 2025 to $2,170m at 30 June 2026.
- Equity issued for acquisitions — 2,049,711 unvested Class A shares (grant-date value $48.85, $100m) as part of the TradePMR consideration in February 2025.
- Dilution — weighted diluted shares went 890.9m (FY2023) → 906.2m (FY2024) → 918.8m (FY2025). Share-based compensation was $871m in FY2023 (46.7% of revenue), then $304m and $305m (10.3% and 6.8%). Taxes paid on net share settlement of equity awards were $12m, $244m and $437m across the three years. Additional paid-in capital fell from $12,008m to $11,284m to $10,731m, because buybacks and withholding exceeded issuance.
Who runs it, and the wider web
Vladimir Tenev is Chairman and CEO. The audit committee is chaired by Paula Loop with Susan Segal and Robert Zoellick. Others named in the 2026 proxy include Daniel Gallagher (Chief Legal Officer), John Hegeman, Meyer Malka (Founder and Managing Partner of Ribbit Capital), Christopher Payne, Jonathan Rubinstein, Dara Treseder and co-founder Baiju Bhatt.
Auditor: Ernst & Young LLP, continuously since before the IPO. FY2025 opinion unqualified, with one critical audit matter (transaction-based revenues from order routing). Fees: audit $11,231k (FY2024: $9,995k), tax $558k, all other $2k — non-audit work is 4.8% of the total. No auditor change, no restatement, no disclosed material weakness. The Form 10-K/A filed 20 February 2026 states it was filed "solely to address technical issues with formatting" of tables and headings during EDGAR transmission and "does not change any previously reported financial results."
A cluster of management changes. On 30 October 2025 CFO Jason Warnick notified the company of his retirement; Shiv Verma was appointed CFO effective 6 February 2026; Dara Bazzano joined as Chief Accounting Officer in April 2026 and became principal accounting officer on 25 June 2026; CTO Jeffrey Pinner separated on 7 May 2026; and on 16 June 2026 the company announced a reduction in force of approximately 10% of full-time employees, with about $20m of severance and $8m of share-based compensation charges accrued in Q2. The company described the reduction as taken "from a position of business strength." Executive turnover is normal at any large company; the cluster is noted because five senior changes and a 10% headcount cut fell within eight months.
Related-party transactions. The proxy's Item 404 disclosure identifies no operating related-party revenue or purchases. What it does disclose is the 2021 convertible note and warrant financings with Ribbit Capital entities affiliated with director Meyer Malka, 2025 issuer agreements facilitating a hedge of those warrants, indemnification agreements with directors and officers, the Founders' Voting Agreement, and Class B exchange right agreements with the co-founders.
The regulatory and surveillance record
These are settled or pending public matters. Where a settlement was reached, the amounts below are what the orders state. Nothing here is an allegation by us.
- SEC, 17 December 2020 — Robinhood Financial LLC agreed to pay a $65 million civil penalty over statements about payment for order flow and execution quality between 2015 and 2018. Press release · Order
- FINRA, 30 June 2021 — Robinhood Financial LLC: $57 million fine plus about $12.6 million restitution, then the largest financial penalty in FINRA's history, covering statements about margin and options, options approvals, the March 2020 outages, complaint reporting and customer identification. AWC
- New York DFS, 2 August 2022 — Robinhood Crypto, LLC: $30 million penalty over anti-money-laundering and cybersecurity programme deficiencies. Press release
- Connecticut Banking Commissioner, 10 August 2023 — Robinhood Financial LLC: $200,000. Order
- Massachusetts Securities Division, January 2024 — Robinhood Financial LLC: $7.5 million consent order relating to marketing practices, the March 2020 outages and a November 2021 data incident affecting about 117,000 Massachusetts consumers. Consent order
- SEC, 13 January 2025 — Robinhood Securities LLC ($33.5m) and Robinhood Financial LLC ($11.5m), $45 million combined, covering suspicious-activity reporting timeliness (Jan 2020–Mar 2022), identity-theft prevention, the 2021 unauthorised-access incident, electronic communications preservation, Regulation SHO (May 2019–Dec 2023) and blue-sheet accuracy over five years. Press release · Order
- FINRA, 7 March 2025 — Robinhood Financial and Robinhood Securities: $26 million in fines and $3.75 million in restitution, covering market-order "collaring" disclosures, AML programmes, customer identification, clearing-system supervision around January 2021, supervision of paid social-media influencers, and trade reporting. Release
- State gaming regulators, 2025 — cease-and-desist letters to Robinhood entities over sports event contracts from the New Jersey Division of Gaming Enforcement (27 March 2025), the Maryland Lottery and Gaming Control Commission (7 April 2025) and the Connecticut Department of Consumer Protection (2 December 2025). These are regulator assertions, not adjudicated findings.
- Litigation — the FY2025 10-K reports six pending cases and an aggregate contingency accrual of $128 million at 31 December 2025, up from $71 million a year earlier. Five putative securities-fraud class actions filed in 2021 remain, including Golubowski in the Northern District of California over the IPO offering documents.
- Exchange surveillance — the US market has no direct equivalent of India's ASM/GSM lists. HOOD trades on the Nasdaq Global Select Market, the highest listing tier, and we found no listing deficiency notice or Nasdaq trading restriction in any 2025 or 2026 filing.
- 2026 — we found no enforcement action, order or settlement dated in 2026 against any Robinhood entity.
Forensic checks — what the accounts show
| Check | What we found | A benign explanation |
| 1. Cumulative CFO ÷ PAT | FY2021–25 cumulative CFO +$925m against cumulative PAT of −$1,962m — the ratio is not computable across a negative denominator. Over FY2023–25 the ratio is 2,662 ÷ 2,753 = 0.97. FY2025 alone 0.87; FY2024 alone −0.11. | For a broker, CFO carries customer-balance movements. FY2025 CFO absorbed a $9,106m outflow from receivables from users and gained $3,423m from payables to users and $4,163m from securities loaned. Cash earnings before those working-capital swings were $2,572m in FY2025 (1.37× PAT) and $1,499m in FY2024. |
| 2. Corporate cash vs interest earned | Interest on corporate cash and investments $167m on average corporate cash of ~$4,297m = 3.89% implied yield (FY2024: $256m on ~$4,584m = 5.59%). | Consistent with falling short-term US rates and the run-off of held-to-maturity investments from $398m to zero. No unexplained gap between the cash balance and what it earns. |
| 3. Implied interest rate on debt | Not computable for FY2025: the company ended the year with zero drawn borrowings while paying $32m of credit-facility interest; it drew $4,752m and repaid $4,752m during the year. Cash paid for interest was $31m. At 30 June 2026 there is $2,170m of long-term borrowings carrying a 0.00% coupon. | Facility fees and intraday liquidity draws generate interest expense without a year-end balance. A zero-coupon convertible is a normal instrument for a high-multiple issuer; its cost is the embedded equity option and potential dilution, not cash interest. |
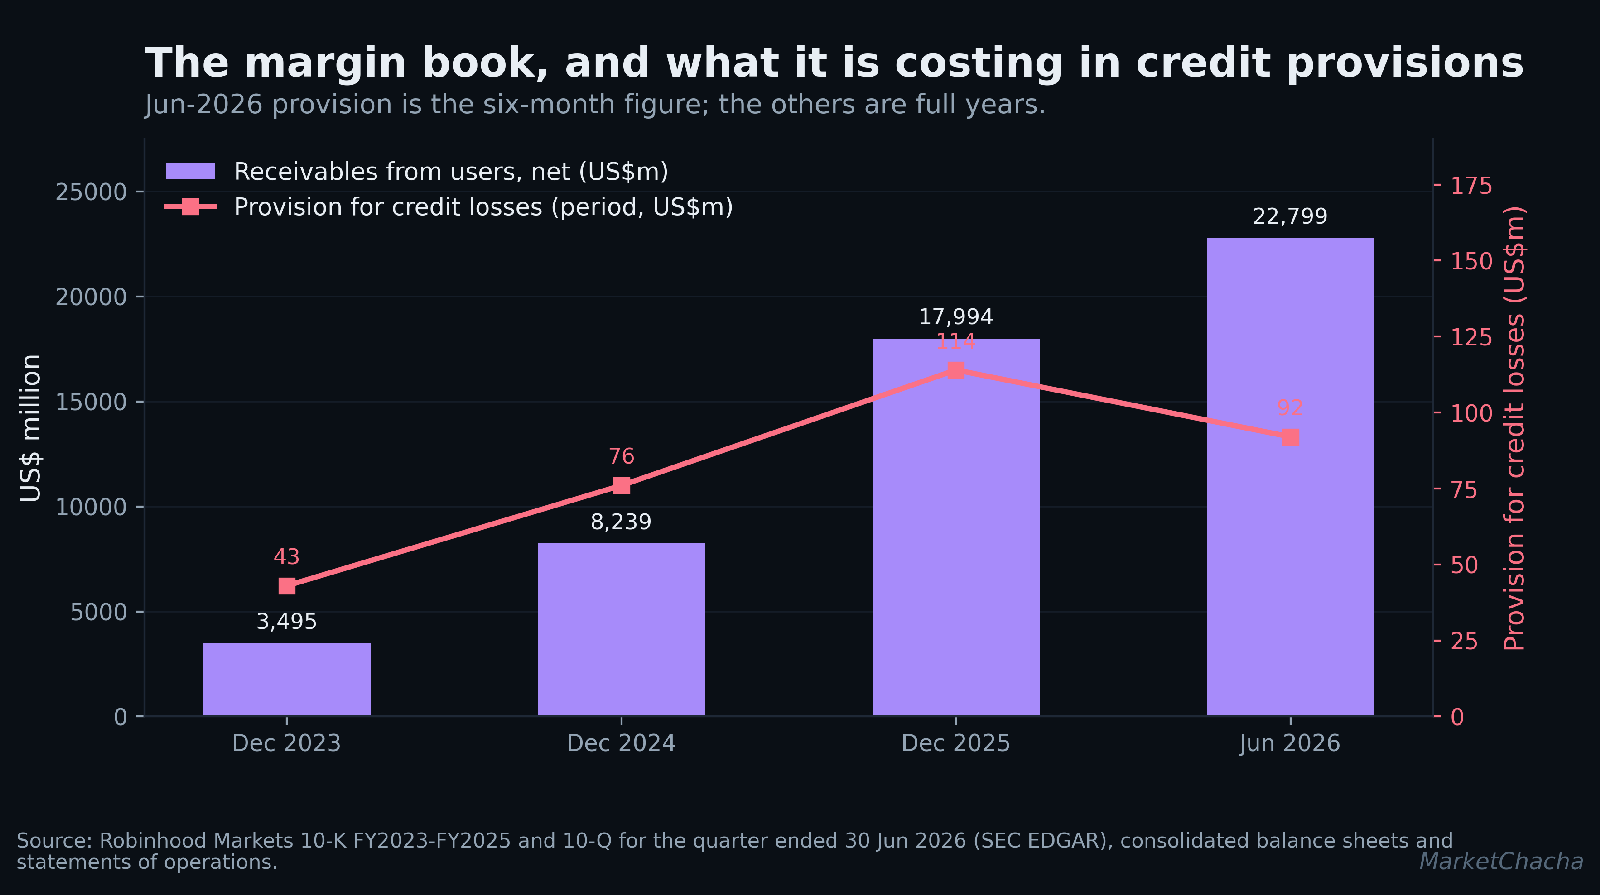
| 4. Receivable and inventory days | Not applicable — no inventory, and trade receivables are not the operating asset. The analogue is the margin book: receivables from users $3,495m → $8,239m → $17,994m → $22,799m across Dec 2023, Dec 2024, Dec 2025 and Jun 2026. Receivables as a multiple of revenue went from 2.79× to 4.02×. Provision for credit losses rose $76m → $114m (+50%) and $52m → $92m (+77%) in the first half. | In margin lending the receivable is the loan and it is collateralised by the customer's own securities; growth in it is growth in the business, not slow collection. The company reports a record $21.6bn margin book, up 127% year-on-year. |
| 5. Related-party transactions | Zero operating related-party revenue or purchases disclosed under Item 404. Disclosed items are financing and governance arrangements with Ribbit Capital entities, indemnification agreements, and the founders' voting and exchange agreements. | A clean result. Nothing further to explain. |
| 6. Insider net selling | 25 Aug 2025 – 25 Aug 2026: 10,743,193 shares sold for ~$1,241.9m at an average $115.60; a single purchase block of 680,000 shares for $55.3m. Ratio of sales to purchases: about 22:1 by value. | Founder and executive diversification after a large price move, usually through pre-set 10b5-1 plans. Neither founder has publicly reduced voting control. |
| 7. Auditor | Ernst & Young LLP throughout the five years. No resignation, no dismissal, no qualified opinion, no restatement, no material weakness. One critical audit matter in FY2025: transaction-based revenues from order routing. Audit fees $11.2m; non-audit fees 4.8% of total. | A clean audit record with a low non-audit fee ratio. |
| 8. Subsidiaries and jurisdictions | Exhibit 21 lists 17 entities, all US (12 Delaware, 2 Florida, 3 Hawaii). Five non-US entities in Lithuania, Luxembourg, Slovenia, Singapore and the UK are named in the 10-K body but not on Exhibit 21, which states non-significant subsidiaries were omitted. | Item 601(b)(21)(ii) of Regulation S-K expressly permits the omission. The foreign entities are regulated operating businesses, not holding vehicles, and each is named with its regulator in the 10-K. |
| 9. Dilution and issuance | Diluted shares 890.9m → 918.8m over three years, net of $1.5bn of buybacks. No preferential allotment or discounted placement. The June 2026 convertible adds potential dilution above a conversion trigger set at 130% of the conversion price. | SBC has fallen from 46.7% of revenue to 6.8%; buybacks have more than offset gross issuance in dollar terms, which is why paid-in capital is shrinking. |
| 10. Other income as % of PBT | FY2025: 0.7% — clean. Q2 FY2026: 19.0%, of which $129m is a deconsolidation gain worth $0.14 of $0.62 diluted EPS. | Deconsolidating a fund on a genuine change of control produces a real GAAP gain. It is non-recurring and non-cash, and the company disclosed both the amount and the per-share effect in its own release. |
| 11. Capex vs depreciation | FY2025 capex $54m against D&A of $86m — a ratio of 0.63×. Net PP&E is $154m on $38,137m of assets. | A brokerage's assets are financial, not physical. Under-investment in plant is not a meaningful concern here; technology spend runs through the P&L as technology and development ($897m). |
| 12. Valuation vs a named peer | At $108.13 (21 Aug 2026) the market capitalisation is about $97.2bn. Trailing-twelve-month net income (FY2025 less H1 FY2025 plus H1 FY2026) is $2,072m, so the trailing P/E is about 46.9×. Book value at 30 June 2026 is $9,541m, so P/B is about 10.2×. Interactive Brokers (IBKR) trades at a market capitalisation of about $158.7bn on a trailing P/E of 36.95×. | Multiples are stated as arithmetic, not as a judgement. Growth rates, business mix and capital structure differ materially between the two. |
What we could not verify
- The complete list of foreign subsidiaries. Exhibit 21 omits non-significant subsidiaries. We identified five non-US entities from the 10-K body; there may be others.
- Which market makers make up the remaining 36% of the FY2025 revenue that came from liquidity providers. Only counterparties above 10% must be named.
- Data-centre and cloud infrastructure locations, and the identity of the "network of program banks" holding swept customer cash. Neither is disclosed.
- The current status of the New Jersey, Maryland and Connecticut gaming matters, and any Ohio or Nevada actions. We found no primary-source document for an Ohio Casino Control Commission letter or a Nevada order against Robinhood, only secondary reporting, so neither is stated as fact above.
- Any CFTC-issued document. Robinhood's own newsroom describes a February 2025 formal CFTC request to roll back a Super Bowl event-contract market; we found no corresponding document on cftc.gov.
- The SEC's closure of the Robinhood Crypto investigation is disclosed by the company, not by the SEC — the agency does not routinely publish non-enforcement closures.
- Q1 FY2026 line items not separately disclosed were derived by subtracting the reported three-month figures from the six-month figures in the same 10-Q; where checkable against the Q1 10-Q they matched exactly.
- Year-end closing prices before 2026 are reconstructed from the proxy's pay-versus-performance total-shareholder-return index applied to the first-day close, cross-checked against a third-party price history for FY2022–FY2024.
What would change the picture
- The next customer-concentration note. Citadel Securities went from 13% to 16% of revenue in one quarter. Watch whether the total for market makers keeps falling while the largest single name keeps rising.
- Provision for credit losses against the margin book. The receivable has grown 6.5× in thirty months; the provision line is the first place stress would appear.
- Whether event contracts hold. $156m in one quarter from a standing start, against unresolved state gaming challenges. Both the revenue line and the legal line are checkable each quarter.
- The effective tax rate. 12.7% → 15.8% → 19.2% over three quarters. Rising rates compress reported EPS growth even when pre-tax profit does not slow.
- Other income. Q2 FY2026's $135m sets a base that will be hard to repeat. Watch the year-on-year comparison in Q2 FY2027.
- Insider Form 4s and the convertible. Whether founder selling continues, and whether the $2.2bn zero-coupon note moves into conversion territory.
- The FY2026 audit report — whether Ernst & Young remains, and whether the critical audit matter changes.
Sources
- Robinhood Markets, Inc. Form 10-K for FY2025, filed 18 February 2026
- Form 10-K/A (Amendment No. 1) for FY2025, filed 20 February 2026
- Exhibit 21.1 — Subsidiaries of the Registrant, FY2025 10-K
- Form 10-K for FY2024, filed 18 February 2025
- Form 10-Q for the quarter ended 30 June 2026, filed 30 July 2026
- Form 10-Q for the quarter ended 31 March 2026, filed 29 April 2026
- Q2 2026 earnings release, Exhibit 99.1 to Form 8-K dated 29 July 2026
- Definitive proxy statement (DEF 14A), filed 22 April 2026
- IPO prospectus (Form 424B4), filed 30 July 2021
- Form 8-K, Item 2.05 — workforce reduction, 16 June 2026
- Form 8-K — $2.2bn 0.00% convertible senior notes due 2029, 25 June 2026
- Form 8-K, Item 5.02 — principal accounting officer appointment, 25 June 2026
- Form 8-K, Item 5.02 — CFO retirement announcement, 5 November 2025
- Form 8-K, Item 5.02 — CFO appointment, 10 February 2026
- Form 8-K, Item 5.02 — CTO separation, 8 May 2026
- All Form 4 insider filings, Robinhood Markets, Inc. (CIK 0001783879)
- SEC XBRL company facts, CIK 0001783879 (five-year financial series)
- SEC press release 2020-321, 17 December 2020 and the administrative order
- FINRA Letter of Acceptance, Waiver and Consent, 30 June 2021
- NY Department of Financial Services press release, 2 August 2022
- Connecticut Banking Commissioner order, 10 August 2023
- Massachusetts Securities Division consent order, January 2024
- SEC press release 2025-5, 13 January 2025 and the administrative order
- FINRA news release, 7 March 2025
- New Jersey Division of Gaming Enforcement cease-and-desist, 27 March 2025
- Maryland Lottery and Gaming Control Commission cease-and-desist, 7 April 2025
- Connecticut Department of Consumer Protection cease-and-desist, 2 December 2025
- Yahoo Finance — HOOD closing price of $108.13 on 21 August 2026, market capitalisation and 52-week range
- Yahoo Finance — Interactive Brokers (IBKR) market capitalisation and trailing P/E
FAQ
How does Robinhood make money if trading is free? Three ways, all in Note 5 of the 10-K: market makers pay it for routing customer orders ($2,326m in FY2025); it lends to customers against their securities ($573m of margin interest); and it earns interest on customer and corporate cash. Gold subscriptions added $179m.
What does "55% of revenue from market makers" actually mean? It is the company's own customer-concentration disclosure: in FY2025, 55% of total net revenues came from market makers and liquidity providers, with Citadel Securities alone at 13% and Wintermute Trading Ltd at 6%. In the quarter ended 30 June 2026 the total was 47% and Citadel Securities was 16%.
Do the founders still control the company? Yes, by vote. Class B shares carry ten votes each. As of 8 April 2026, Baiju Bhatt held 32.0% and Vladimir Tenev 26.1% of total voting power, and all directors and executive officers as a group held 58.6% — while owning about 1.5% of the Class A stock.
Was the Q2 FY2026 result as strong as the headline? Revenue growth of 32.3% year-on-year is entirely operating. Net income growth of 48.4% is not: $135m of the $709m pre-tax profit, and $0.14 of the $0.62 diluted EPS, came from other income, of which the company attributes $129m to gains primarily related to deconsolidating Robinhood Ventures Fund I. Excluding it, pre-tax profit grew 30.8%.
Does Robinhood have any offshore subsidiaries? None appear on Exhibit 21 to the FY2025 10-K, which lists 17 subsidiaries all incorporated in the United States. The body of the same 10-K names five non-US regulated operating entities in Lithuania, Luxembourg, Slovenia, Singapore and the UK. The exhibit states non-significant subsidiaries were omitted, which Regulation S-K permits.
How much debt does the company carry? None at 31 December 2025. On 25 June 2026 it issued $2.2 billion of convertible senior notes due 1 October 2029 that bear a 0.00% coupon, taking long-term borrowings to $2,170m at 30 June 2026.
Independent research for education and discussion only. Not investment advice, not a recommendation, and not a rating — we issue no buy/sell calls and no target prices. Every figure is sourced from the primary documents linked above; figures can be restated and we can make mistakes, so always verify against the original. Nothing here alleges wrongdoing by any company or individual: where a fact raises a question we state the fact, cite it, and give the benign explanation alongside. Offshore holding structures, pledging and preferential allotments are all legal and common — they are disclosed here as facts, not as accusations.
This article is for educational and informational purposes only. It is not financial advice, investment recommendation, or a solicitation to buy or sell securities. Investing involves significant risks. I am not a SEBI-registered investment advisor. Readers should consult their own financial advisor and conduct their own research before making any investment decisions.
Comments
Join the conversation
Sign in to join the conversation.
Follow replies, add your view, and take part in the discussion.
Sign in to commentLoading comments...