

Why did MSCI fall ~11% today — on a record quarter for index fees?
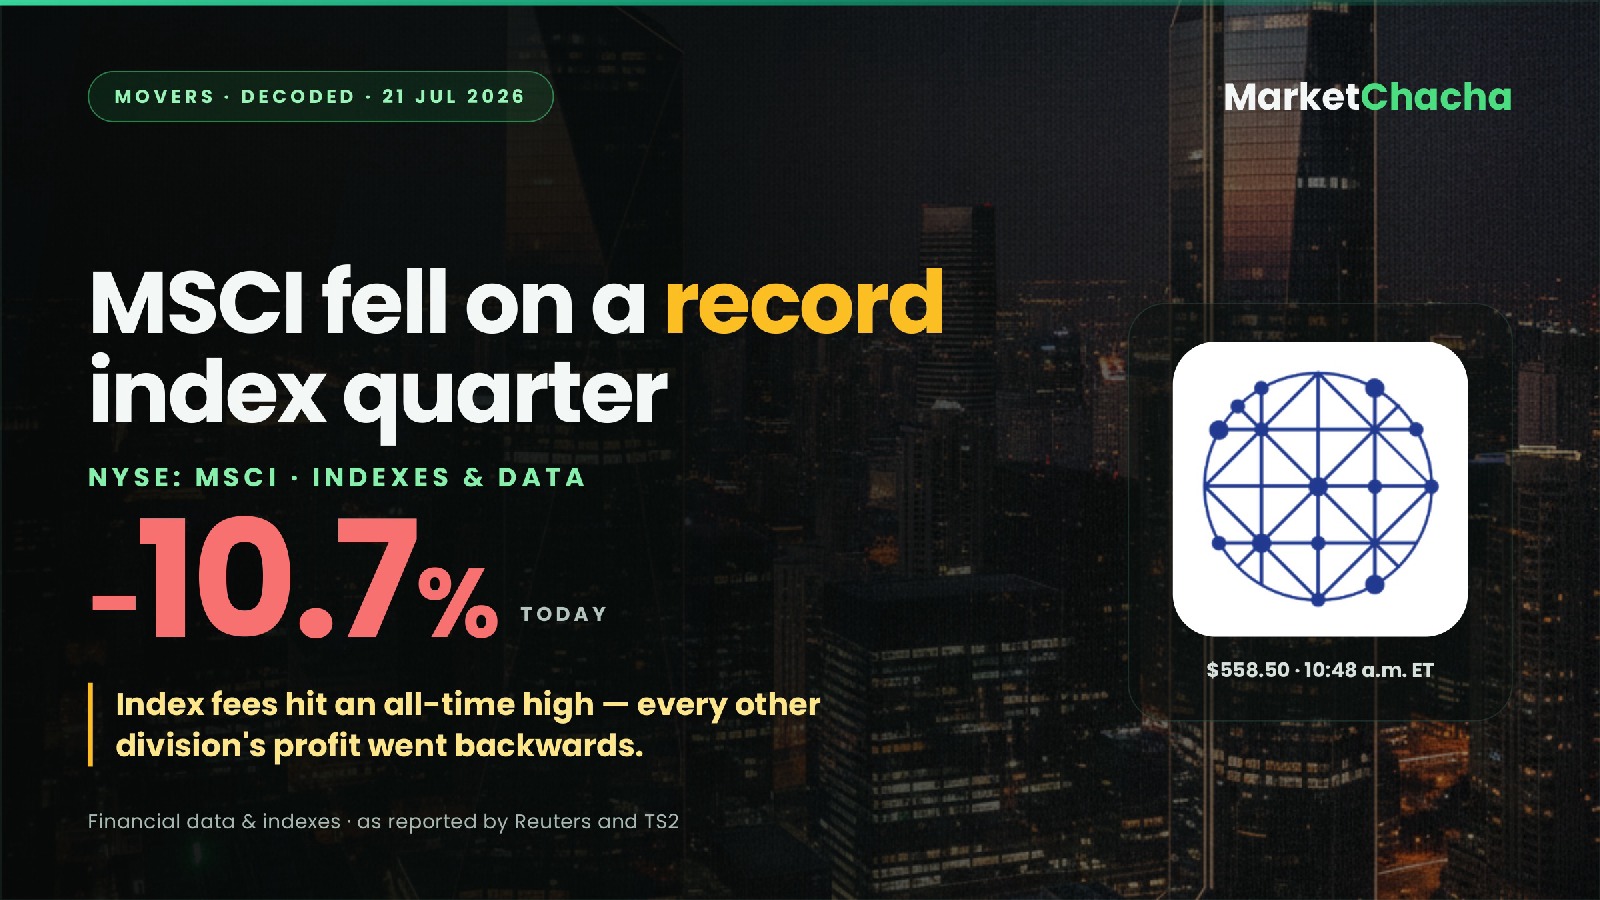
MSCI runs the benchmarks a huge chunk of the world's money is measured against. On Tuesday it reported its best-ever quarter for index fees — and the stock fell 10.7% to $558.50 by 10:48 a.m. ET, as reported by TS2 citing company data. That combination is worth understanding, because it's a lesson in how the market actually reads an earnings report.
What happened
Q2 revenue rose 12.2% to $867.0 million and adjusted EPS rose 18.5% to $4.94 — about 4 cents under the analyst consensus, per GuruFocus and Seeking Alpha. Those are good numbers. The selling wasn't about the quarter that just happened. It was about the two lines management changed for the rest of the year.
Why it moved
First, costs. MSCI raised its 2026 operating expense guidance to $1.535–1.575 billion, up from $1.490–1.530 billion — the midpoint moved $45 million higher. Management pinned it on acquisitions, incentive pay and new investment, and the outlook assumes its $120 million First Street acquisition closes this quarter. Free-cash-flow guidance only went up $15 million (to a $1.515 billion midpoint). So costs rose three times faster than the cash the company expects to keep.
Second — and this is the real story — where the profit came from. Index adjusted EBITDA grew $67.6 million. Total company adjusted EBITDA grew just $64.1 million. Do the subtraction: the Index division supplied 105% of group profit growth, and everything else combined went backwards by $3.5 million.
The business — four divisions, one engine
- Index (the engine): revenue +17.5% to $511.0m, EBITDA margin 77.8%. Asset-based fees — a slice of the assets tracking MSCI benchmarks — jumped 26.6% to $233.1m. MSCI had over $18 trillion in benchmarked assets as of Dec 2025, including $2.3 trillion in ETFs.
- Analytics: revenue +6.6%, but EBITDA fell 5.0% and the margin dropped 560 basis points to 46.5% — its costs grew 19.2%, roughly three times its revenue.
- Private Assets: revenue +4.9%, EBITDA −14.1%, margin down 510bps to 22.9%.
- Sustainability & Climate: the small bright spot — revenue +3.4%, EBITDA +12.3%.
Here's the thing to take away: asset-based index fees are essentially a levered bet on markets going up. When indices rise, MSCI's cut rises with no extra work. That's a wonderful business — but investors don't pay a premium multiple for a bet they can make themselves. They pay it for the subscription businesses that keep earning when markets fall. Those are the ones whose margins just compressed.
Is it expensive?
Even after the fall, MSCI trades around a 35.7x P/E on a market cap of roughly $45.5 billion, per GuruFocus. That's a rich multiple in absolute terms — it assumes years of compounding ahead. Compare it to S&P Global (SPGI), the obvious alternative, on roughly 27.8x with a market cap near $127 billion. MSCI is the smaller, pricier, more index-concentrated way to own this theme. Worth noting too: MSCI carries $6.4 billion of debt, about 3.1x adjusted EBITDA.
Who it touches
- Anyone holding an index fund or ETF — those licensing fees sit inside your expense ratio. MSCI's asset-based fees rising 26.6% is, in part, your money.
- SPGI and FactSet (FDS) — both fell far less on the day (−2.4% and −1.0%), which tells you the market read this as an MSCI margin problem, not an industry one.
- MSCI's own buyback — the company had repurchased $147.2m at an average $557.66. Tuesday's price left that barely above water, with about $1.6 billion still authorised.
What to watch
One number decides the next quarter: whether Analytics margin stops falling. If it stabilises, today looks like an overreaction to a guidance tweak. If it keeps sliding while Index carries the whole company, the market will keep asking why it should pay 35x for what is increasingly one very good division attached to three that aren't. And remember the flip side of asset-based fees — a falling market shrinks them automatically, with no announcement required.
As of 21 Jul 2026, ~12:30 p.m. ET. Sources: TS2, GuruFocus, Seeking Alpha, Reuters via AOL. All prices and figures as reported by those sources. For discussion and education only — not investment advice. Verify before acting.
This article is for educational and informational purposes only. It is not financial advice, investment recommendation, or a solicitation to buy or sell securities. Investing involves significant risks. I am not a SEBI-registered investment advisor. Readers should consult their own financial advisor and conduct their own research before making any investment decisions.
Comments
Join the conversation
Sign in to join the conversation.
Follow replies, add your view, and take part in the discussion.
Sign in to commentLoading comments...