

Zen Technologies (ZENTEC): the full file — the numbers, the owners, and what the filings actually show
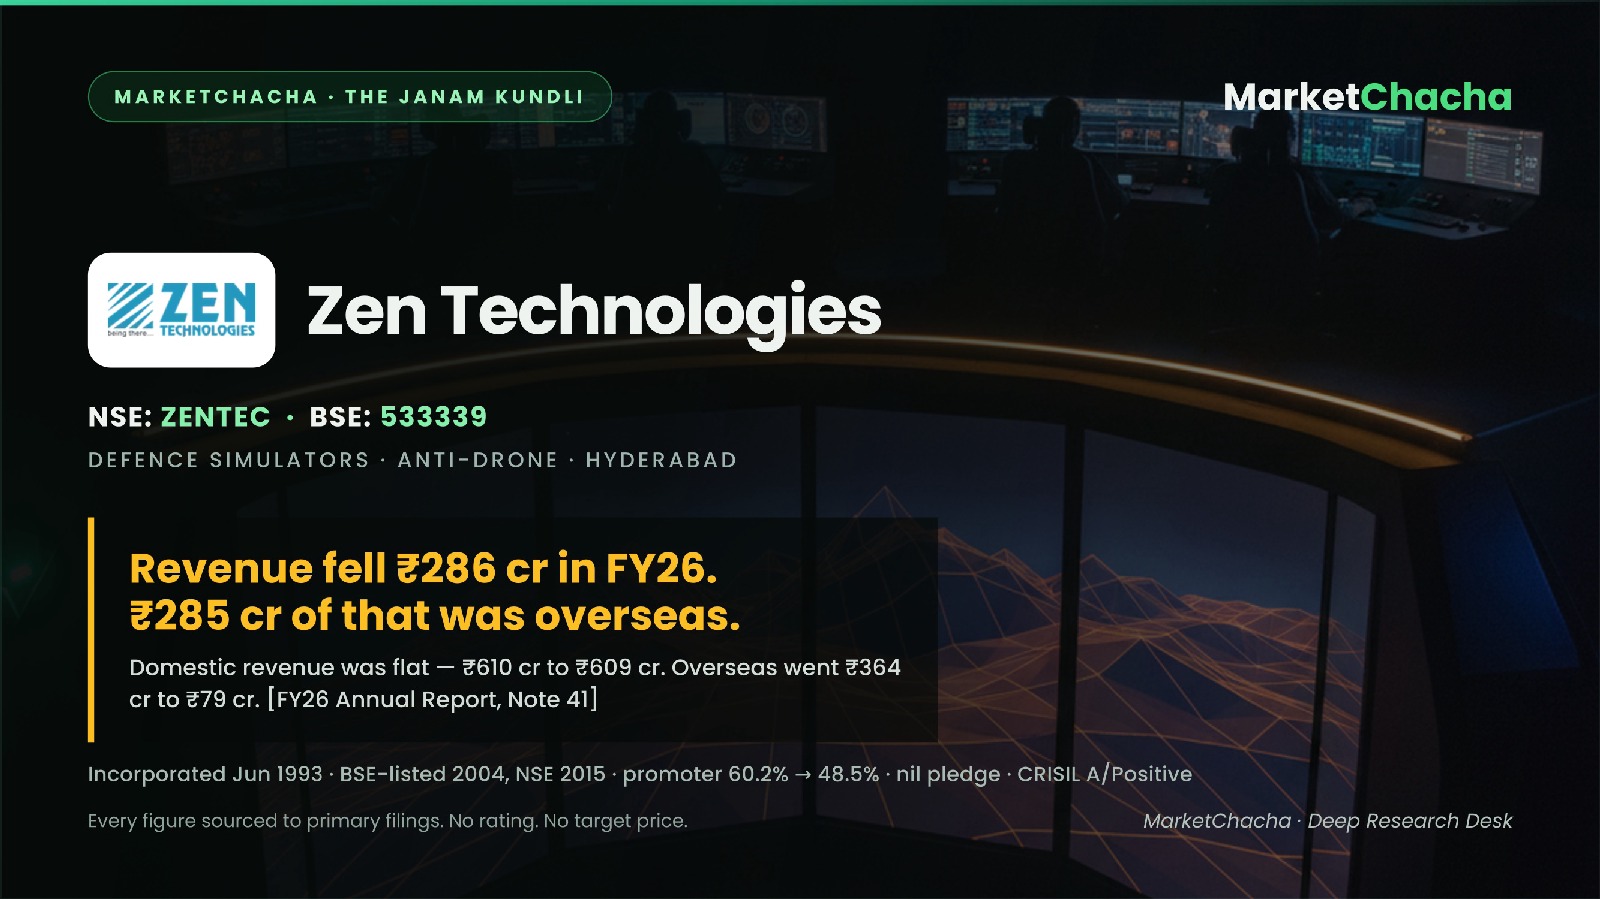
Zen Technologies Limited builds combat training simulators — tank and infantry gunnery trainers, driving simulators, live-fire target systems — and anti-drone equipment, and sells them almost entirely to armed forces and police organisations. In FY2026 (year ended 31 March 2026) that business produced ₹687.69 crore of consolidated revenue and ₹193.45 crore of profit attributable to owners.
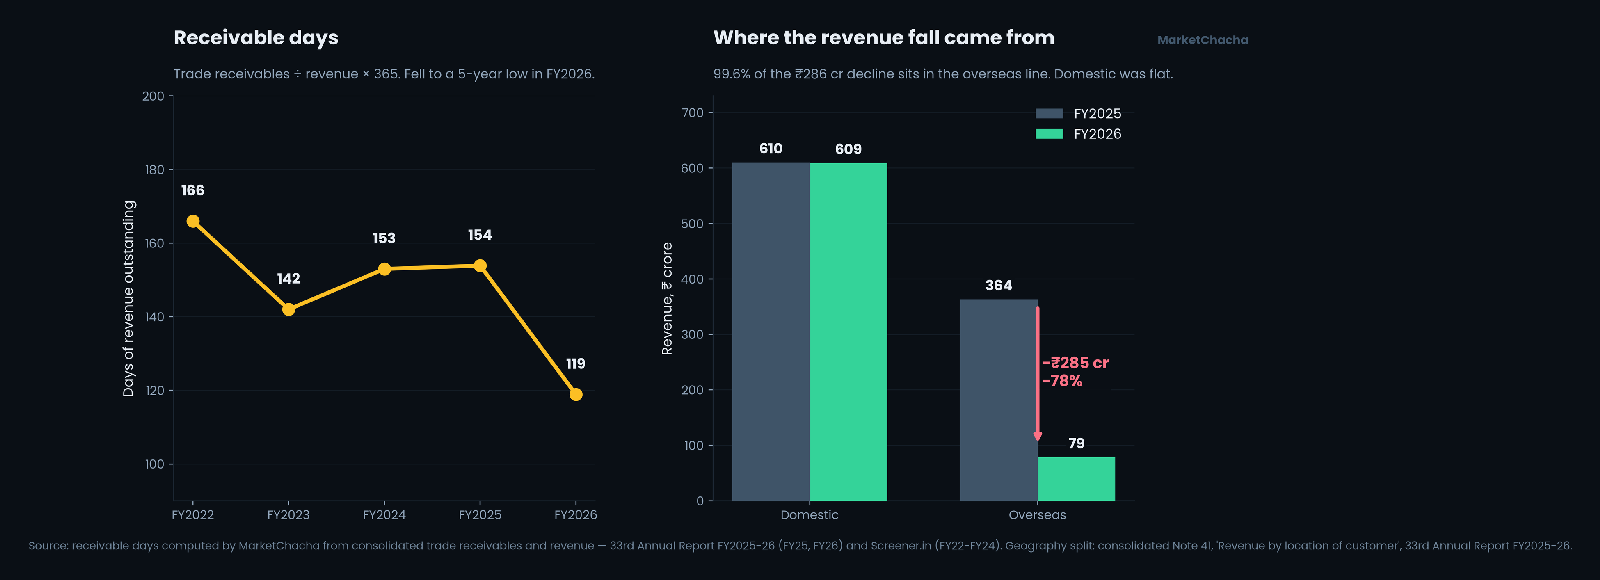
Both numbers are down. Revenue fell 29.4% and owners' profit 31.0% from FY2025 — after four years in which revenue had risen 17.7 times. The audited geography note shows where the fall came from: domestic revenue was flat, at ₹610 crore then ₹609 crore, while overseas revenue went from ₹363.52 crore to ₹78.66 crore. 99.6% of the ₹286 crore decline sits in one line. This report walks the company's whole file — incorporation to the June 2026 quarter — and links every document.
Origin — the company's birth certificate
Zen was incorporated on 29 June 1993 in Hyderabad, then in Andhra Pradesh, as a public limited company under the Companies Act 1956, with a certificate of commencement of business dated 9 July 1993. Its CIN is L72200TG1993PLC015939.
It has changed its name once. It was incorporated as "Zen Technologies and Computers Limited"; a board resolution of 31 October 1994 and a shareholders' resolution of 26 November 1994 shortened it to "Zen Technologies Limited", and the Registrar issued a fresh certificate of incorporation on 22 February 1995. The August 2024 placement document names the promoters as Kishore Dutt Atluri, Ravi Kumar Midathala and Ashok Atluri; the annual report describes Kishore Dutt Atluri as "Founder, President and Joint Managing Director".
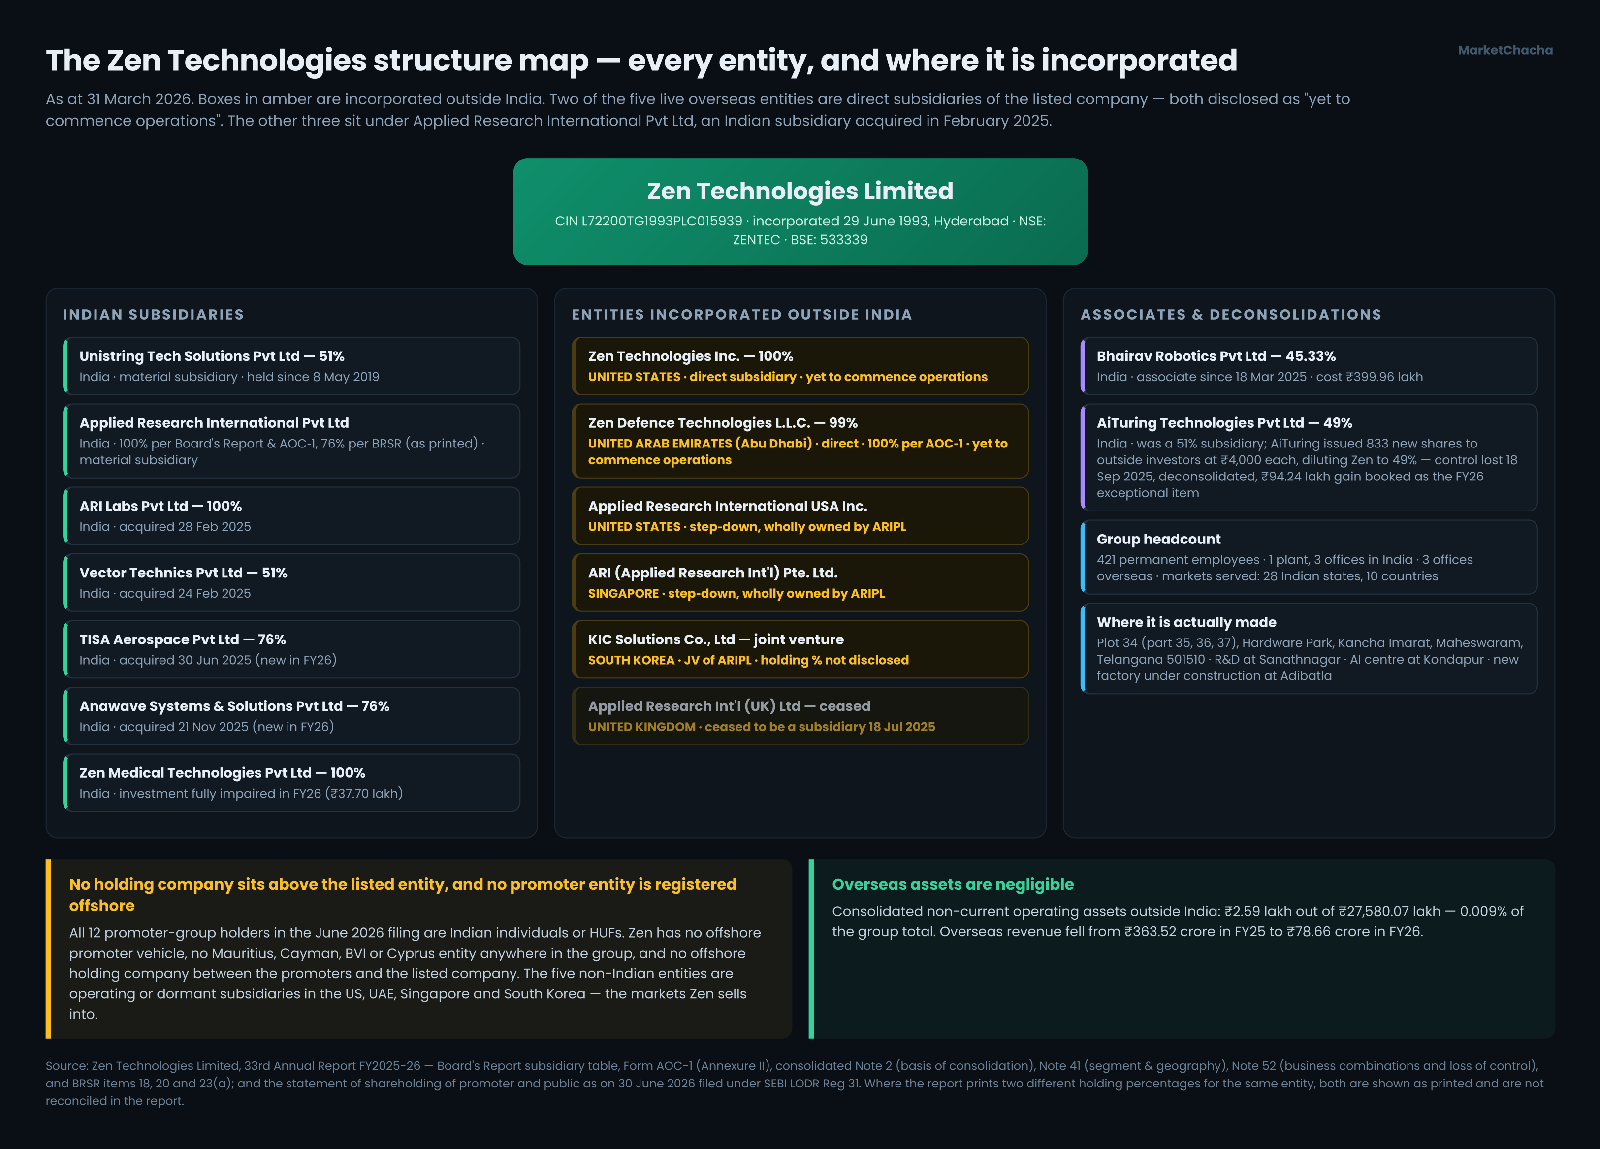
The IPO was on 30 September 2000 — 19,10,000 equity shares of ₹10 face value issued at par, at ₹10, with no premium. Related tranches the same year included 10,00,000 shares to IDBI at ₹10 and a firm allotment of 12,74,360 shares under the prospectus. Shares have been listed on BSE since 30 September 2004 and on NSE since 30 March 2015. There is no group holding company above the listed entity and no promoter vehicle registered outside India.
The business — what they actually sell
Zen reports a single operating segment, "Defence and Homeland", under Ind AS 108. The board is the chief operating decision maker and, per the note, does not review discrete product-line or geography performance — so there is no product-wise revenue split in the audited accounts. What is disclosed: revenue recognised from goods transferred at a point in time was ₹611.11 crore in FY2026 (FY2025: ₹932.21 crore) and from services ₹76.58 crore (FY2025: ₹41.43 crore). Services roughly doubled while product sales fell a third.
The products themselves are described only in the company's own materials, not the financial statements: containerised and full-mission gunnery trainers, driving simulators, live-range instrumented target systems, small-arms simulators, and an anti-drone family. Management sized the anti-drone opportunity at "₹2,000 crore-plus" on the July 2026 call — an estimate, not a booked order.
Who actually buys from them
This is the concentration disclosure, quoted from the audited note:
Consolidated (Note 41): "There are three customers individually contributing more than 10% of Group's revenue and these customers contribute 56.94% of the revenue for the year ended on 31 March 2026. For the year ended 31 March 2025 there is one customer contributing 60.96% of the revenue for the year."
Standalone (Note 42): three customers together contributed 74.41% of the parent company's FY2026 revenue (FY2025: 63.77%).
So roughly three-quarters of the listed entity's revenue comes from three buyers, and none of the three is named anywhere in the report. The credit-risk note says only that debtors are "predominantly the Government of India (Indian Defence Services, Ministry of Home Affairs), Public Sector Undertakings"; no percentage of revenue from the Government of India is disclosed. Neither is required — Ind AS 115 mandates the concentration, not the identity — but a reader cannot establish the counterparties from the filing. Two post-year-end announcements indicate the customer: MoD orders of ₹177.5 crore (22 July 2026, tank and crew gunnery simulator upgrades) and ₹295 crore (10 August 2026).
Where it is actually made — plants and supply chain
The BRSR states the group operates one plant and three offices in India, and three offices internationally, with 421 permanent employees and no permanent workers. Manufacturing is at Plot No. 34 (part 35, 36 and 37), Hardware Park, Kancha Imarat, near Ravirala village, Maheswaram, Telangana 501510, near Shamshabad airport. The registered office and R&D centre are at B-42 Industrial Estate, Sanathnagar, Hyderabad; there is an AI development centre at Kondapur. A new factory is under construction at Adibatla, with capital commitments of ₹663.38 lakh (consolidated) / ₹3,095.55 lakh (standalone) outstanding at 31 March 2026 — the standalone commitment is more than five times last year's. The Adibatla street address is not disclosed.
On the supply side, no supplier is named and no single-source dependency is disclosed. Cost of materials consumed was ₹185.30 crore against ₹345.19 crore. The largest identifiable supplier relationship is internal — see related parties, below.
Five years of numbers
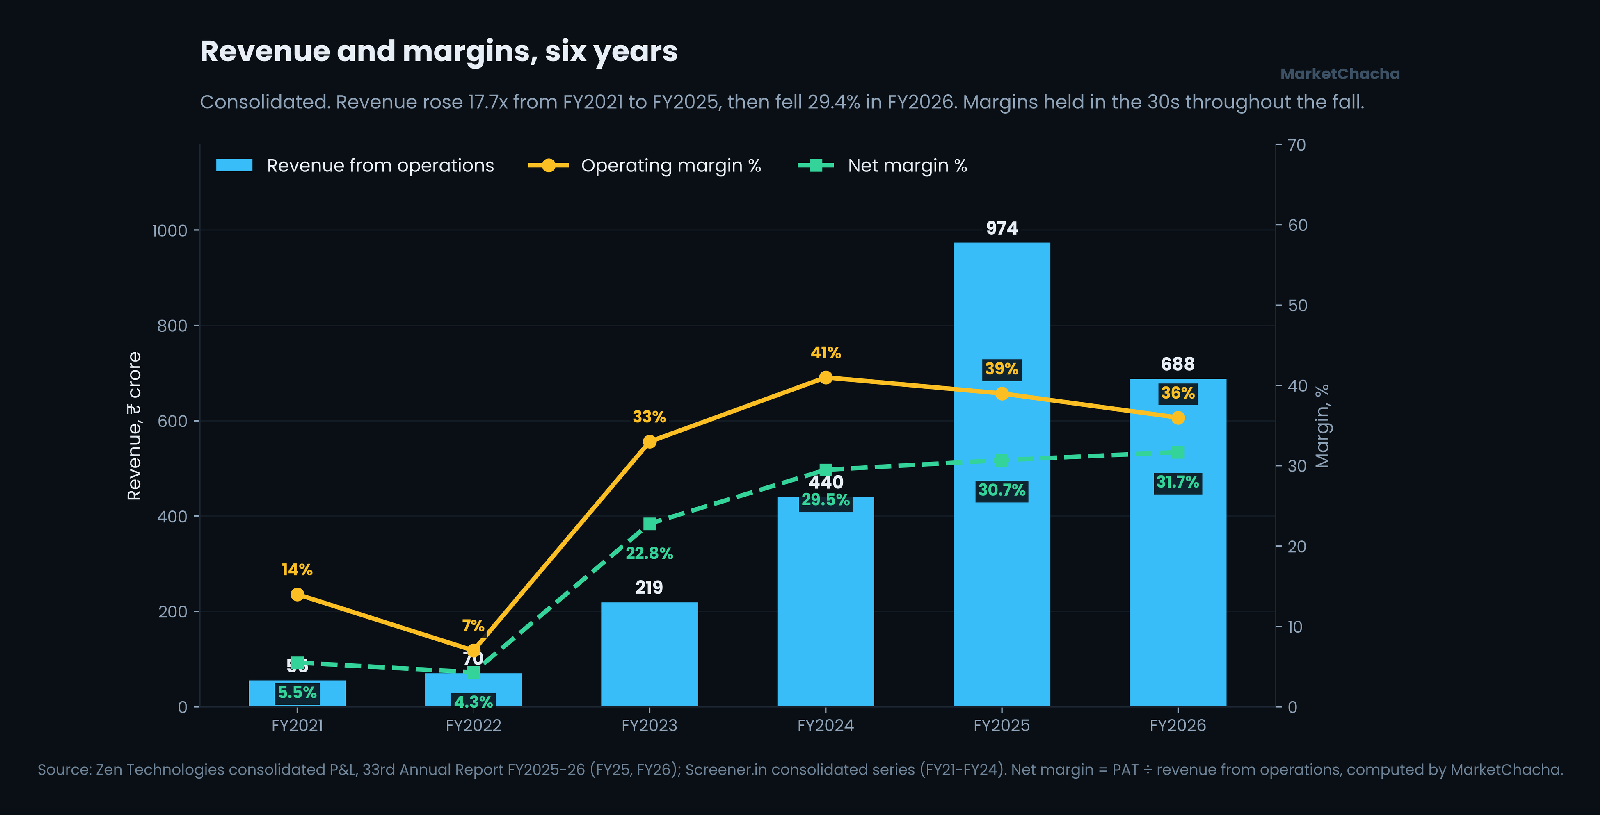
| ₹ crore, consolidated | FY21 | FY22 | FY23 | FY24 | FY25 | FY26 |
|---|---|---|---|---|---|---|
| Revenue | 55 | 70 | 219 | 440 | 973.64 | 687.69 |
| Operating profit | 7 | 5 | 73 | 181 | 373.52 | 247.24 |
| Operating margin | 14% | 7% | 33% | 41% | 38.4% | 36.0% |
| Net profit (total) | 3 | 3 | 50 | 130 | 299.33 | 217.93 |
| Cash from operations | 6 | −44 | 116 | 13 | 31.03 | 244.60 |
The arithmetic. Revenue ₹55 cr → ₹687.69 cr over five years is a compound 65.7% a year — though FY2021 was a Covid-depressed base; on the four years from FY2022's ₹70 cr it is 77.0% a year. EPS ₹0.39 → ₹21.52 is 123.0% compounded. Five-year price return: the BSE close on 27 August 2021 was ₹100.35 and the NSE close on 28 August 2026 was ₹1,833.70 — +1,727%, an 18.3x, or 78.8% a year. There has been no split since November 2014 and no bonus ever, so the comparison needs no adjustment. The stock is 10.3% below its ₹2,043.70 fifty-two-week high.
Valuation, for context only. 9,02,90,356 shares × ₹1,833.70 = about ₹16,557 crore of market capitalisation — 85.6x FY2026 owners' profit of ₹193.45 crore and 8.8x owners' equity of ₹1,889.06 crore. Two named comparators on the same date: Bharat Electronics at 49.9x earnings / 12.6x book; Data Patterns (India) at 99.6x / 15.6x. Trailing multiples for Zen range from 82x to 120x across data providers depending on the earnings window — the denominator is moving fast. We draw no conclusion from this.
Income statement — FY2026 vs FY2025 (consolidated)
| ₹ crore | FY2026 | FY2025 | Change | % |
|---|---|---|---|---|
| Revenue from operations | 687.69 | 973.64 | −285.95 | −29.4% |
| Cost of materials consumed | 185.30 | 345.19 | −159.88 | −46.3% |
| Changes in inventories (FG/WIP) | −19.83 | 23.81 | −43.64 | n.m. |
| Manufacturing expenses | 45.32 | 15.73 | +29.59 | +188.1% |
| Employee benefits expense | 126.94 | 88.76 | +38.19 | +43.0% |
| Other expenses | 102.71 | 126.63 | −23.92 | −18.9% |
| EBITDA | 247.24 | 373.52 | −126.28 | −33.8% |
| EBITDA margin | 36.0% | 38.4% | −2.4 pp | |
| Other income | 85.42 | 58.39 | +27.04 | +46.3% |
| Finance costs | 10.27 | 10.38 | −0.10 | −1.0% |
| Depreciation & amortisation | 24.39 | 15.41 | +8.97 | +58.2% |
| Share of associates/JV | −2.31 | −0.05 | −2.26 | n.m. |
| Exceptional items | +0.94 | — | +0.94 | n.m. |
| Profit before tax | 296.64 | 406.07 | −109.43 | −26.9% |
| Tax | 78.72 | 106.74 | −28.02 | −26.3% |
| PAT (total) | 217.93 | 299.33 | −81.41 | −27.2% |
| to owners | 193.45 | 280.24 | −86.79 | −31.0% |
| to minorities | 24.47 | 19.09 | +5.38 | +28.2% |
| Basic EPS (₹) | 21.52 | 32.07 | −10.55 | −32.9% |
| Net margin (owners) | 28.1% | 28.8% | −0.7 pp |
Balance sheet and cash flow — FY2026 vs FY2025 (consolidated)
| ₹ crore | FY2026 | FY2025 | Change | % |
|---|---|---|---|---|
| Total equity (incl. minorities) | 1,949.08 | 1,735.91 | +213.17 | +12.3% |
| Non-controlling interests | 60.02 | 35.22 | +24.80 | +70.4% |
| Total borrowings | 3.38 | 54.15 | −50.77 | −93.8% |
| Trade payables | 49.33 | 25.47 | +23.86 | +93.7% |
| Total liabilities | 211.14 | 313.11 | −101.97 | −32.6% |
| Property, plant & equipment | 136.94 | 106.43 | +30.51 | +28.7% |
| Capital work-in-progress | 13.34 | 3.55 | +9.79 | +275.3% |
| Goodwill | 76.38 | 70.18 | +6.20 | +8.8% |
| Inventories | 188.19 | 119.27 | +68.92 | +57.8% |
| Trade receivables | 224.01 | 410.43 | −186.42 | −45.4% |
| Cash, bank and deposits (Note 44) | 1,306.42 | 1,181.16 | +125.26 | +10.6% |
| Total assets | 2,160.22 | 2,049.02 | +111.20 | +5.4% |
| Cash from operations | 244.60 | 31.03 | +213.57 | +688.2% |
| Cash used in investing | −161.50 | −1,000.42 | +838.92 | n.m. |
| Cash from financing | −78.32 | +1,006.83 | −1,085.15 | n.m. |
| Capex (PPE + CWIP) | −58.81 | −32.30 | −26.51 | +82.1% |
| Free cash flow | +185.79 | −1.27 | +187.06 | n.m. |
What moved, and why. Revenue fell ₹286 crore; materials fell ₹160 crore, so gross spend tracked volume. The margin squeeze came from the fixed side — employee costs rose 43% and manufacturing expenses trebled while revenue shrank, which is negative operating leverage rather than a pricing problem. Four balance-sheet lines moved more than 40%: receivables fell 45.4%, inventories rose 57.8%, borrowings fell 93.8% and payables rose 93.7%. The receivables-down / inventories-up pair is the signature of a year in which deliveries slipped: goods were built and not yet invoiced, and last year's invoices were collected. That collection is what produced the cash-flow swing — CFO of ₹244.60 crore against ₹31.03 crore, and the first meaningfully positive free cash flow in the series.
Earnings quality. PBT fell ₹109 crore. EBITDA fell ₹126 crore, and other income added back ₹27 crore. So the operating decline was worse than the headline: other income covered a quarter of the EBITDA fall, and it is now 28.8% of PBT against 14.4% in FY2025 and 9.1% in FY2024. That other income is overwhelmingly interest on the deposit pile, and the deposit pile is largely the August 2024 QIP. The tax rate was steady at 26.5% versus 26.3%, so no part of the move came from tax.
The latest quarter, decoded
| ₹ crore, consolidated | Q1 FY27 | Q4 FY26 | QoQ | Q1 FY26 | YoY |
|---|---|---|---|---|---|
| Revenue from operations | 141.64 | 178.00 | −20.4% | 158.20 | −10.5% |
| EBITDA | 39 | 50 | −22.0% | 65 | −40.0% |
| EBITDA margin | 27.32% | 28.1% | −0.8 pp | 40.95% | −13.6 pp |
| Other income | 16 | 23 | −30.4% | 22 | −27.3% |
| Profit before tax | 45.3 | 64 | −29.2% | 76.2 | −40.6% |
| Profit after tax | 31.85 | 47 | −32.2% | 53.1 | −40.0% |
| EPS (₹) | 3.83 | 3.49 | 5.29 |
Three things stand out. Other income of ₹16 crore against PBT of ₹45.3 crore is 35.6% of pre-tax profit — a higher share than the full year. There is an exceptional loss of ₹3.37 crore: inventory of subsidiary Unistring Tech Solutions damaged in a fire on 25 April 2026, which the company says was adequately insured, survey pending. And EPS of ₹3.83 is above Q4's ₹3.49 despite lower PAT, because the owners/minorities split differs; quarterly PAT is reported as ₹31.85 crore by some outlets and ₹34.4–34.5 crore by others, almost certainly owners' share versus total. We use ₹31.85 crore and flag it.
Management's explanation on the 27 July 2026 call was execution timing, not demand: gross margin held at 72.9%, the year-ago quarter carried ₹7.65 crore of provision reversals worth about five margin points, and H2 FY26 orders should be recognised in Q2–Q3 FY27. The stock fell about 9%. Those are the company's words and the market's reaction, not facts about the business.
Five years of cash versus five years of profit
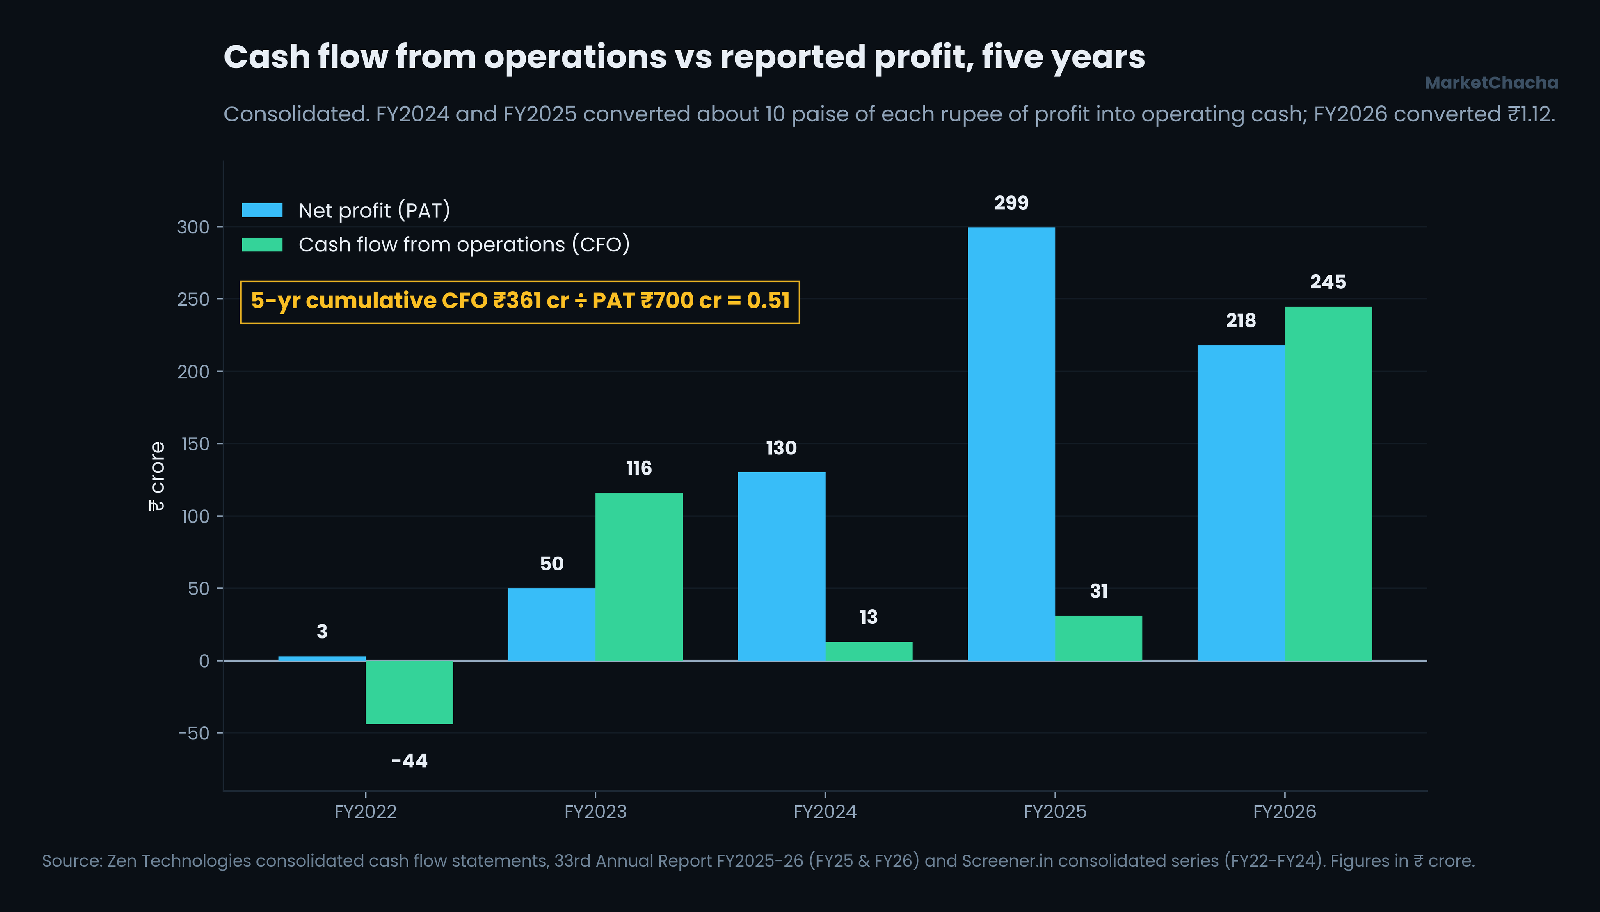
Cumulative CFO of ₹360.64 crore against cumulative PAT of ₹700.26 crore over FY2022–FY2026 gives a ratio of 0.51. Year by year it is a whipsaw, not a steady leak: FY2024 and FY2025 converted about 10 paise of each rupee of profit into operating cash; FY2026 converted ₹1.12. The benign reading — well-evidenced by the receivables and inventory movements above — is that this is long-cycle capital goods sold to government buyers, where working capital absorbs cash on the way up and releases it on the way down. It still bears watching: a 0.51 five-year ratio means half the profit reported over five years has not yet arrived as cash.
Who owns it — and where those owners are registered
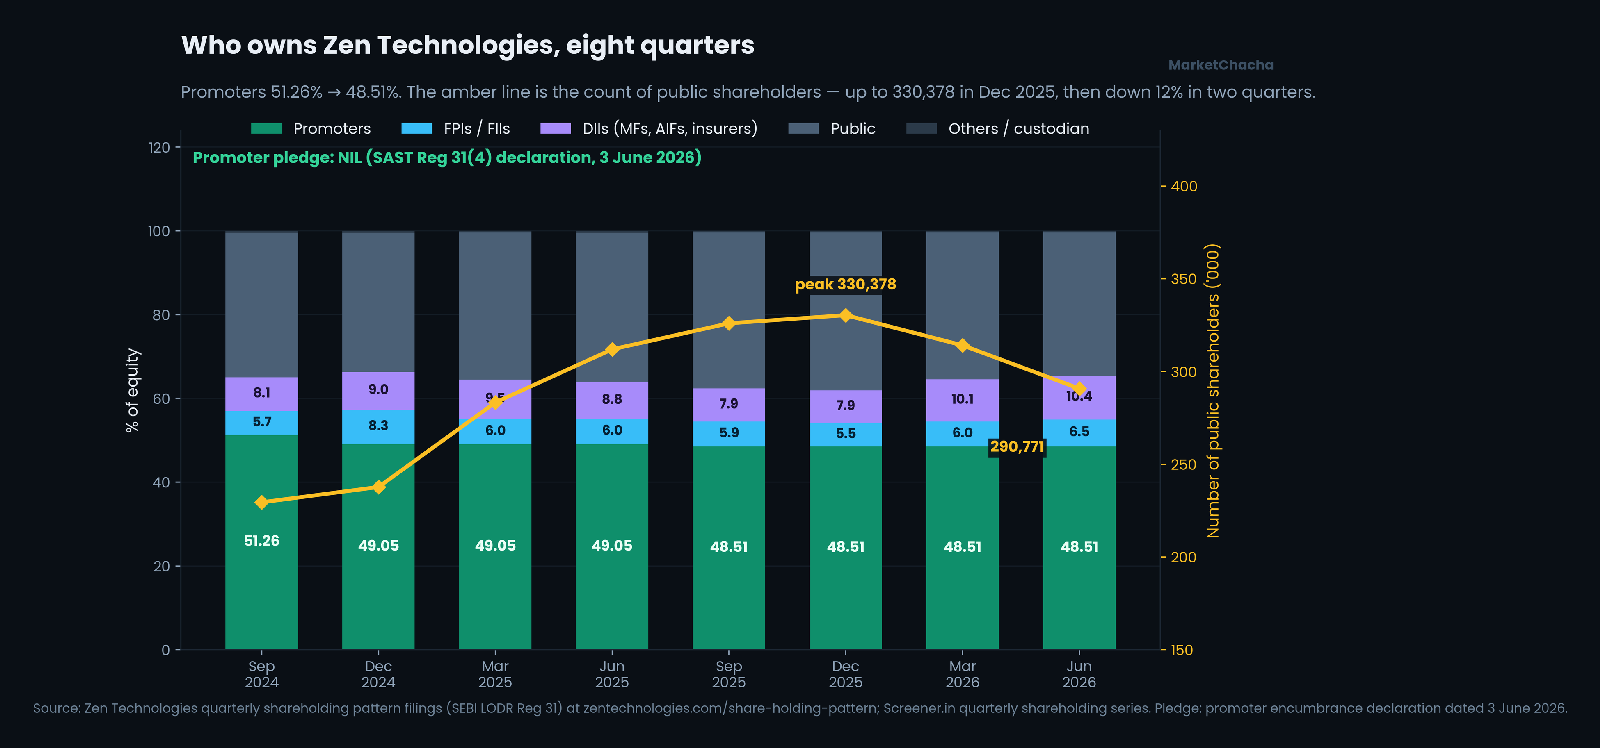
Promoters hold 48.51% across 12 holders, all Indian individuals or HUFs. That is down from 60.19% in March 2022. The path: 60.14% (Mar 2023) → 55.07% (Mar 2024) → 49.05% (Mar 2025) → 48.51% (Sep 2025 onward). The FY2025 annual report records the FY25 leg precisely: Ashok Atluri sold 20,00,000 shares (25.64% → 21.65%) and Kishore Dutt Atluri sold 10,00,000 (18.73% → 16.33%), while Abhilasha Atluri acquired 10,00,000 (1.11%). SAST Reg 29(2) filings dated 12 December 2024 record the two disposals of 10 lakh shares each; prices were not disclosed in the filings, though bulk-deal data for December 2024 shows Motilal Oswal Mutual Fund buying 11.11 lakh shares at around ₹1,800.
The final 0.54-point step down was not a sale. Announcements dated 24 July 2025 and 27 September 2025 record a request for reclassification from promoter to public category and the exchanges' no-objection letter. The individual's name does not appear in the announcement titles.
Promoter pledge is nil. Ashok Atluri filed a SAST Reg 31(4) declaration on 3 June 2026 confirming no promoter or promoter-group shares were encumbered during FY2026.
On jurisdictions — the finding here is an absence, and it is a real finding. The June 2026 filing shows 95 FPIs holding 6.46% in aggregate (Category I: 83 holders, 6.01%; Category II: 12 holders, 0.46%). SEBI requires any shareholder above 1% to be named. None is named — so no single FPI holds more than 1%, averaging about 0.07% each. There is consequently no FPI jurisdiction to disclose, no Mauritius or Cayman or BVI vehicle in the register, and no offshore promoter entity anywhere in the structure. Domestic institutions hold more: 21 mutual fund schemes with 7.55%, 25 AIFs with 2.80%, 2 insurers with 0.07%. Motilal Oswal Mutual Fund crossed 5% across nine schemes on 23 February 2026.
On the group's own entities, five are incorporated outside India — the United States (two), the UAE, Singapore and South Korea — plus a UK entity that ceased on 18 July 2025. Two of these, Zen Technologies Inc. (USA) and Zen Defence Technologies L.L.C. (UAE), are direct subsidiaries and both are disclosed as "yet to commence operations". The rest are step-downs under Applied Research International Pvt Ltd. Consolidated non-current operating assets outside India total ₹2.59 lakh out of ₹27,580.07 lakh — 0.009% of the group. These are sales-market entities, not holding structures.
The shareholder count is the one ownership line that has turned. Public shareholders rose from 108,420 in March 2023 to a peak of 330,378 in December 2025, then fell to 314,092 and 290,771 by June 2026 — down 12% in two quarters, over the same period the share price fell back from its high.
Capital history — every time they raised money
The allotment table from 1993 runs to some thirty entries. The material ones:
- IPO, 30 Sep 2000 — 19,10,000 shares at ₹10, at par.
- Preferential allotment, 17 Mar 2008 — 4,50,000 shares at ₹135, with 4,50,000 warrants converted at the same price on 26 Sep 2008 and 3,50,000 more on 31 Oct 2009.
- Buy-backs — 15,568 shares at ₹107.75 (March 2009) and 11,72,426 shares at ₹90 (23 April 2013). A capital redemption reserve of ₹117.24 lakh still sits on the balance sheet.
- Stock split, record date 24 Nov 2014 — one ₹10 share into ten ₹1 shares, approved by postal ballot on 18 September 2014. Post-split reference price ₹56.45 on BSE.
- Warrant conversions — 23,49,940 shares at ₹76 (3 Sep 2020); 4,69,633 shares at ₹213 (24 May 2023), plus 40,64,627 shares at ₹213 on conversion of compulsorily convertible debentures the same day.
- QIP, 23 Aug 2024 — 62,46,096 shares at ₹1,601 (₹1 face value plus ₹1,600 premium), raising ₹1,000 crore. The ICDR floor price was ₹1,685.18; the issue was priced at a 5% discount to the floor, which Regulation 176(1) permits. The stock opened at ₹1,840 on 26 August 2024 and made a then-record high of ₹1,876.05 that day. The issue was reported as five times subscribed. The individual QIB allottees are not named in the annual report.
There has never been a bonus issue or a rights issue — neither appears anywhere in the complete capital history. Total dilution from the QIP was 8,40,44,260 to 9,02,90,356 shares, +7.43%.
Where the ₹1,000 crore has gone. The Reg 32(7A) utilisation statement as at 31 March 2026 — nineteen months after allotment — reads: working capital ₹410 crore allocated, ₹410 crore used; inorganic growth and strategic initiatives ₹350 crore allocated, ₹171.42 crore used; general corporate purposes ₹219.51 crore allocated, ₹122.34 crore used; issue expenses ₹20.49 crore, fully used. Total utilised ₹724.25 crore, leaving ₹275.75 crore unutilised. The report does not print that residual figure — it is the subtraction. CARO clause x(b) states the unutilised portion is "kept separately in the form of fixed deposits and bank balances"; no note identifies which specific deposit balances hold it, and there is no formal statement of deviation. Holding QIP money in deposits pending deployment is entirely normal, and the acquisitions the money was raised for have in fact been made — six subsidiaries and one associate were added across FY2025 and FY2026.
Who runs it, and the wider web
Ashok Atluri is Chairman and Managing Director; Kishore Dutt Atluri is President and Joint Managing Director. No separate CEO is designated — the CMD signs the CEO/CFO certification. The board shrank from nine directors to six over FY2026: Ravi Kumar Midathala's whole-time directorship ended 28 June 2025 on completion of tenure, independent director Ajay Kumar Singh completed his second term on 1 November 2025, and Ravindra Kumar Tyagi ceased on 1 April 2025. Durga Prasad Kode joined in March 2025; Jasthi Krishna Kishore and Uma Priyadarshini Kollareddy were appointed as additional directors after the year end. The FY2026 board was three executive and three independent, two of six female.
Senior finance turnover is worth listing plainly. Company Secretary Raghavendra Prasad Movva, appointed May 2023, resigned on 24 September 2024 citing personal reasons; Sourav Dhar succeeded him on 2 November 2024. Chief Financial Officer Afzal Harunbhai Malkani resigned on 2 November 2025, effective 30 November, stating he was leaving "to pursue better opportunity and career prospect"; Hari Haran Chalat was appointed CFO on 31 January 2026, leaving a two-month gap. The Chief HR Officer resigned on 4 July 2025. Each departure was disclosed to the exchanges with a stated reason, and none of the letters cites any disagreement with the company.
Auditor: Ramasamy Koteswara Rao and Co LLP, Hyderabad (FRN 010396S/S200084), signing partner Murali Krishna Reddy Telluri. Unqualified opinion on both standalone and consolidated accounts for FY2026 and FY2025. No emphasis of matter. No going-concern paragraph. CARO clause xviii states expressly: "There has been no resignation of the statutory auditors of the Company during the year." The firm has audited Zen since 28 June 2019, when Sekhar & Co. resigned citing partner departures and an inability to meet listed-company timelines; it was reappointed for a second five-year term on 14 September 2024, to 2029. Audit fee for FY2026 was ₹18.70 lakh at the standalone level (₹15.00 lakh audit, ₹3.70 lakh certification) against ₹48.65 lakh in FY2025, when certification fees were ₹32.65 lakh — the QIP year. Group-wide payments to auditors were ₹56.18 lakh.
Related parties. The largest is Unistring Tech Solutions Pvt Ltd, a 51% subsidiary. Zen bought ₹75.74 crore of materials from it in FY2026 (FY2025: ₹151.32 crore) plus ₹12.11 crore of capital goods — 17.9% of standalone revenue against 16.3% the year before. The year-end advance to Unistring for material supplies rose from ₹5.16 crore to ₹39.27 crore, a 7.6x increase in a year when purchases from it halved. These transactions eliminate on consolidation, and shareholders approved continuing material RPTs with Unistring at the September 2024 AGM; AOC-2 records them as at arm's length. Commission to the two promoter-directors fell from ₹19.87 crore to ₹10.14 crore as profits fell, while remuneration to three named relatives of KMP rose from ₹0.56 crore to ₹1.35 crore (+142%). Rent of ₹7.76 lakh was paid to Rama Devi Atluri, and CSR of ₹146.39 lakh routed through Veer Sammaan Foundation, of which a KMP is a founder trustee. No loans to or from KMP are disclosed; a loan of ₹8 crore was given to subsidiary Vector Technics.
The regulatory and surveillance record
- SEBI: searches of SEBI order listings and the web index returned no SEBI order, adjudication, settlement or show-cause notice naming Zen Technologies or its promoters. This is an absence in searches, not a certified nil from SEBI's database.
- Exchange surveillance: BSE's scrip page for 533339 currently shows Group A / BSE 500 with a 10% price band and no ASM, GSM, ESM or periodic-call-auction flag displayed. One third-party dashboard carries a stale entry showing BSE Long Term ASM Stage I dated 19 February 2025; the same site's "exited" list, which runs to May 2026, does not contain ZENTEC. We could not reach a primary NSE or BSE surveillance file to settle current status definitively and say so rather than guess.
- Credit rating: CRISIL A/Positive (long term) and CRISIL A1 (short term), reaffirmed 3 August 2026 on bank facilities enhanced from ₹256 crore to ₹386 crore (₹70 crore fund-based, ₹316 crore non-fund-based). CRISIL had upgraded the long-term rating from A−/Stable to A/Positive on 27 January 2025.
- "Issuer Not Cooperating" — historic, and it exists. Infomerics rated Zen IVR BB / IVR A4, both tagged ISSUER NOT COOPERATING, on 7 April 2022, following IVR BB+ (INC) in February 2021. That is a rating agency stating publicly that it was not receiving information. It predates the CRISIL relationship and there is no current INC tag from any agency. It is reported here because it is on the public record.
- NCLT / IBC / tax / ED: nothing found. No insolvency proceeding, no reported income-tax search or Enforcement Directorate action.
- Litigation: the one identified IP matter went Zen's way — on 6 August 2025 the Assistant Controller of Patents revoked Patent No. 429859 (a shooting-range training system held by individuals linked to MAG5 Innovations Pvt Ltd) on Zen's post-grant opposition, for lack of novelty and inventive step. Contingent liabilities at 31 March 2026 are small: consolidated direct tax ₹10.13 crore and central excise ₹8.23 crore. No corporate guarantees are disclosed.
Forensic checks — what the accounts show
| Check | What we found | A benign explanation |
|---|---|---|
| 5-yr cumulative CFO ÷ PAT | 0.51 — CFO ₹360.64 cr vs PAT ₹700.26 cr, FY22–FY26. FY24 and FY25 ratios of 0.10 each; FY26 1.12. | Long-cycle government capital goods: working capital absorbs cash while growing and releases it when volume falls. FY26 bears this out. |
| Cash pile vs interest earned | Cash, bank and deposits ₹1,306.42 cr (avg ₹1,243.79 cr). Interest received ₹71.39 cr = 5.74%; total other income ₹85.42 cr = 6.87%. | Consistent with Indian term-deposit rates. ₹199.51 cr is margin money against bank guarantees, which typically earns less. |
| Implied interest rate on debt | Finance cost ₹10.27 cr ÷ average borrowings ₹28.77 cr = 35.7%. | The denominator is tiny and shrinking. Finance cost here is dominated by bank-guarantee commission on ₹316 cr of non-fund limits, not interest. Net debt is ₹−1,303 cr. |
| Receivable days | 166 → 142 → 153 → 154 → 119 (FY26). Falling, not ballooning. | Government receivables collected as deliveries slowed. This is the healthy direction. |
| Inventory days | ₹188.19 cr = 100 days of revenue, up from 45; on materials consumed, 415 days vs 118. | Order book of ₹1,336 cr for FY27 delivery; goods built ahead of recognition. The mirror image of the receivables fall. |
| Related-party share | Purchases from Unistring = 17.9% of standalone revenue. Advance to Unistring ₹5.16 cr → ₹39.27 cr. | Unistring is a consolidated 51% subsidiary; the transactions eliminate on consolidation and were approved by shareholders as material RPTs. |
| Promoter holding / pledge | 60.19% → 48.51%. 30 lakh shares sold by the two promoter-directors in Dec 2024. Pledge nil. | Sales predate the QIP-funded expansion and were disclosed under SAST. The last 0.54 pp was a reclassification, not a sale. |
| Auditor | Unchanged since 2019, reappointed to 2029. Unqualified, no EoM, no going concern in FY25 and FY26. | — |
| Subsidiaries and jurisdictions | 9 subsidiaries + 2 associates + 1 JV. Five entities outside India: USA ×2, UAE, Singapore, South Korea. No Mauritius, Cayman, BVI or Cyprus entity. Overseas non-current assets 0.009% of group. | Sales-market entities in the countries Zen sells to; two are dormant. |
| Dilution | +7.43% via the QIP at ₹1,601 — a 5% discount to the ₹1,685.18 ICDR floor, permitted by Reg 176(1). No preferential allotment to a related party in the last five years. | The floor-price discount is a standard, regulated feature of QIPs and was open to all QIBs. |
| Other income as % of PBT | 9.1% → 14.4% → 28.8% (FY26); 35.6% in Q1 FY27. | Arithmetic: the numerator rose with the QIP deposits while the denominator fell with revenue. It is real interest on real cash, not an accrual. |
| Capex vs depreciation, asset turnover | Capex ₹58.81 cr = 2.41x depreciation. Asset turnover 0.33x vs 0.70x in FY25. | Building the Adibatla plant into a ₹1,336 cr order book. Turnover collapsed because ₹1,306 cr of QIP cash sits in the denominator. |
| Internal consistency of the report | Applied Research International Pvt Ltd holding printed as 100% in the Board's Report and AOC-1 but 76% in the BRSR; Zen Defence Technologies L.L.C. as 99% in one place, 100% in AOC-1. FY25 order book shown as ₹1,401.97 cr in the KPI chart but ₹691.94 cr in the audited Note 41(D) performance-obligation disclosure. | Different bases and, plausibly, typesetting. The report does not reconcile any of the three, and we do not attempt to. |
What we could not verify
- Current ASM/GSM status. BSE's scrip page shows no flag; one third-party dashboard shows a stale February 2025 entry. We could not open a primary exchange surveillance file.
- The identity of the three customers who together are 74.41% of standalone revenue, and any explicit percentage of revenue from the Government of India.
- The names of the QIB allottees in the August 2024 QIP.
- Which specific deposits hold the ₹275.75 crore of unutilised QIP proceeds.
- Individual promoter names and holdings in the June 2026 filing — the filing gives 12 holders and 48.51% in aggregate; the name-level table was not retrievable, and the aggregator name-splits we found still sum to the June 2025 total of 49.05%, so they are stale. The name of the individual reclassified out of the promoter group is also not in the announcement titles.
- Any supplier, or any single-source dependency. None is named in the annual report.
- The Q1 FY27 PAT split — reported as ₹31.85 crore and as ₹34.4–34.5 crore by different outlets; we did not open the exchange filing itself.
- The 31 March 2021 closing price, so the five-year price return is measured from the 27 August 2021 close.
What would change the picture
- The September 2026 quarter. Management said H2 FY26 orders convert to revenue in Q2–Q3 FY27 and guided to roughly ₹1,000 crore of the ₹1,336 crore order book being recognised in FY27. Either the revenue appears or the explanation changes.
- The inventory line. ₹188 crore of stock is the claim that goods are built and awaiting delivery. If inventory keeps rising without revenue following, that claim weakens.
- Overseas revenue. ₹363 crore to ₹79 crore in one year; whether FY27 shows any recovery is the single biggest swing factor.
- The next Reg 32(7A) statement — whether the remaining ₹275.75 crore is deployed, and into what.
- The next shareholding pattern — whether the public shareholder count keeps falling from 290,771, and whether promoters hold at 48.51%.
- The FY2027 auditor's report — whether the revenue and warranty-provision Key Audit Matters persist, and whether an emphasis of matter ever appears.
- The Unistring advance — ₹39.27 crore outstanding against halved purchases; whether it unwinds.
- CRISIL's next review — the outlook is Positive on a year in which revenue fell 29%.
Sources
- Zen Technologies Limited, 33rd Annual Report FY2025-26 — zentechnologies.com (auditor's reports, consolidated P&L, balance sheet and cash flow, Notes 25–52, AOC-1, AOC-2, Corporate Governance Report incl. Reg 32(7A) utilisation table, BRSR)
- Zen Technologies Limited, 32nd Annual Report FY2024-25 — zentechnologies.com
- QIP Preliminary Placement Document, August 2024 (capital history, corporate history, listing dates) — bseindia.com
- BSE Information Memorandum, 2011 (incorporation and early allotments) — bseindia.com
- Statement of shareholding of promoter and public as on 30 June 2026 — zentechnologies.com; index at share-holding-pattern
- Intimation of credit rating, 3 August 2026 (CRISIL A/Positive, A1, ₹386 cr facilities) — zentechnologies.com
- Infomerics rating press releases, incl. IVR BB/IVR A4 (Issuer Not Cooperating), 7 April 2022 — infomerics.com
- Resignation of Chief Financial Officer, 2 November 2025 — zentechnologies.com
- Resignation of Company Secretary, 24 September 2024 — zentechnologies.com
- Intimation of change in statutory auditors, 28 June 2019 — zentechnologies.com
- Receipt of Ministry of Defence order, ₹177.5 crore, 22 July 2026 — zentechnologies.com
- Receipt of Ministry of Defence order, ₹295 crore, 10 August 2026 — zentechnologies.com
- Corporate announcements index (reclassification request 24 Jul 2025; exchange no-objection 27 Sep 2025; board change 4 Aug 2026) — zentechnologies.com
- BSE scrip page, Zen Technologies (533339) — group, price band, surveillance flags — bseindia.com
- Screener.in consolidated financial and shareholding series (FY2021–FY2024 and quarterly) — screener.in
- Q1 FY27 results coverage and investor presentation — Investing.com, EquityBulls, Free Press Journal
- Q1 FY27 earnings call transcript, 27 July 2026 — Investing.com
- QIP completion and pricing coverage, 26 August 2024 — Business Today
- Five-year price reference, 27 August 2021 close ₹100.35 — Business Today; current price and 52-week range — Tickertape
- Promoter encumbrance declaration, SAST Reg 31(4), 3 June 2026 — ScanX; Motilal Oswal MF crossing 5%, 23 February 2026 — ScanX
- Patent No. 429859 revocation, 6 August 2025 — Bharat Shakti
- Peer valuation comparators, 27–28 August 2026 — Bharat Electronics, Data Patterns (India)
FAQ
Why did Zen Technologies' revenue fall 29% in FY2026? The audited geography note answers this precisely: domestic revenue was essentially unchanged at ₹609.03 crore versus ₹610.12 crore, while overseas revenue fell from ₹363.52 crore to ₹78.66 crore. That single line accounts for 99.6% of the ₹285.95 crore decline. Management attributes the shortfall to the timing of order execution rather than demand.
Does Zen Technologies have any offshore holding structure? No. All 12 promoter-group holders in the June 2026 filing are Indian individuals or HUFs, and there is no holding company above the listed entity. The group has five entities incorporated outside India — two in the USA, one each in the UAE, Singapore and South Korea — which are sales-market subsidiaries and a JV, two of them dormant. There is no Mauritius, Cayman, BVI or Cyprus entity anywhere in the structure, and consolidated non-current assets outside India are 0.009% of the group total.
How much promoter share is pledged? None. Ashok Atluri filed a SAST Regulation 31(4) declaration on 3 June 2026 confirming no promoter or promoter-group shares were encumbered during FY2026. Promoter holding is 48.51%, down from 60.19% in March 2022 — 30 lakh shares were sold by the two promoter-directors in December 2024, and the most recent 0.54-point step was a promoter-to-public reclassification, not a sale.
What happened to the ₹1,000 crore QIP money? Of the ₹1,000 crore raised at ₹1,601 per share on 23 August 2024, ₹724.25 crore had been utilised at 31 March 2026: ₹410 crore on working capital (fully spent), ₹171.42 crore of a ₹350 crore allocation on acquisitions, and ₹122.34 crore of ₹219.51 crore on general corporate purposes. That leaves ₹275.75 crore unutilised, which the auditor's CARO clause x(b) says is held in fixed deposits and bank balances. Six subsidiaries and one associate were added over FY2025 and FY2026.
Has Zen Technologies had a qualified audit opinion or an auditor resignation? Not in the last five years. FY2025 and FY2026 opinions are unqualified on both standalone and consolidated accounts, with no emphasis of matter and no going-concern paragraph, and CARO clause xviii states there was no resignation of the statutory auditors during the year. The last auditor change was June 2019. Separately, a Company Secretary resigned in September 2024 and the CFO in November 2025, both with stated reasons disclosed to the exchanges.
Is the stock under any exchange surveillance measure? BSE's scrip page for 533339 shows Group A / BSE 500 with a normal 10% price band and no ASM, GSM, ESM or periodic-call-auction flag displayed. One third-party dashboard carries a stale BSE Long Term ASM Stage I entry dated 19 February 2025; the same site's exited-stocks list, current to May 2026, does not contain the scrip. We could not open a primary exchange surveillance file, so we report the evidence rather than a conclusion.
Independent research for education and discussion only. Not investment advice, not a recommendation, and not a rating — we issue no buy/sell calls and no target prices. Every figure is sourced from the primary documents linked above; figures can be restated and we can make mistakes, so always verify against the original. Nothing here alleges wrongdoing by any company or individual: where a fact raises a question we state the fact, cite it, and give the benign explanation alongside. Offshore holding structures, pledging and preferential allotments are all legal and common — they are disclosed here as facts, not as accusations.
This article is for educational and informational purposes only. It is not financial advice, investment recommendation, or a solicitation to buy or sell securities. Investing involves significant risks. I am not a SEBI-registered investment advisor. Readers should consult their own financial advisor and conduct their own research before making any investment decisions.
Comments
Join the conversation
Sign in to join the conversation.
Follow replies, add your view, and take part in the discussion.
Sign in to commentLoading comments...