

MTAR Technologies (MTARTECH): the full file — one customer, clean cash, no offshore, and a promoter sell-down
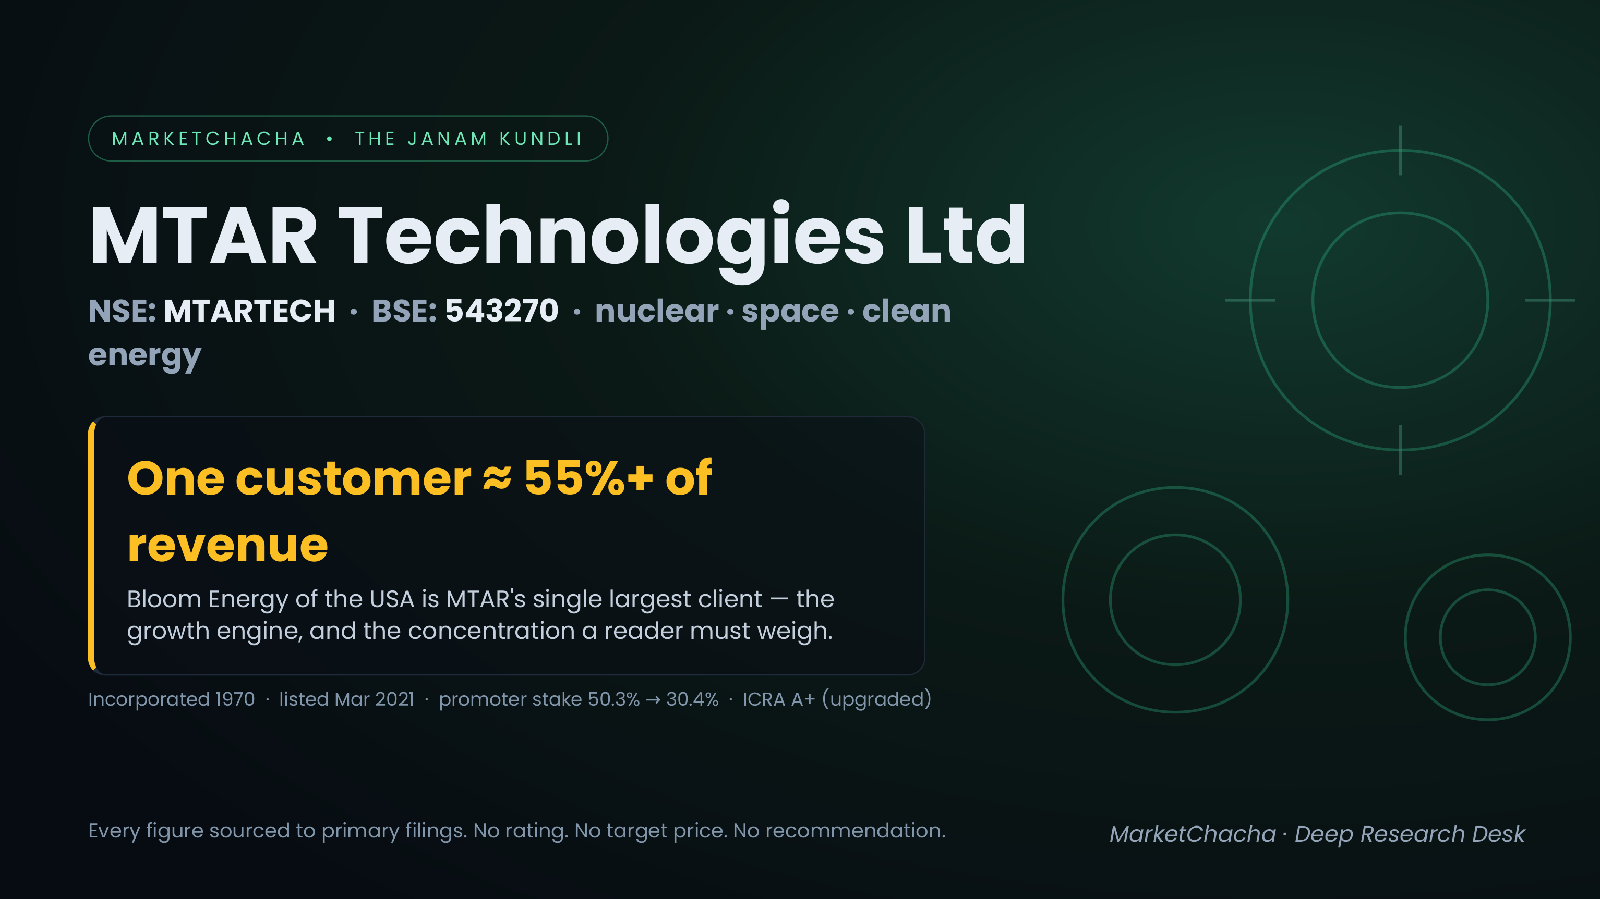
MTAR Technologies makes some of the hardest-to-machine metal in India — fuel-cell "hot boxes" for Bloom Energy of the USA, close-tolerance components for the country's nuclear reactors, and precision assemblies for ISRO and defence. It earns money by manufacturing critical, differentiated engineered products for four end-markets: clean energy, civil nuclear power, aerospace & defence, and specialised products. What the record shows is a company with genuinely strong cash generation and a clean, entirely domestic corporate structure, whose two central questions are not about accounting integrity at all — they are customer concentration and valuation.
This is a forensic life story — a janam kundli — built entirely from primary filings. We issue no rating, no target and no opinion on the shares. We state what the documents say and, where a number raises a question, we give the benign reading alongside.
Origin — the company's birth certificate
MTAR was incorporated in 1970 in Hyderabad by promoters P. Ravindra Reddy, K. Satyanarayana Reddy and P. Jayaprakash Reddy, founded to serve the technical and engineering needs of the Indian government in the post-embargo era — precision import-substitution for the nuclear, space and defence programmes that could not buy such parts abroad. For five decades it was a specialist supplier; it listed on the exchanges in March 2021. The IPO (price band ₹574–575, about ₹596 crore) was a small fresh issue of about ₹123.5 crore plus a large offer for sale of about ₹473 crore — meaning most of the IPO money went to selling shareholders, not the company. The pre-IPO register included private-equity backing associated with Mathew Cyriac, the former India private-equity co-head of Blackstone. That OFS-heavy listing is the start of the ownership story below: it is why the "public/investor" float has churned so heavily since.
The business — what they actually make
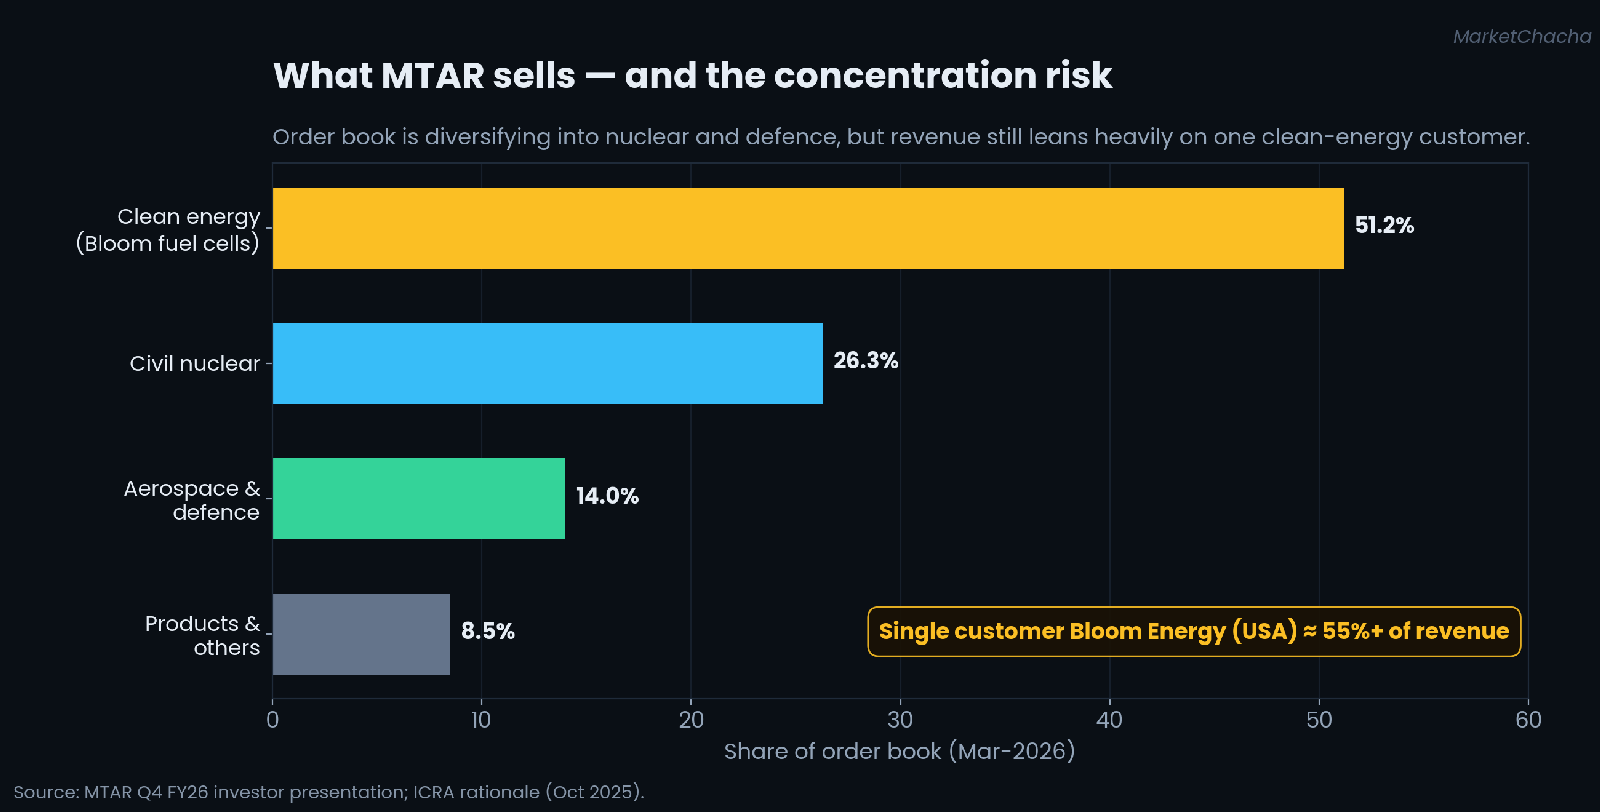
Four segments. Clean energy: fuel-cell hot boxes and, increasingly, electrolysers — this is the Bloom Energy business and the growth engine. Civil nuclear power: reactor components for India's nuclear programme, where MTAR is one of a very small number of qualified suppliers. Aerospace & defence: assemblies for ISRO, DRDO and defence programmes. Products & others: ball screws, roller screws, water-lubricated bearings and electro-mechanical actuators. MTAR describes itself as one of the top-3 precision-engineering suppliers to India's civil-nuclear, space and defence sectors. As of March 2026 the order book was about ₹2,582 crore (record FY26 inflows of about ₹2,453 crore), split roughly 51% clean energy, 26% civil nuclear, 14% aerospace & defence and the balance products.
Who actually buys from them
This is the defining fact of the whole file. MTAR's single largest customer is Bloom Energy of the USA, for which it builds fuel-cell hot boxes; Bloom is reported to be more than 55% of revenue (clean-energy fuel cells were about 62% of FY25 revenue, roughly ₹417 crore). No amount of order-book diversification changes the near-term reality that a majority of sales rest on one overseas client. The risk is not hypothetical: in June 2026 MTAR's shares fell about 11% on news of project uncertainty at a Bloom end-customer, after which the company issued a clarification that there had been no order cancellation and the order book remained healthy. A reader should track the Bloom relationship — order flow, hot-box volumes, any customer commentary — as the single most important variable in the story. The order book's growing nuclear (26%) and defence (14%) shares are the disclosed path to reducing that dependence over time.
Where it is actually made — plants & structure
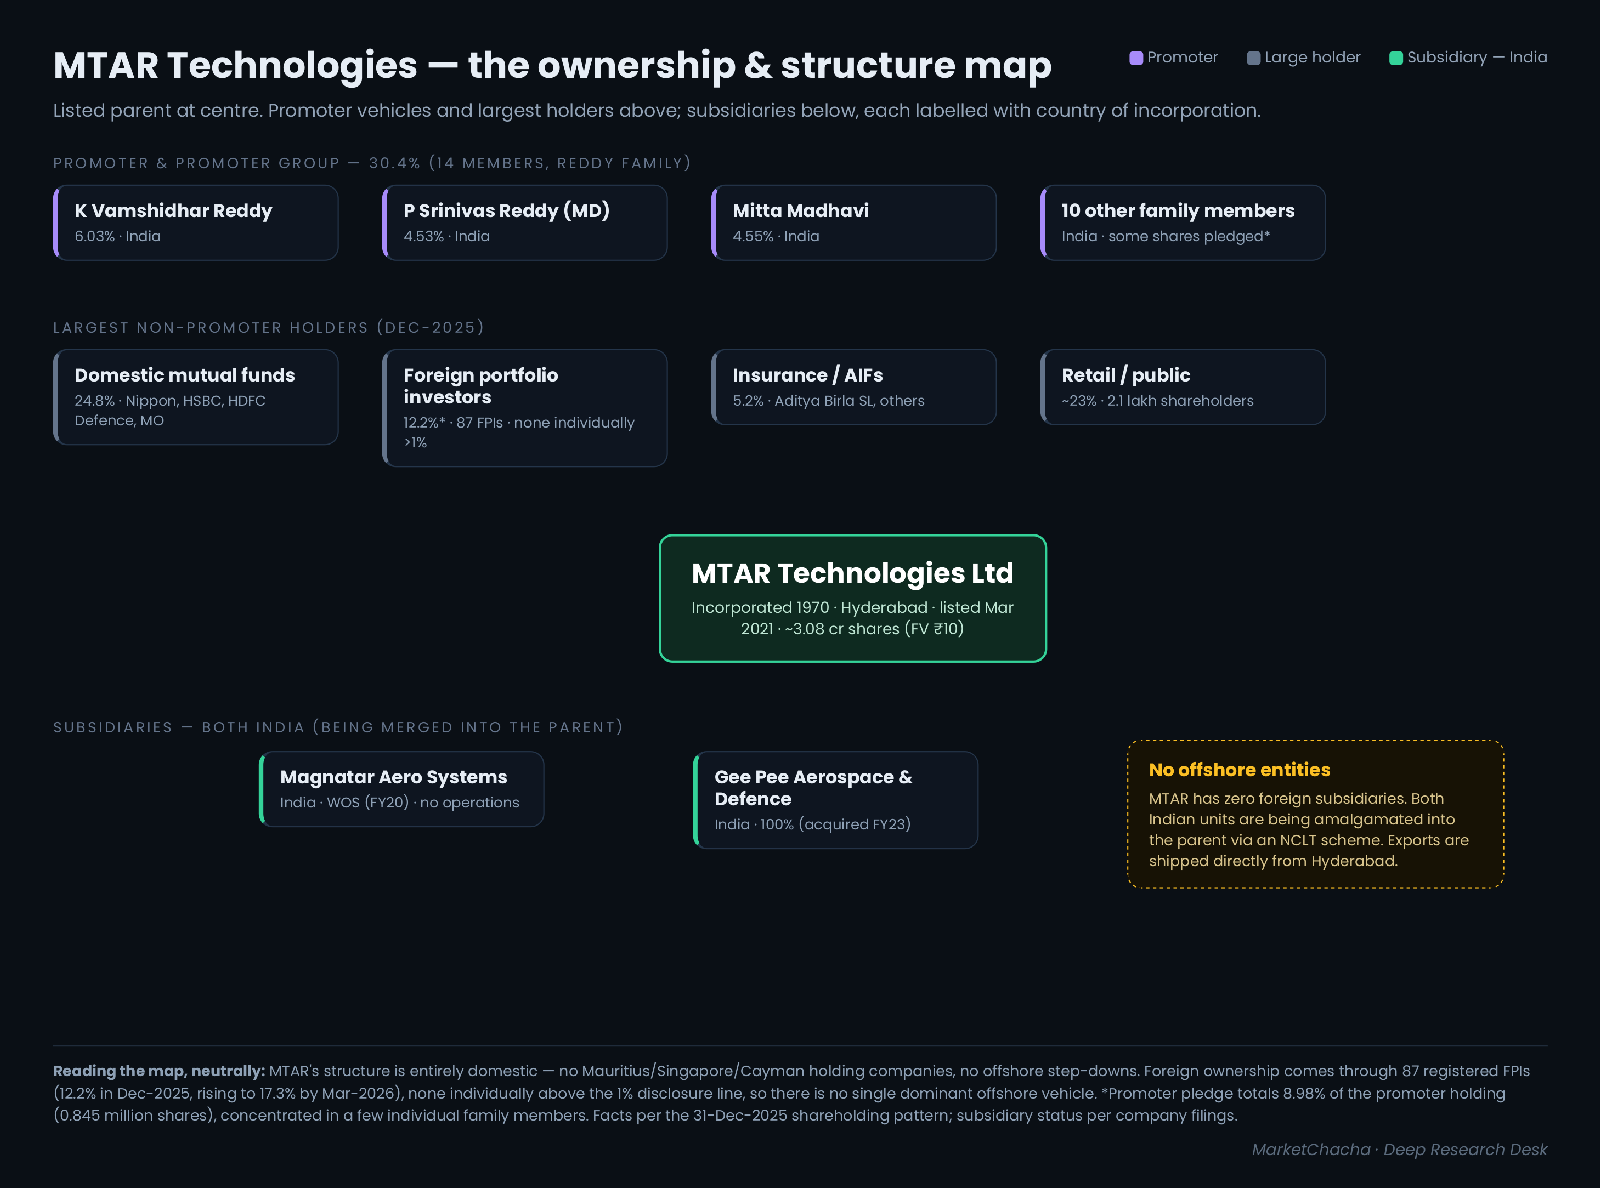
MTAR operates seven manufacturing units in Hyderabad within a roughly 4-km radius, plus a dedicated export facility. Its corporate structure is unusually simple and — a genuine, checkable finding — entirely domestic. It has two subsidiaries, both Indian: Magnatar Aero Systems Private Limited (a wholly-owned company incorporated in FY2020 that has had no operations) and Gee Pee Aerospace & Defence Private Limited (100% acquired in FY2022-23). Both are being amalgamated into the parent via a scheme before the National Company Law Tribunal. There are no offshore subsidiaries — no Mauritius, Singapore, Cayman or Dutch holding companies, no step-downs. Exports are shipped directly from Hyderabad. In a desk that spends most of its time untangling offshore chains, the absence of one is worth stating plainly.
Five years of numbers
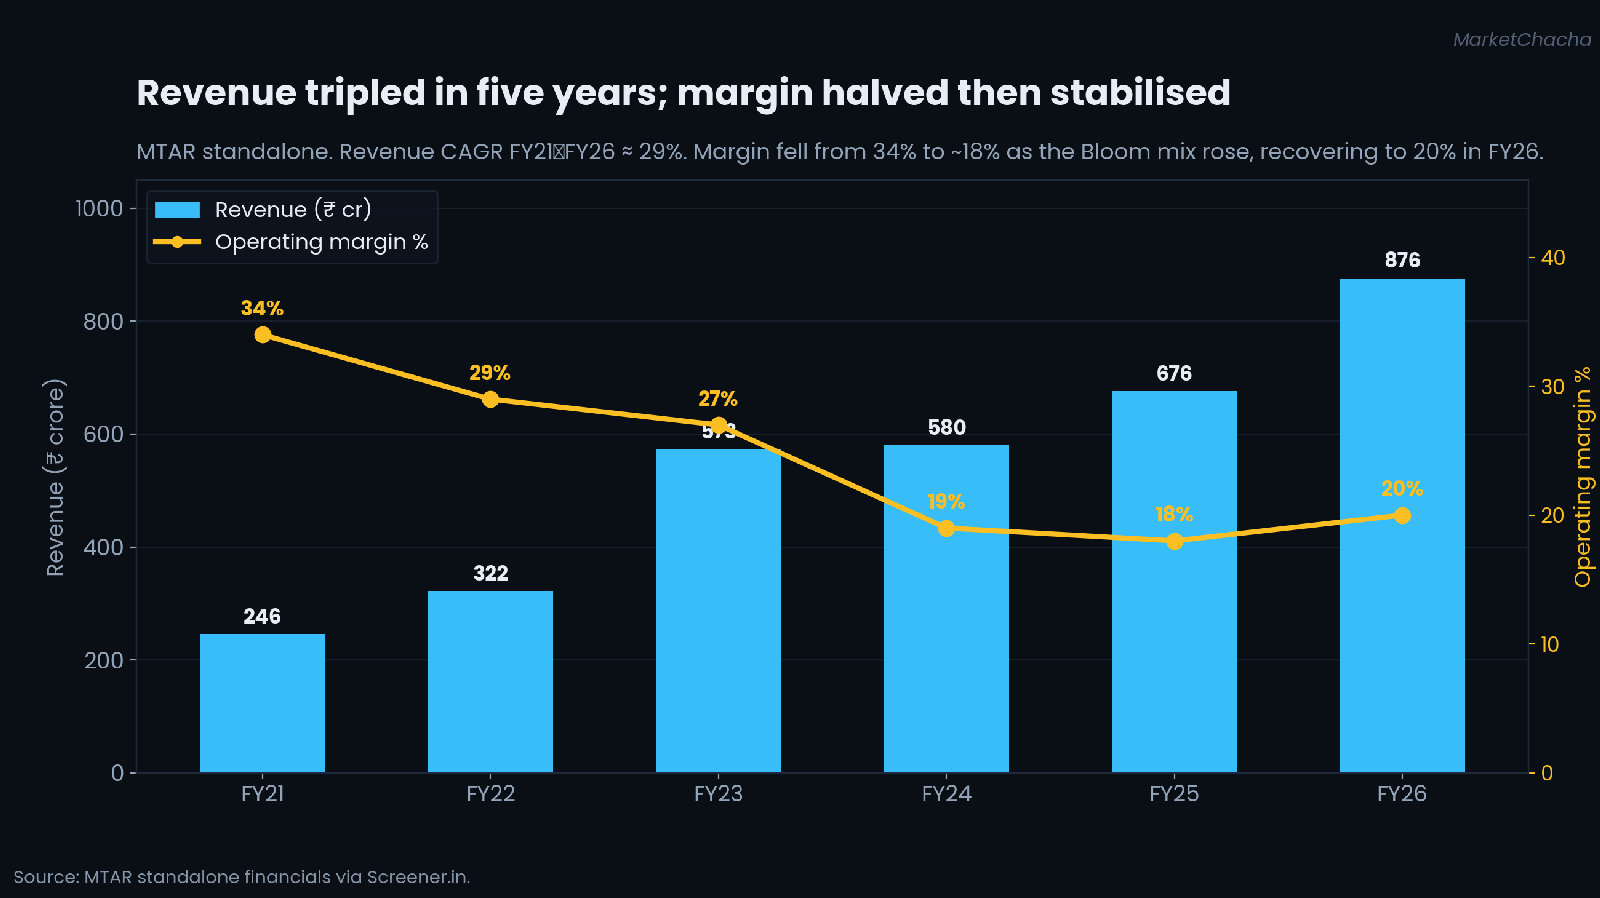
Revenue roughly tripled from ₹246 crore (FY21) to ₹876 crore (FY26), a ~29% CAGR — but with a lumpy middle: an FY23 spike, an FY24–FY25 plateau as Bloom Energy destocked, then a sharp FY26 recovery. Operating margin fell from ~34% to ~18% as the lower-margin Bloom mix grew, recovering to ~20% in FY26. Consolidated FY26 is materially identical to standalone (total income about ₹899 crore, PAT about ₹94 crore). The standalone series (₹ crore):
| FY (Mar) | Revenue | EBITDA | OPM | PAT | EPS (₹) | CFO |
|---|---|---|---|---|---|---|
| FY2021 | 246 | 83 | 34% | 46 | 14.98 | 9 |
| FY2022 | 322 | 94 | 29% | 61 | 19.79 | -30 |
| FY2023 | 573 | 154 | 27% | 104 | 33.84 | 9 |
| FY2024 | 580 | 112 | 19% | 56 | 18.29 | 55 |
| FY2025 | 676 | 121 | 18% | 54 | 17.51 | 102 |
| FY2026 | 876 | 171 | 20% | 95 | 30.99 | 192 |
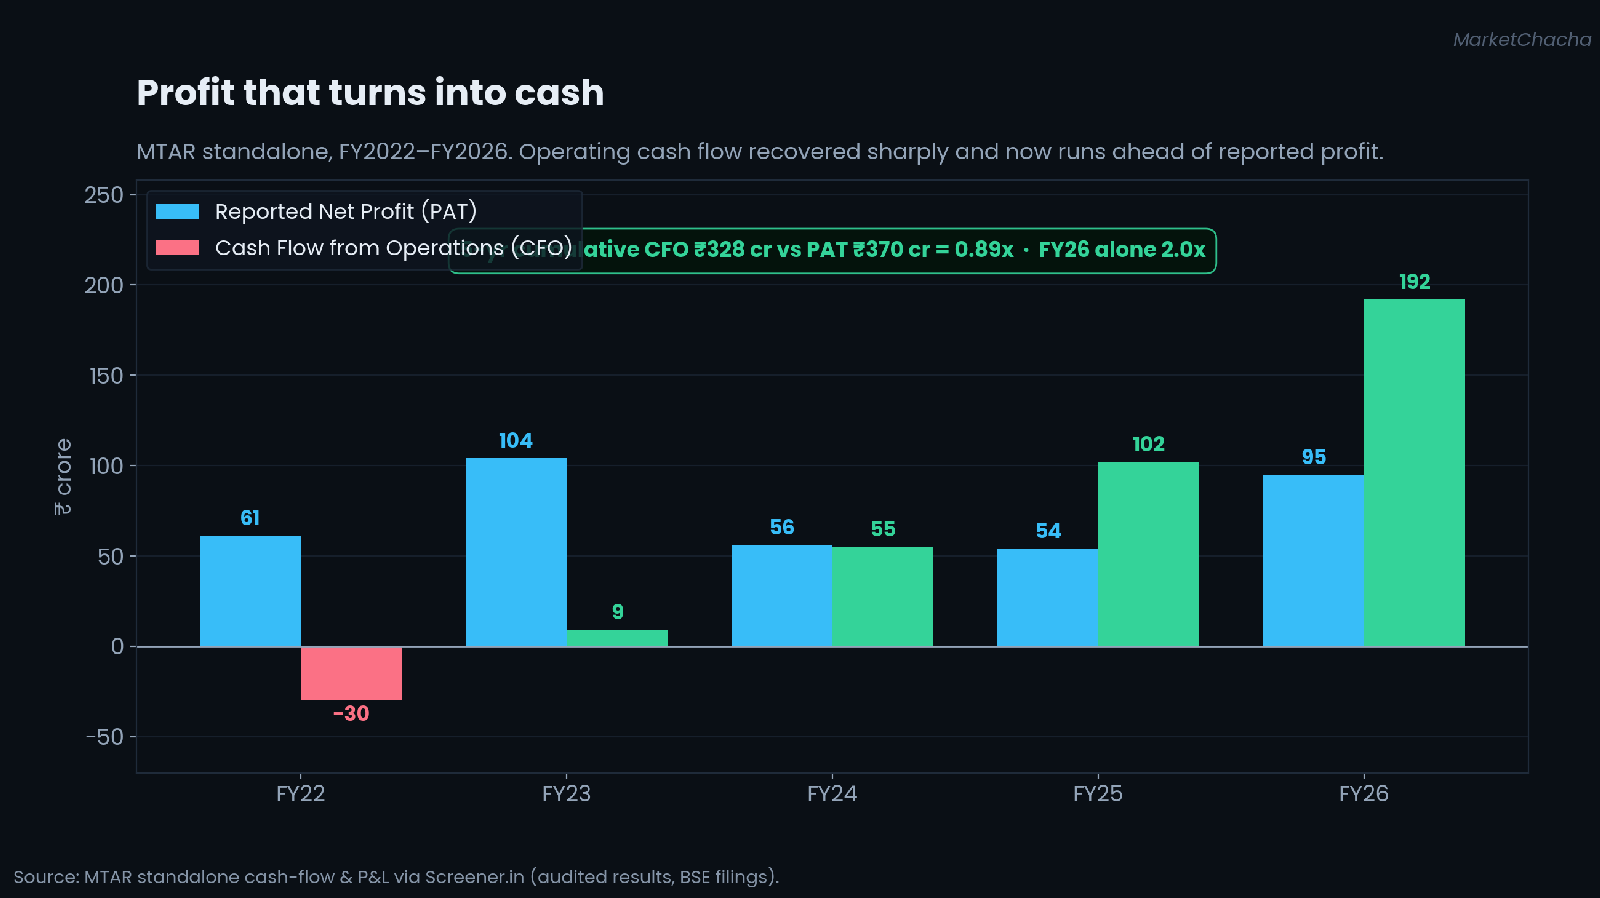
Here is the reassuring part — and the mirror image of many companies this desk covers. Over FY2022–FY2026, MTAR reported cumulative profit of about ₹370 crore and generated cumulative operating cash flow of about ₹328 crore — a conversion of about 0.89x, and in FY26 alone operating cash flow of ₹192 crore ran at 2.0x reported profit. Profit is becoming cash.
The income statement, decoded (FY2026 vs FY2025)
Folding in a full statement view, with rupee and percentage variance on every line (₹ crore):
| Line | FY2026 | FY2025 | Var (₹) | Var (%) |
|---|---|---|---|---|
| Revenue from operations | 876 | 676 | +200 | +29.6% |
| Operating expenses | 705 | 555 | +150 | +27.0% |
| Operating profit (EBITDA) | 171 | 121 | +50 | +41.3% |
| Other income | 20 | 6 | +14 | +233% |
| Finance costs | 29 | 22 | +7 | +31.8% |
| Depreciation | 34 | 32 | +2 | +6.2% |
| Profit before tax | 127 | 72 | +55 | +76.4% |
| Tax | 32 | 18 | +14 | +77.8% |
| Net profit (PAT) | 95 | 54 | +41 | +75.9% |
| EPS (₹) | 30.99 | 17.51 | +13.48 | +77.0% |
The profit jump is real but two things deserve a footnote. EBITDA margin improved ~160 bps to 19.5% on operating leverage — good. But other income rose to ₹20 crore (about 16% of pre-tax profit, up from ~8%), reflecting treasury returns on a newly-built investment book rather than the core business — a lower-quality contributor. And finance costs rose ~32% as borrowings doubled (see the balance sheet).
Balance sheet & cash flow (FY2026 vs FY2025)
| ₹ crore | FY2026 | FY2025 | Var (₹) |
|---|---|---|---|
| Net worth | 826 | 731 | +95 |
| Borrowings | 377 | 177 | +200 |
| Other liabilities (incl. customer advances) | 542 | 220 | +322 |
| Investments (treasury) | 222 | 7 | +215 |
| Total assets | 1,744 | 1,128 | +616 |
| Cash from operations | 192 | 102 | +90 |
| Cash from investing | -347 | -104 | -243 |
| Cash from financing | 155 | -35 | +190 |
| Free cash flow | 65 | 2 | +63 |
The balance sheet expanded 55% in one year with no equity issuance (share count unchanged at ~3.08 crore shares of ₹10 face value). It was funded by borrowings (doubling to ₹377 crore) and a ₹322 crore rise in other liabilities, largely customer advances against the bigger order book. Curiously, the company simultaneously parked ₹222 crore in financial investments while carrying more debt — a capital-allocation choice worth watching. Net debt was about ₹348 crore; net debt to equity ~0.46x, still conservative for a capital-goods maker.
The latest quarter, decoded
Q4 FY26 (March 2026) was the strongest quarter on record: revenue about ₹306 crore (up ~67% year-on-year, ~10% sequentially) and PAT about ₹44 crore (more than three times the year-ago quarter; EPS ₹14.42). Two cautions. First, sequential operating margin actually fell ~270 bps to about 20.3% even as revenue rose — a mix or cost signal. Second, about ₹17 crore of other income (nearly a third of pre-tax profit) flattered the quarter versus roughly nil a year earlier; strip it out and the operating beat is smaller than the headline PAT suggests. The direction is strongly positive; the quality is worth reading closely.
Who owns it — and where those owners are registered
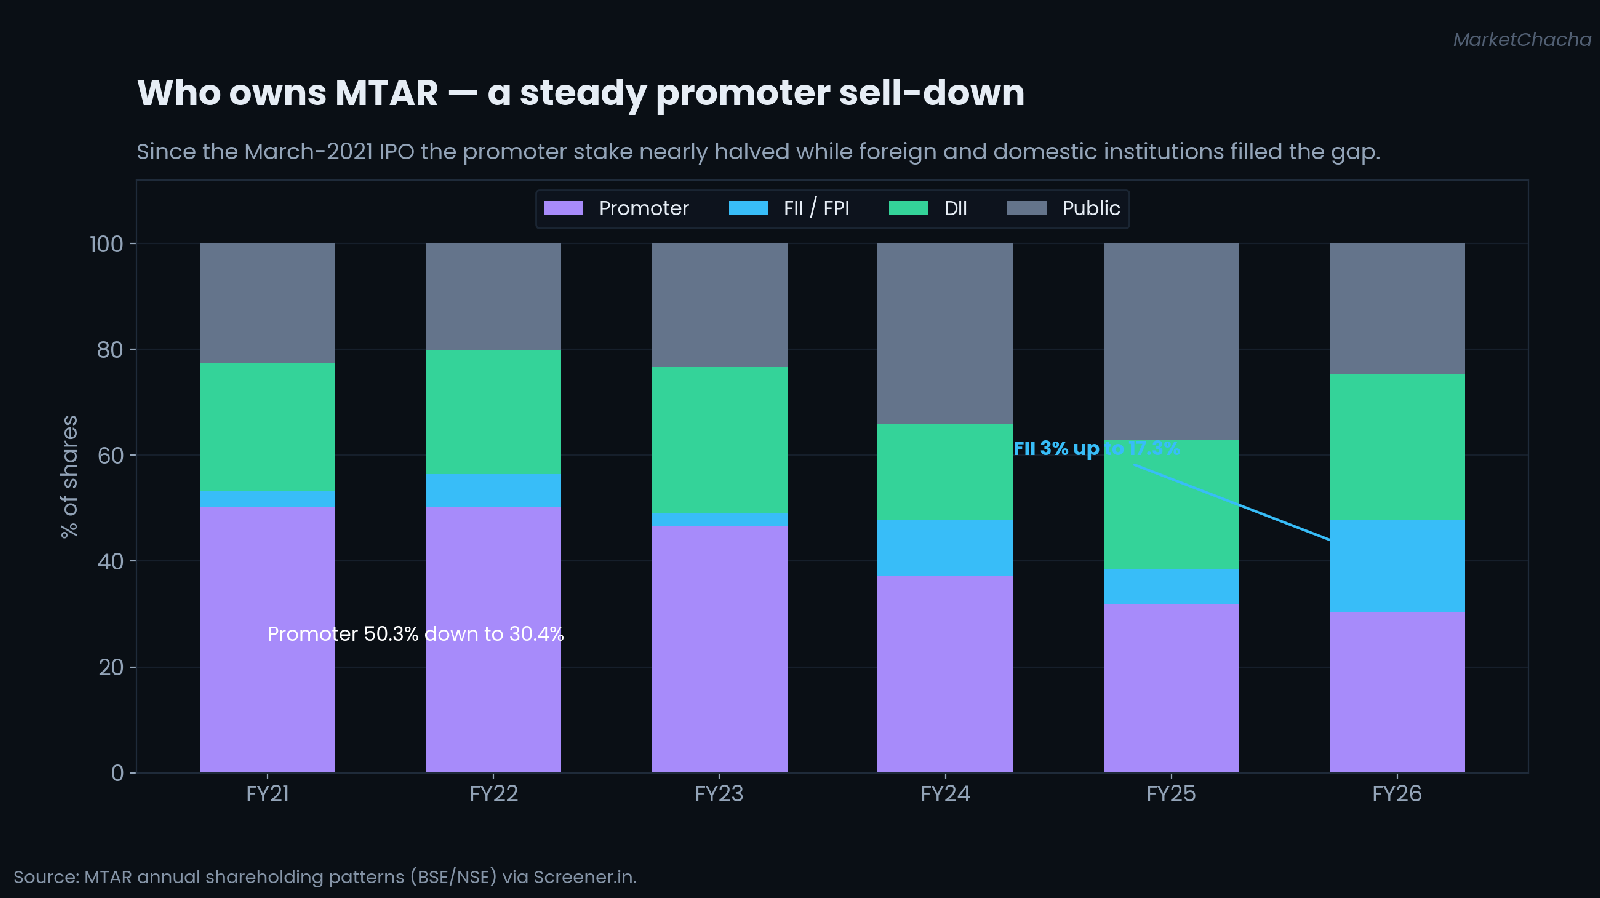
Three facts, all from the shareholding patterns. First, a steady promoter sell-down: the promoter and promoter-group holding has fallen from 50.25% at the March-2021 IPO to 30.44% by March 2026 — a ~20-point reduction across 14 family members, the largest being K. Vamshidhar Reddy (6.03%), Mitta Madhavi (4.55%) and MD P. Srinivas Reddy (4.53%). Individual promoter-group members continued trimming into 2025–26 (open-market disclosures by P. Kalpana Reddy and Akepati Pranay Reddy, among others). Second, a rising institutional base: foreign portfolio investors climbed from 6.74% (Mar 2025) to 17.31% (Mar 2026), and domestic institutions hold about 27–30%, dominated by small-cap and defence mutual funds (Nippon, HSBC, HDFC Defence, Motilal Oswal, Bajaj Finserv). Retail owns roughly a quarter across about 2.1 lakh holders.
On the jurisdiction question the reader specifically cares about: MTAR's foreign ownership is broad and diffuse, not concentrated in one offshore vehicle. As of the 31 December 2025 shareholding pattern, foreign ownership was held through 87 registered FPIs (73 Category-I plus 14 Category-II), and not a single FPI held more than 1% — none crossed the individual-disclosure threshold. There is no dominant Mauritius/Cayman entity on the register, and — as the structure map shows — no offshore subsidiary either. One factual flag on the promoter side: a small amount of promoter pledging exists, totalling about 8.98% of the promoter holding (roughly 0.845 million shares), concentrated in a few individual family members rather than the group as a whole. Pledging is legal and common; it becomes material only if a price fall forces lender selling, and here the amount is small.
Capital history — every time they raised money
MTAR's capital history is short and clean. It listed in March 2021 via a fresh issue (~₹123.5 crore) plus a promoter/investor offer for sale (~₹473 crore). Since listing it has done no QIP, no rights issue, no bonus, no warrants and no convertible securities — the 31 December 2025 filing explicitly records none outstanding, and the share count has been flat at ~3.08 crore shares. FY26's ₹616 crore balance-sheet expansion was funded entirely by debt and customer advances, not equity — so existing shareholders were not diluted. That absence of serial equity issuance is a genuine contrast with many high-growth mid-caps.
Who runs it, and the wider web
The managing director is Parvat Srinivas Reddy, with the company about 30 years and in the top role about a decade. The board is chaired by independent director B.V.R. Subbu, with executive directors including M. Anushman Reddy and A. Praveen Kumar Reddy, a non-executive director (Rohith Loka Reddy), and independent directors Dr V.G. Sekaran, U.C. Muktibodh, A. Krishna Kumar and Ameeta Chatterjee. The statutory auditor is S.R. Batliboi & Associates LLP — a member firm of the EY network — and the FY26 audit opinion was clean, with a one-time labour-related charge noted. A large-network auditor and a clean opinion are governance positives; we state them as facts.
The regulatory and surveillance record
MTAR's record is, on the documents we found, clean. We found no SEBI orders, settlements or show-cause notices naming the company or its directors. On credit, ICRA reaffirmed the long-term rating at [ICRA] A (Stable) with A1 short-term on 13 October 2025 and subsequently upgraded the long-term rating to [ICRA] A+ (Stable), citing rising scale, a strong order book and expected sustainable growth — a rating trajectory that is improving, not deteriorating (the opposite of a downgrade). Rated facilities include a ₹280 crore cash-credit line, a ₹108 crore term loan and ₹200 crore of non-fund-based limits. Because the stock trades in the equity-derivatives (F&O) segment, it sits outside the scope of the exchanges' GSM and long-term ASM surveillance frameworks, which target smaller, less-liquid securities; we did not find MTAR on any current GSM/ASM list. The only continuing "flags" are ordinary and disclosed: the promoter sell-down and a small, concentrated promoter pledge.
Forensic checks — what the accounts show
| Check | What we found | A neutral reading |
|---|---|---|
| 5-yr cumulative CFO ÷ PAT | ₹328 cr ÷ ₹370 cr = 0.89x; FY26 alone 2.0x | Healthy — profit converts to cash |
| Cash vs treasury | Holds ₹222 cr investments while carrying ₹377 cr debt | Capital-allocation question, not a cash-quality one |
| Implied interest rate | ₹29 cr ÷ avg debt ~₹277 cr ≈ 10.5% | In line with mid-corporate rates |
| Receivable days | 92 → 113 → 140 (FY24→FY26) | Rising — watch collections |
| Inventory / cash-conversion cycle | Inventory ~397 days; CCC ~419 days | Structurally long; working-capital heavy |
| Other income as % of PBT | 8% → 8% → 16% (FY24→FY26) | Rose in FY26; lower-quality earnings |
| Customer concentration | Bloom Energy > 55% of revenue | The single biggest risk in the file |
| Subsidiaries & jurisdictions | 2 Indian subsidiaries, both merging in; zero offshore | Clean, simple, domestic structure |
| Foreign investors | 87 FPIs, none individually >1% | Diffuse; no dominant offshore vehicle |
| Equity dilution | Share count flat; no QIP/warrants since IPO | No dilution |
| Promoter holding / pledge | 50.25% → 30.44%; pledge ~8.98% of promoter holding | Steady sell-down; small, concentrated pledge |
| Auditor | S.R. Batliboi & Associates LLP (EY network); clean opinion | Large-network auditor; no qualification found |
What we could not verify
Several gaps we flag rather than guess. We used standalone Ind-AS figures as rendered on Screener and cross-checked FY26 headline numbers to the company's results release; the consolidated audited statements should be checked directly for the related-party note, contingent liabilities and segment disclosures. We did not obtain a line-item revenue split by customer beyond the reported Bloom concentration range (~55–65%), nor the exact FY26 segment-revenue mix (we used the order-book mix, which differs from revenue). We did not individually confirm the names and home jurisdictions of the 87 FPIs — the shareholding pattern discloses them only in aggregate because none crosses 1%. We did not verify the precise terms or timeline of the NCLT subsidiary-merger scheme. And valuation multiples move daily.
What would change the picture
Concrete, checkable things to watch: Bloom Energy order flow and any customer commentary — the master variable; the receivables line and cash-conversion cycle — whether the working-capital cycle shortens as scale rises; the next few quarters of operating cash flow — whether FY26's 2.0x conversion holds; the segment revenue mix — whether nuclear and defence genuinely dilute the Bloom dependence; the promoter holding and pledge — whether the sell-down stabilises near 30%; and the FY27 guidance of roughly 80% revenue growth, an aggressive target to track against quarterly delivery.
Sources
- MTAR Technologies — standalone financials (P&L, balance sheet, cash flow, ratios, FY2015–FY2026 and quarterly), Screener.in: https://www.screener.in/company/MTARTECH/
- MTAR Technologies 31 December 2025 shareholding pattern (promoter, FPI count, pledge, mutual funds): https://mtar.in/wp-content/uploads/2026/01/Shareholding-Pattern-31.12.2025.pdf
- ICRA rating rationale, 13 October 2025 (and subsequent A+ upgrade): https://www.icra.in/Rating/GetRationalReportFilePdf?id=138317
- MTAR FY26 audited results & Q4 FY26 investor presentation (revenue ₹876 cr; order book ₹2,582 cr), BSE filings, May 2026; coverage via Construction World and ScanX.
- MTAR IPO 2021 (fresh issue + offer for sale; Blackstone/Mathew Cyriac backing) — Business Standard, Business Today, BusinessInsider.
- Subsidiaries (Magnatar Aero, Gee Pee Aerospace) and NCLT amalgamation scheme — company announcements via TipRanks/ScanX.
- Bloom Energy concentration and June 2026 project-uncertainty clarification — Business Standard, TradeBrains.
- Board, management and statutory auditor — MTAR investor site and disclosures.
FAQ
What does MTAR Technologies do? It manufactures high-precision engineered components and assemblies for clean energy (Bloom Energy fuel-cell hot boxes), civil nuclear power, aerospace & defence, and specialised products, from seven units in Hyderabad.
How dependent is it on one customer? Heavily. Bloom Energy of the USA is reported to be more than 55% of revenue. That concentration is the single biggest risk in the file; the growing nuclear and defence order book is the disclosed path to reducing it.
Is the cash flow real? Yes, on the evidence. Over FY22–FY26 cumulative operating cash flow (₹328 cr) was about 0.89x reported profit (₹370 cr), and in FY26 operating cash flow was 2.0x profit — profit is converting to cash.
Does it have offshore subsidiaries or a dominant foreign owner? No. Its two subsidiaries are both Indian and being merged into the parent, with zero offshore entities. Foreign ownership is spread across 87 FPIs, none individually above 1%.
Why has the promoter stake fallen so much? From 50.25% at the March-2021 IPO to 30.44%, through the IPO offer-for-sale and continued open-market selling by family members. A small part of the remaining promoter holding (~9%) is pledged, concentrated in a few individuals.
Is this a buy or a sell? Neither — we do not issue recommendations, ratings or target prices. This is verified, sourced fact so you can decide for yourself.
Independent research for education and discussion only. Not investment advice, not a recommendation, and not a rating — we issue no buy/sell calls and no target prices. Every figure is sourced from the primary documents linked above; figures can be restated and we can make mistakes, so always verify against the original. Nothing here alleges wrongdoing by any company or individual: where a fact raises a question we state the fact, cite it, and give the benign explanation alongside. Offshore holding structures, pledging and preferential allotments are all legal and common — they are disclosed here as facts, not as accusations.
This article is for educational and informational purposes only. It is not financial advice, investment recommendation, or a solicitation to buy or sell securities. Investing involves significant risks. I am not a SEBI-registered investment advisor. Readers should consult their own financial advisor and conduct their own research before making any investment decisions.
Comments
Join the conversation
Sign in to join the conversation.
Follow replies, add your view, and take part in the discussion.
Sign in to commentLoading comments...