

Dixon Technologies (DIXON): the full file — the numbers, the owners, and what the filings actually show
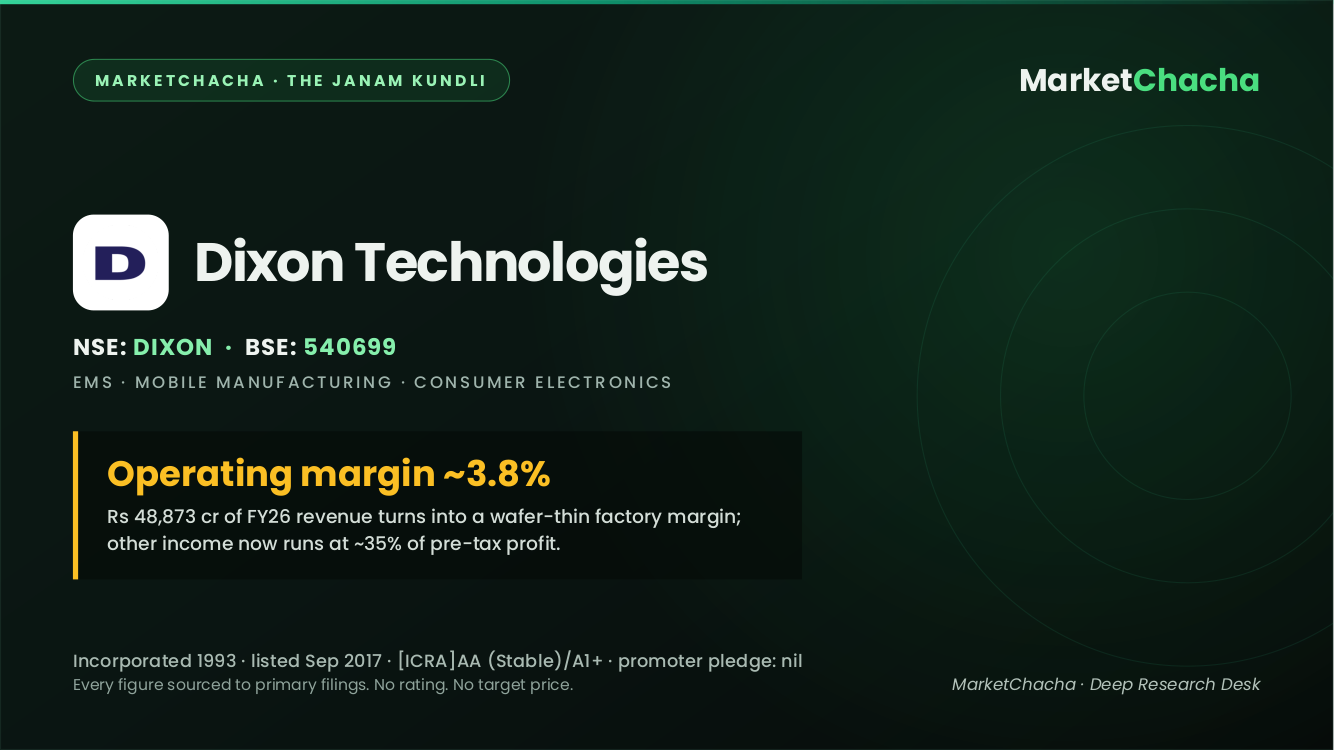
Dixon Technologies (India) Ltd is a contract manufacturer: it builds smartphones, televisions, washing machines, lights and telecom gear for other companies’ brands, and its money comes from the thin margin between what those brands pay and what a bill of materials costs. On roughly ₹48,873 crore of FY26 revenue it earned an operating margin of about 3.8%, and an increasing slice of its pre-tax profit — about 35% in FY26 and over 60% in the June-2026 quarter — came not from making things but from “other income.” That single sentence is the whole file in miniature; the rest of this note documents it, source by source.
Origin — the company’s birth certificate
Dixon was incorporated in 1993 and built its business as an original-design and original-equipment manufacturer (ODM/OEM) for consumer electronics, first assembling colour televisions and later expanding into lighting, home appliances, CCTV, wearables and, decisively, mobile phones. The promoter and executive chairman is Sunil Vachani; Atul B. Lall is vice-chairman and managing director. The company came to the market in September 2017: the IPO was a fresh issue of about ₹60 crore plus an offer-for-sale, priced at ₹1,766 a share, and it was subscribed roughly 118 times. It listed on 18 September 2017 at about ₹2,725, a ~54% premium. In March 2021 the ₹10 face value was sub-divided one-into-five to ₹2; the company has issued no bonus shares. Equity capital has stood at about ₹12 crore since FY17 — a point we return to, because it means the growth below was not funded by repeatedly printing new shares.
The business — what they actually sell
Dixon reports four segments. In FY26 the Mobile & EMS division was about 90% of revenue (85% in FY25); consumer electronics (mainly televisions) about 6%; home appliances about 3%; and lighting about 1%. The company describes itself, in its own investor materials, as the largest Indian ODM/OEM in television manufacturing (with roughly a 37% share of outsourced TV manufacturing) and among the largest in washing machines and consumer lighting. But the centre of gravity has shifted hard toward mobile phones and IT/telecom hardware: that is where the incremental revenue — and the government incentives — have come from.
Who actually buys from them
Dixon’s customers are brands, not consumers. In its disclosures the company lists mobile/EMS clients including Samsung and Motorola, Transsion’s brands (itel, Infinix, Tecno) through its Ismartu subsidiary, and now Vivo through a new joint venture; television/ODM clients including Xiaomi, Samsung, Hisense, Panasonic, Acer, Toshiba, Lloyd and VU; washing-machine clients such as Bosch, Godrej and Voltas-Beko; and lighting customers such as Signify, Wipro, Havells and Bajaj. The mobile division’s revenue is concentrated among a small number of very large global brands — a structural dependency an EMS company cannot escape. The exact single-largest-customer percentage is not something we could pin to a specific figure in the materials reviewed here; that number, if disclosed, sits in the annual report’s customer-concentration and segment notes, and its absence from summary disclosures is itself worth noting.
Where it is actually made — plants & supply chain
Dixon manufactures in India across multiple states, with its long-standing base in Uttar Pradesh (Noida/Greater Noida) and additional facilities in Uttarakhand and southern India, expanded steadily as the mobile and display businesses scaled. The economically important fact about the supply chain is what it is not: in electronics assembly the components — chipsets, displays, camera modules, memory — are largely imported, so a contract assembler’s value-add, and therefore its margin, is inherently thin. Dixon has been moving to internalise more of that stack through joint ventures for display modules and camera modules; how far that raises the value-add is one of the real open questions in the numbers below. Plant-by-plant capacity and addresses are disclosed in the annual report and investor presentations rather than reproduced in full here.
Five years of numbers
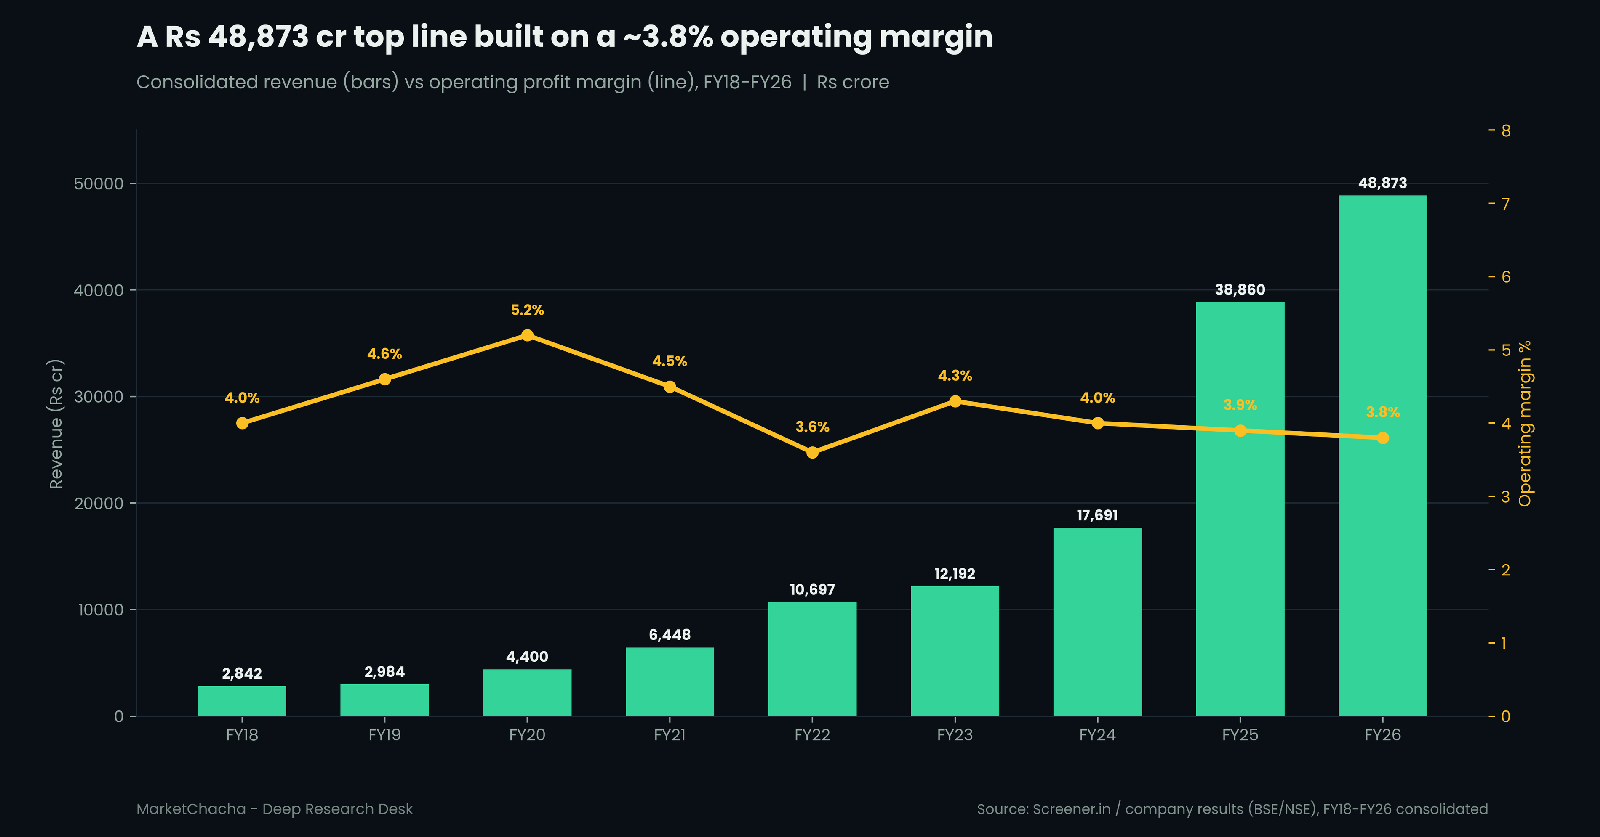
The growth is genuine and very large. On a consolidated basis, revenue rose from ₹10,697 crore (FY22) to ₹17,691 crore (FY24) to ₹38,860 crore (FY25) and ₹48,873 crore (FY26); the trailing-twelve-month figure is about ₹51,585 crore. Net profit rose from ₹190 crore (FY22) to ₹375 crore (FY24), ₹1,233 crore (FY25) and ₹1,644 crore (FY26). Screener’s computed compound growth over five years is roughly 50% for revenue and 55% for profit. What the growth did not do is fatten the factory margin: operating margin has sat in a narrow 3.6–4.6% band for a decade and was about 3.8% in FY26. Return ratios look high — ROE ~37%, ROCE ~42% — because the balance sheet is light and supplier-financed, not because each phone earns much.
Income statement — FY26 vs FY25 (consolidated, ₹ crore).
| Line | FY25 | FY26 | Change | % |
|---|---|---|---|---|
| Revenue | 38,860 | 48,873 | +10,013 | +25.8% |
| Operating profit | 1,515 | 1,867 | +352 | +23.2% |
| Operating margin | 3.9% | 3.8% | −0.1 pp | — |
| Other income | 497 | 734 | +237 | +47.7% |
| Finance cost | 162 | 137 | −25 | −15.4% |
| Depreciation | 281 | 393 | +112 | +39.9% |
| Profit before tax | 1,570 | 2,071 | +501 | +31.9% |
| Net profit (incl. minority) | 1,233 | 1,644 | +411 | +33.3% |
| EPS (₹) | 181.87 | 236.61 | +54.74 | +30.1% |
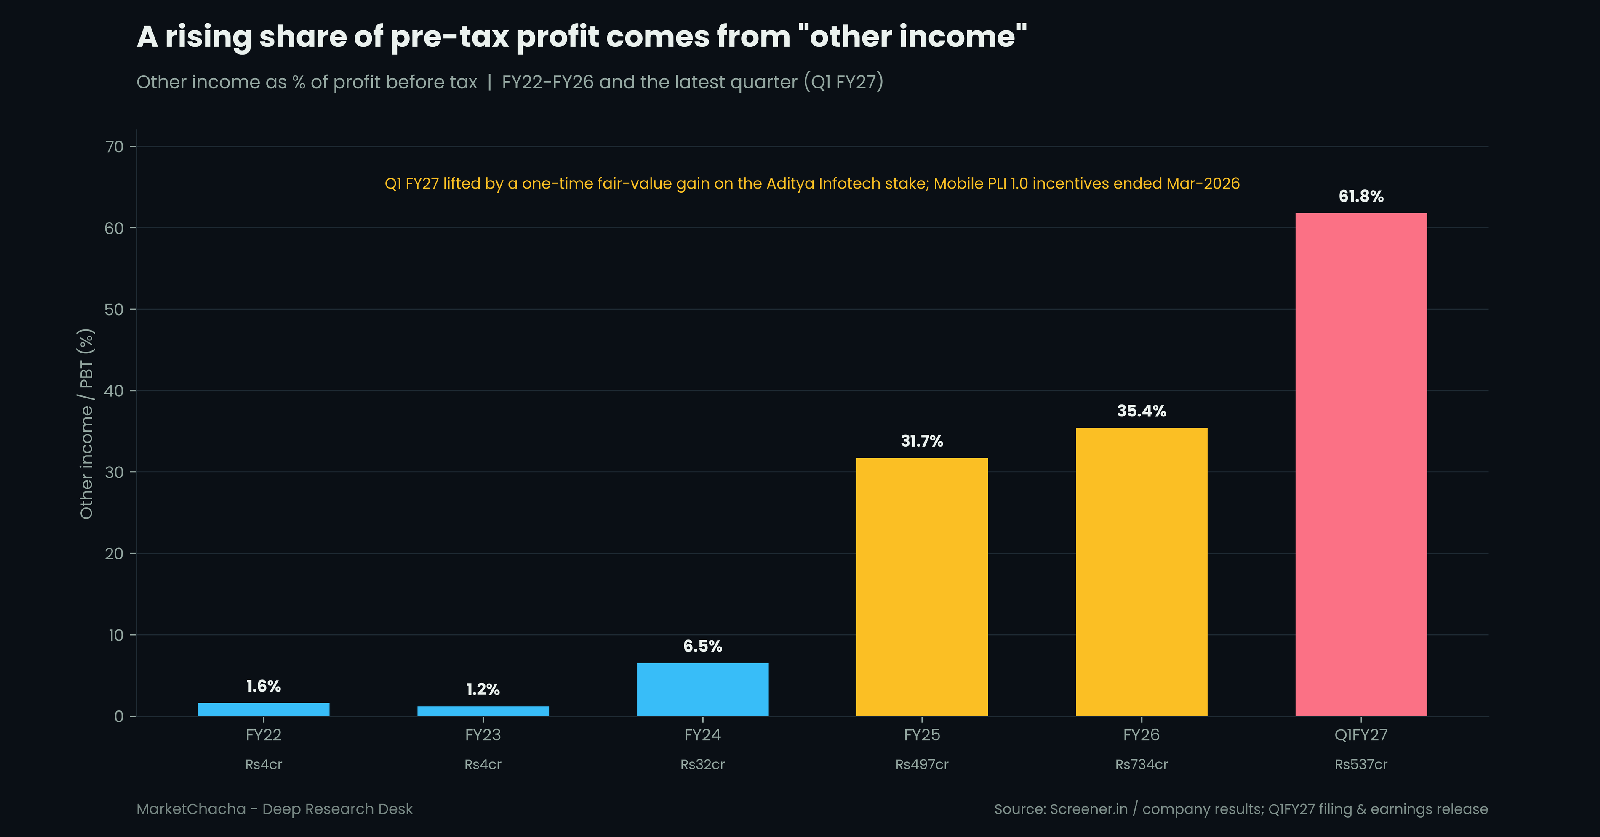
Read the earnings quality carefully. Of the ₹501 crore increase in pre-tax profit, about ₹237 crore — nearly half — came from the rise in other income, not from operations. The core operating engine (operating profit minus finance cost minus depreciation) contributed roughly ₹265 crore of the increase, with depreciation up ~40% as new capacity came on stream. So even in a good year, a large part of profit growth was non-operating.
Balance sheet — FY26 vs FY25 (₹ crore).
| Line | FY25 | FY26 | Change | % |
|---|---|---|---|---|
| Net worth (owners) | 3,010 | 4,677 | +1,667 | +55.4% |
| Borrowings | 671 | 994 | +323 | +48.1% |
| Other liabilities (mostly payables) | 13,077 | 13,491 | +414 | +3.2% |
| Investments | 536 | 1,007 | +471 | +87.9% |
| Net fixed assets | 2,774 | 4,172 | +1,398 | +50.4% |
| Capital work-in-progress | 257 | 571 | +314 | +122% |
| Total assets | 16,758 | 19,162 | +2,404 | +14.3% |
The lines moving more than ~40% are borrowings (+48%), investments (+88%), fixed assets (+50%) and CWIP (+122%) — all consistent with a company in a heavy build-out, funding it with a mix of retained profit and modestly higher debt. Note the sheer size of “other liabilities” (₹13,491 crore) versus net fixed assets (₹4,172 crore): this is a payables-heavy, negative-working-capital business, which is exactly why it can grow revenue five-fold while equity capital stays flat.
Cash flow — FY26 vs FY25 (₹ crore).
| Line | FY25 | FY26 |
|---|---|---|
| Cash from operations (CFO) | 1,150 | 1,782 |
| Cash from investing (CFI) | −1,093 | −1,251 |
| Cash from financing (CFF) | −27 | −108 |
| Free cash flow | 254 | 724 |
Operating cash flow is real and rising, and it comfortably funds the capex with a little left over as free cash flow. On earnings quality across the P&L, balance sheet and cash flow together, the picture is a fast-growing, cash-generative, low-margin assembler whose reported profit growth leans partly on non-operating income — a nuance the headline PAT number hides.
The latest quarter, decoded
| ₹ crore | Q1 FY27 (Jun-26) | Q4 FY26 (Mar-26) | QoQ | Q1 FY26 (Jun-25) | YoY |
|---|---|---|---|---|---|
| Revenue | 15,548 | 10,511 | +48% | 12,836 | +21% |
| Operating profit | 463 | 408 | +13% | 482 | −4% |
| Operating margin | 3.0% | 3.9% | — | 3.8% | — |
| Other income | 537 | 90 | — | 8 | — |
| Profit before tax | 869 | 370 | +135% | 366 | +137% |
| Net profit (incl. minority) | 718 | 298 | +141% | 280 | +156% |
The headline looks spectacular — net profit up ~156% year-on-year — but the operating line tells a different story: revenue rose 21% while operating profit actually fell ~4% and margin compressed to 3.0%. Two disclosed facts explain the gap. First, the Mobile PLI 1.0 scheme — the government production-linked incentive that had been flowing through profit — expired in March 2026, removing a support that had padded prior-year margins. Second, and larger, the quarter carried a one-time, non-cash fair-value gain on Dixon’s equity stake in Aditya Infotech (the CP Plus company, which listed in 2025). By the company’s own adjusted disclosure, profit attributable to owners was about ₹663 crore as reported, but only about ₹218 crore excluding that fair-value gain, and EBITDA excluding the gain was about ₹472 crore. In other words, the “triple” in profit is mostly one accounting mark, while the underlying manufacturing profit softened.
Who owns it — and where those owners are registered
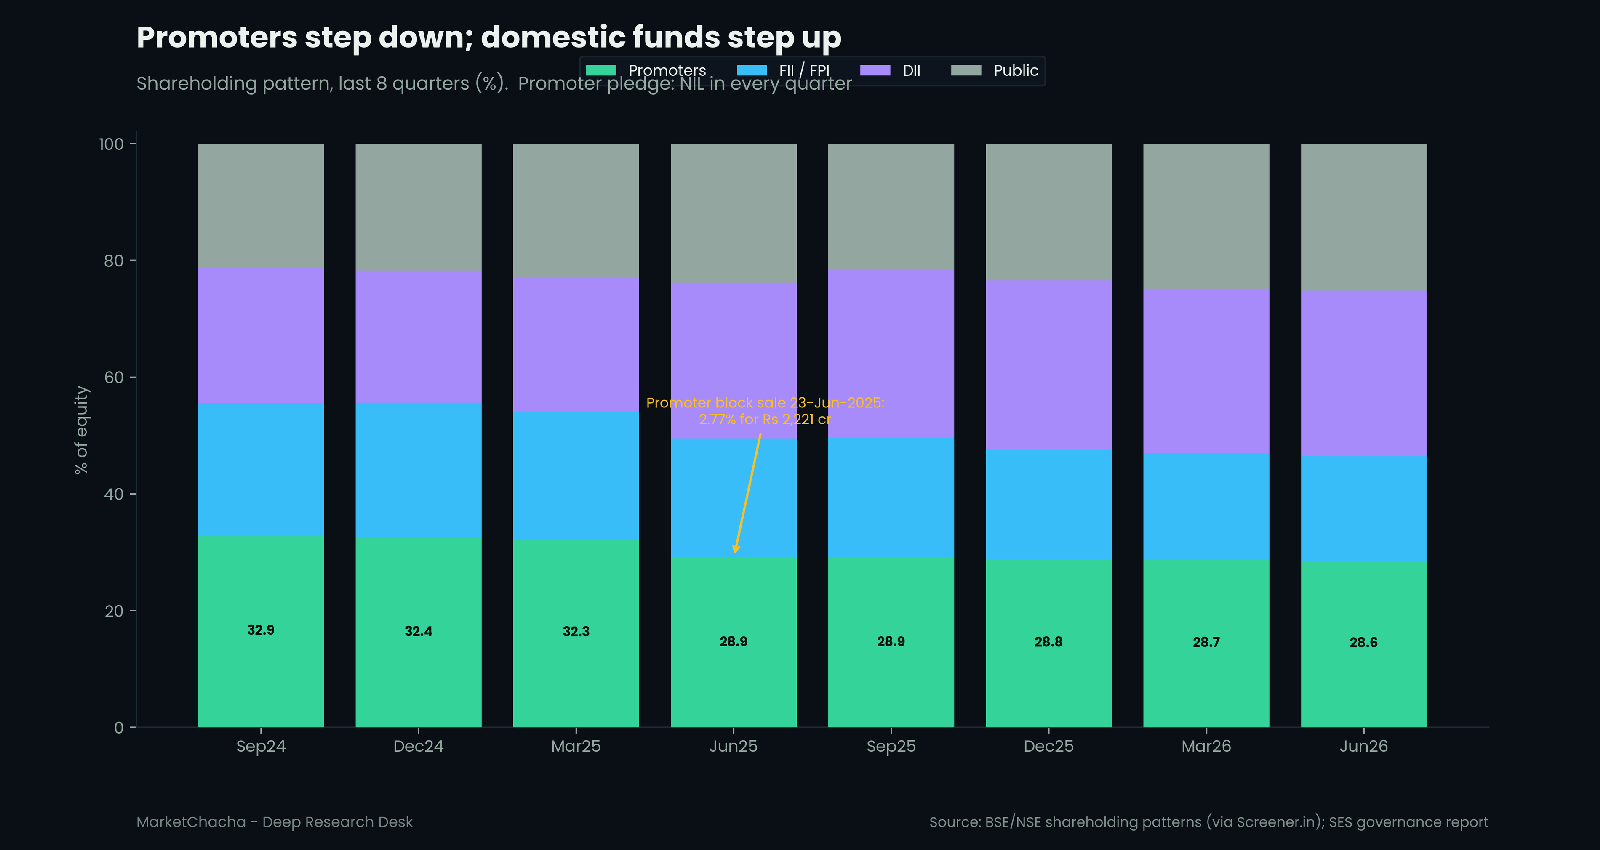
As of the June-2026 quarter, promoters held 28.55%, foreign investors (FII/FPI) 17.87%, domestic institutions (DII) 28.38% and the public 25.20%, spread across about 4.70 lakh shareholders. Two trends stand out. First, the promoter stake has fallen steadily — from about 38.9% at listing to 32.27% in March 2025 and 28.55% by June 2026. The sharpest step came in the June-2025 quarter, when promoter Sunil Vachani sold 16.7 lakh shares (about 2.77% of the company) in a block deal on 23 June 2025 at an average of about ₹13,301, worth roughly ₹2,221 crore; Motilal Oswal Mutual Fund was the principal buyer, lifting its holding from ~2.24% to ~4.63%. Second, foreign holding has drifted down (from ~23% in late-2024 to ~17.9%) while domestic funds have picked up the slack. One clean, verifiable fact frames all of this: the promoters have pledged or encumbered none of their shares (per the SES governance report on the FY25 accounts) — there is no pledge overhang here.
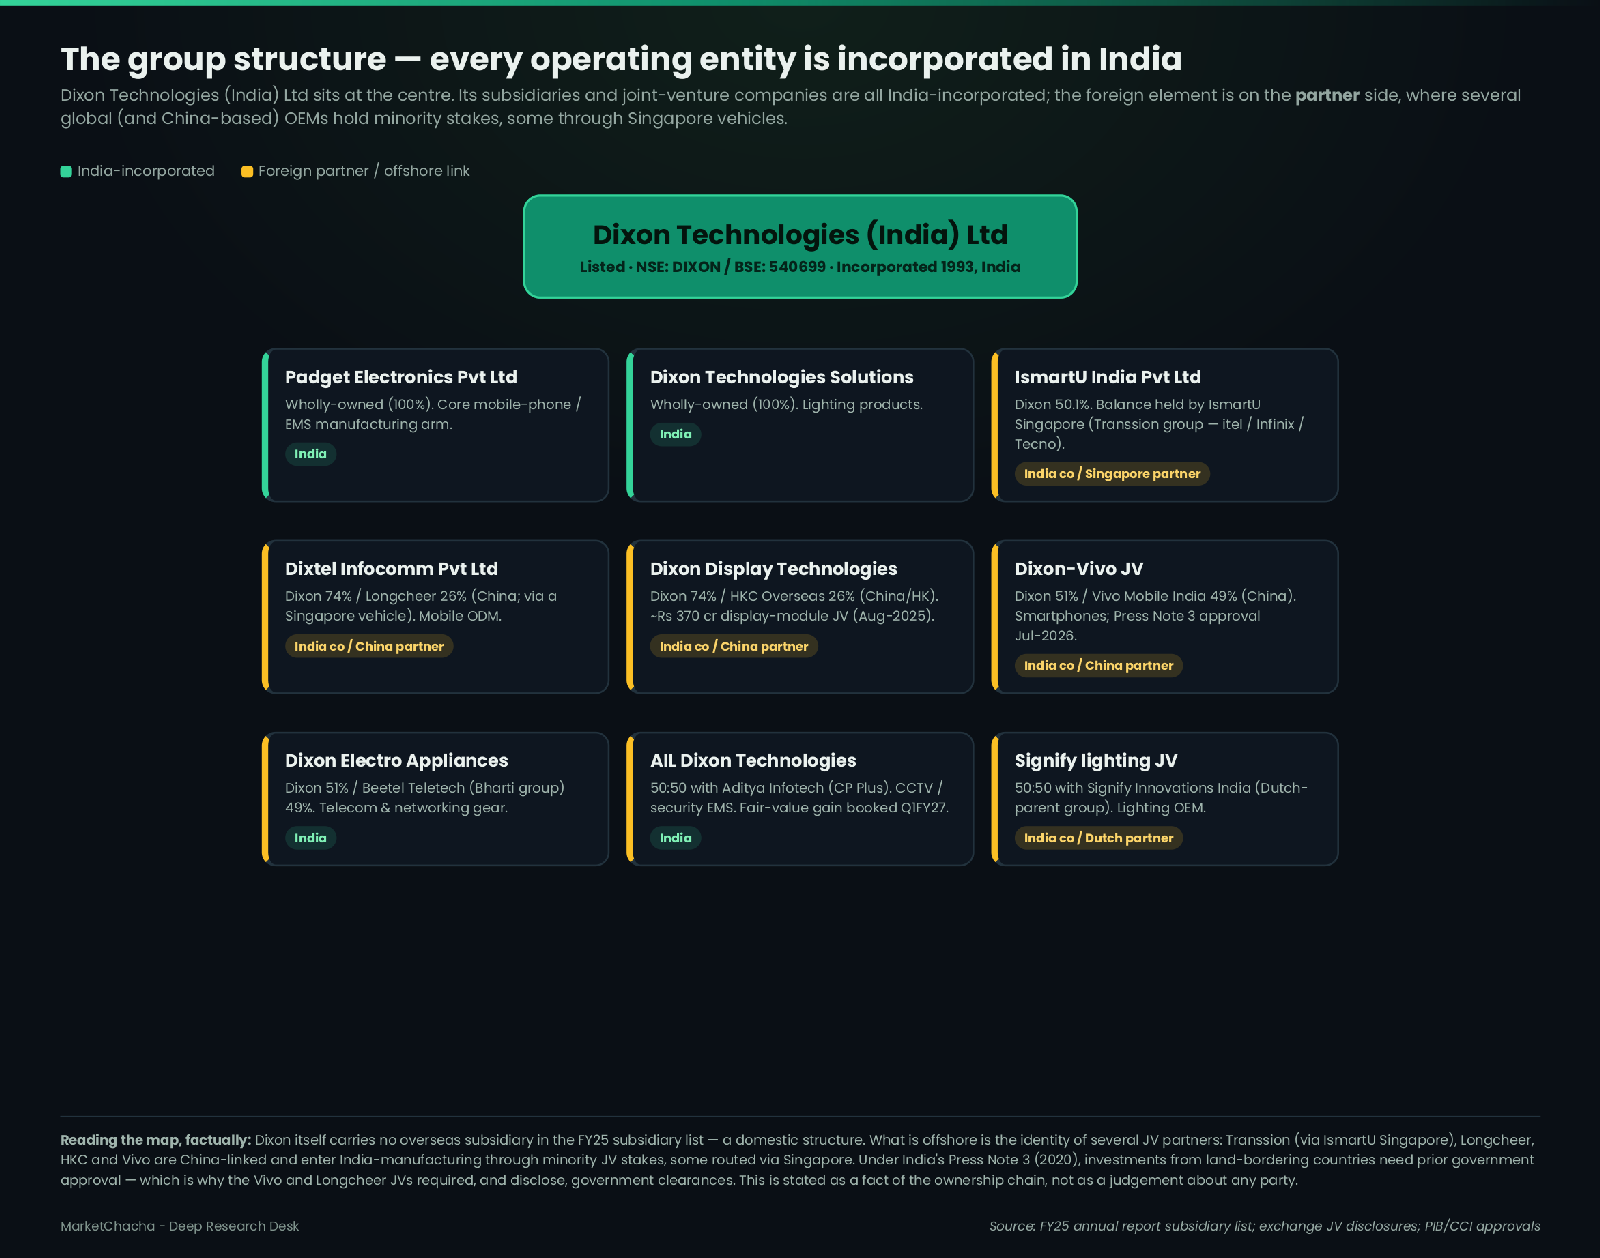
Now the jurisdiction chain, which for an Indian kundli is the heart of the matter. Dixon itself carries no overseas subsidiary in its FY25 subsidiary list — the operating structure is domestic. What is offshore is the identity of several joint-venture partners. Padget Electronics (mobiles) and Dixon Technologies Solutions (lighting) are wholly-owned Indian companies. Ismartu India is 50.1% Dixon, with the balance held by Ismartu Singapore, part of the China-based Transsion group. Dixtel Infocomm (74:26 with China’s Longcheer, via a Singapore vehicle) and Dixon Display Technologies (74:26 with China/Hong Kong’s HKC Overseas) bring display and mobile ODM in-house. A new 51:49 smartphone JV with Vivo Mobile India received government approval under Press Note 3 of 2020 in July 2026, after an 18-month review. Press Note 3 requires prior government approval for investment from countries sharing a land border with India; that is why the Vivo and Longcheer JVs both required, and disclose, government clearances. Stated plainly: this is a factual feature of the ownership chain — several China-linked OEMs entering Indian manufacturing through minority JV stakes, some routed via Singapore — and nothing more should be read into it than the documents say.
Capital history — every time they raised money
This section is unusually short, and that brevity is the finding. Beyond the 2017 IPO (fresh issue ~₹60 crore plus an offer-for-sale) and the 2021 one-into-five stock split, Dixon has not run large equity dilutions — no bonus issues, no headline QIPs — and its equity capital has been essentially unchanged at ~₹12 crore since FY17. The company has funded a five-fold revenue expansion mainly through operating cash flow and supplier credit (its cash-conversion cycle turned negative), topped up with modest borrowings. Employee stock options to the co-founder are disclosed. For a fast-growing mid-cap, the near-absence of repeated preferential allotments or discounted placements to related entities is worth stating as a clean fact.
Who runs it, and the wider web
Sunil Vachani chairs the board in an executive capacity and Atul Lall is managing director. The statutory auditor for FY25 was S.N. Dhawan & Co. LLP, Chartered Accountants, which issued an unmodified (unqualified) opinion; the cost auditor is Satija & Associates and the secretarial auditor is SBYN & Associates LLP. The proxy-advisory firm SES, reviewing the FY25 accounts, flagged two standard governance points: the chairman is not independent (he is executive), and the same director (Arun Seth) chairs both the Audit Committee and the Nomination & Remuneration Committee — SES recommends separating those roles. SES also recorded that no director is disqualified and that there is no regulatory action against the directors. These are governance observations, not findings of wrongdoing.
The regulatory and surveillance record
On the checkable surveillance and credit signals, the record is clean. ICRA reaffirmed Dixon’s long-term rating at [ICRA]AA (Stable) and short-term at [ICRA]A1+ in late November 2025, and reaffirmed again in early January 2026 — there is no “Issuer Not Cooperating” tag, which would be a red flag in its own right. We found no SEBI order against the company, and no indication that the stock is under exchange surveillance measures (ASM/GSM); Dixon is a large, index-eligible, highly liquid name rather than a thinly-traded one. The auditor opinion is unmodified and we found no auditor resignation. The one genuinely material governance-adjacent item is the scale of related-party transactions at the subsidiary level (below), which the company routes through shareholder approval as the law requires.
Forensic checks — what the accounts show
| Check | What we found | A benign / neutral reading |
|---|---|---|
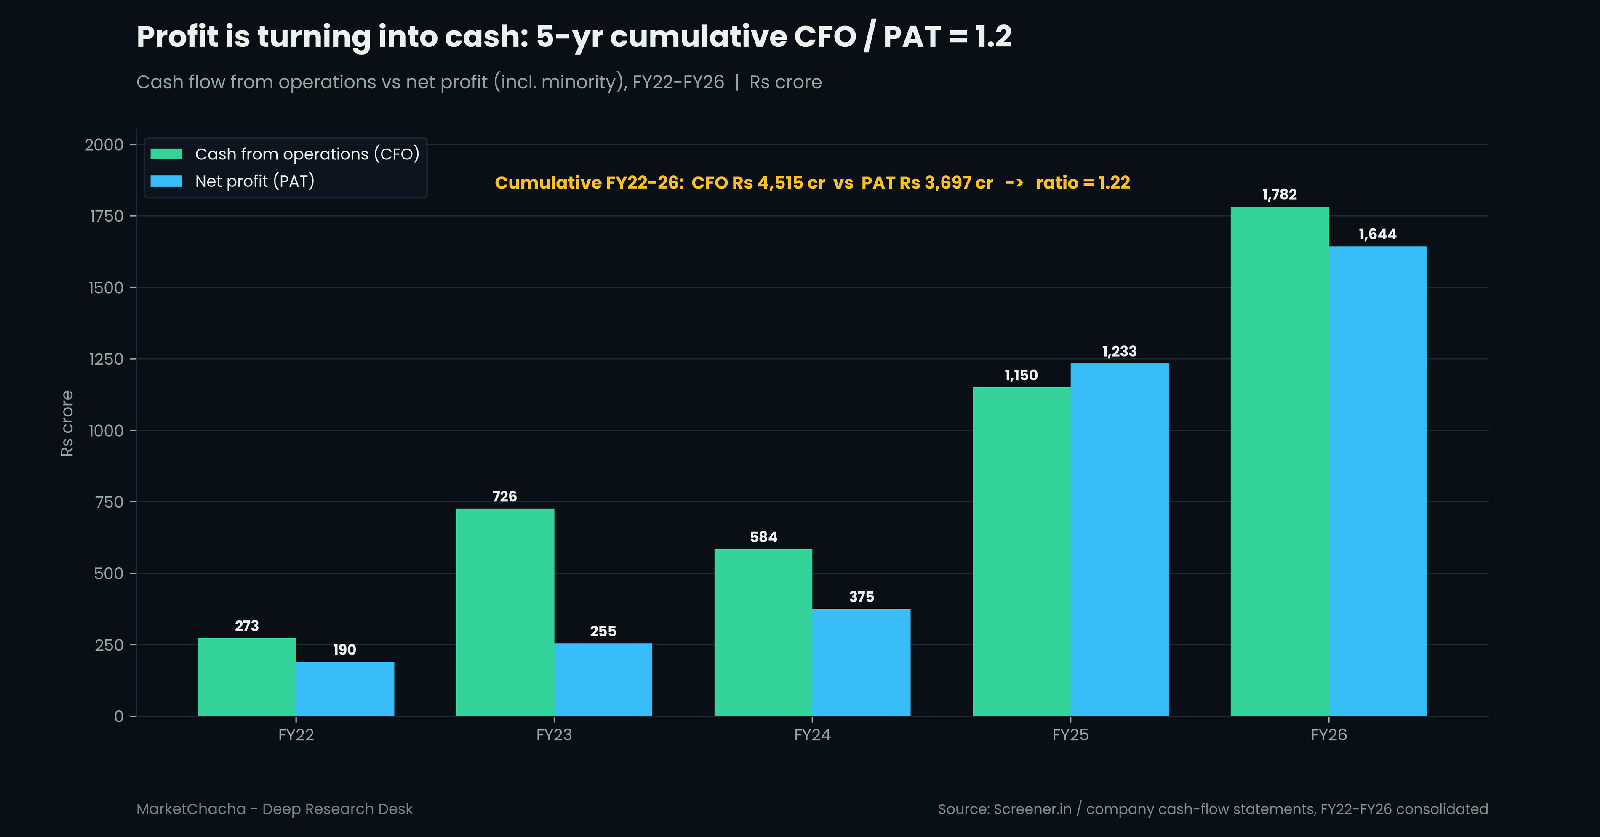
| 5-yr cumulative CFO ÷ PAT | CFO ₹4,515 cr vs PAT ₹3,697 cr (FY22–26) ≈ 1.22 | Above 1.0 — reported profit is converting to cash. A positive. |
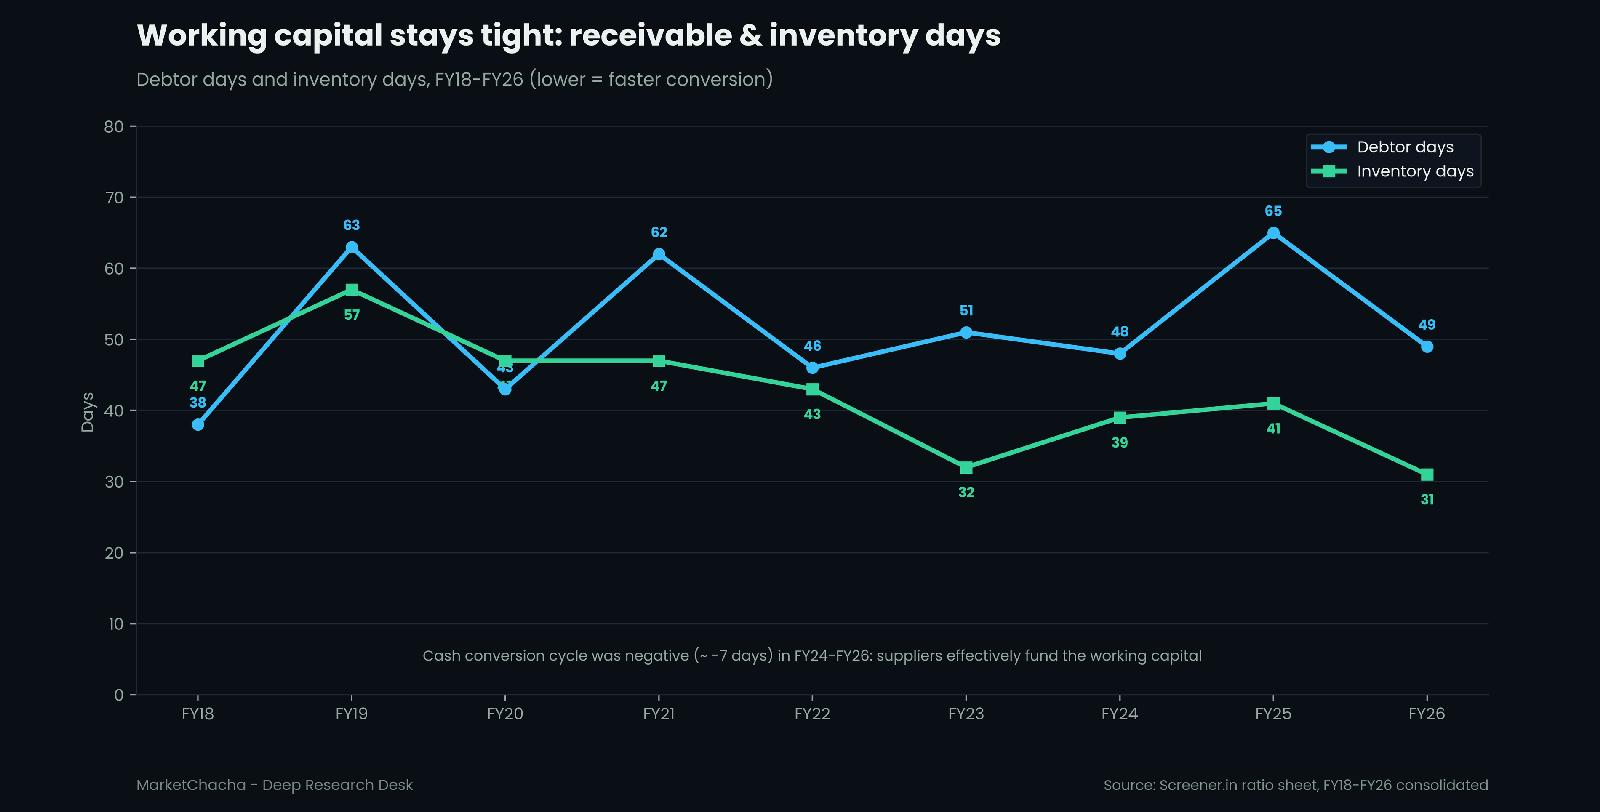
| Idle-cash / treasury drag | Negative working-capital model (cash-conversion cycle ≈ −7 days); investments ₹1,007 cr | No large idle cash pile earning nothing; suppliers fund the cycle. |
| Implied interest rate on debt | Finance cost ÷ average borrowings ≈ 16.5% (FY26), ~28% (FY25) | The finance-cost line includes lease interest (Ind AS 116) and bill-discounting/supply-chain finance; period-end borrowings understate average utilisation, so this overstates the coupon on term debt. |
| Receivable & inventory days | Debtor days 65→49; inventory days 41→31 (FY25→FY26) | Not ballooning against profit — no classic revenue-inflation signal. |
| Related-party transactions | Material RPTs of subsidiaries (Dixon Electro Appliances, Padget, Ismartu) put to shareholders; thresholds > ₹1,000 cr or 10% of consolidated turnover | Large but intra-group / with JV partners (Bharti, Transsion, Aditya); routed through the approval process the law requires. Exact amounts are in the AR’s RPT note. |
| Promoter pledge / holding | Pledge NIL; promoter stake 38.9%→28.55%; 2.77% block sale Jun-2025 for ₹2,221 cr | No pledge overhang. Promoters can sell for many reasons (diversification, tax); the fact is the sell-down, not the motive. |
| Auditor | S.N. Dhawan & Co. LLP; unmodified opinion FY25; no resignation found | Clean opinion; partner-rotation compliant per SES. |
| Subsidiaries & jurisdictions | All operating entities India-incorporated; foreign minority partners (China-linked via Singapore/HK; Dutch). No Dixon overseas subsidiary | Offshore element is on the partner side; JVs from land-border countries disclose Press Note 3 approvals. |
| Dilution / preferential allotments | Equity ~₹12 cr since FY17; IPO 2017 + 1:5 split 2021; no bonus/QIP found | Minimal dilution — growth self-funded and supplier-financed. |
| Other income as % of PBT | 31.7% (FY25), 35.4% (FY26), ~49% (TTM), ~62% (Q1 FY27) | Includes PLI incentives (now expiring) and treasury; Q1 FY27 spike is a one-time Aditya Infotech fair-value gain. The earnings-quality flag of this file. |
| Capex vs depreciation | Fixed assets ₹2,774→₹4,172 cr, CWIP +122%; depreciation ₹393 cr | Heavy expansion phase; capex well above depreciation as new mobile/display capacity is built. |
The single most important line is the last-but-two: profit before tax now leans meaningfully on other income, and the biggest quarterly contributor to date was a one-off mark, not manufacturing. Set against that, the cash-conversion check (1.22) is genuinely reassuring — whatever the composition of profit, the operations are producing cash.
What we could not verify
We could not put an exact figure on the single-largest-customer concentration in the mobile division from the materials reviewed; that lives in the annual report’s segment/customer notes. We did not extract the precise rupee value of related-party transactions as a percentage of revenue — only the approval thresholds the company disclosed. The FY26 annual report was not yet published as of mid-August 2026 (the AGM cycle typically falls in September), so the FY26 auditor’s report and subsidiary list were not available; we relied on the FY25 annual report and the FY26 results filings. We did not independently split the FY26 ₹734 crore of other income between PLI incentives, treasury income and fair-value marks. Each of these is a gap a reader should close against the primary documents.
What would change the picture
Four checkable things. First, the FY26 annual report: the auditor’s report, the full related-party note, and the subsidiary/jurisdiction list. Second, the next two quarters’ operating margin — with Mobile PLI 1.0 gone, does the core margin hold above ~3%, or was PLI doing more of the work than it looked? Third, the next shareholding pattern: does the promoter stake keep sliding, and does the pledge stay nil? Fourth, the ramp and economics of the Vivo, Longcheer and HKC joint ventures — whether in-housing displays and camera modules actually lifts value-add — and the receivables line as revenue scales.
Sources
- Screener.in — Dixon Technologies consolidated financials, ratios, shareholding, documents: https://www.screener.in/company/DIXON/consolidated/
- FY2025 Annual Report (BSE): https://www.bseindia.com/xml-data/corpfiling/AttachHis/7eabc370-b827-435c-9dd2-8a70553a8062.pdf
- FY2025 Annual Report (MSEI copy): https://www.msei.in/SX-Content/Listing/Annual-Reports/2025/DIXON-2025.pdf
- Q4/FY25 audited results & presentation (NSE): https://nsearchives.nseindia.com/corporate/DIXON_20052025161223_FinancialwithPPT20052025.pdf
- Q1 FY27 earnings-call transcript (BSE): https://www.bseindia.com/stockinfo/AnnPdfOpen.aspx?Pname=7ce2ca16-3043-48f4-97f9-a62a6a086c2f.pdf
- SES Governance proxy report, AGM 23 Sep 2025: https://portal.sesgovernance.com/proxy_reports/4147537685Dixon%20Technologies%20(India)%20Ltd_SES_PA_Report_AGM_23%20Sep%202025.pdf
- ICRA rating rationale (reaffirmation, Nov 2025): https://www.icra.in/Rating/GetRationalReportFilePdf?id=139329
- ICRA rating rationale (reaffirmation, Jan 2026): https://www.icra.in/Rationale/ShowRationaleReport/?Id=140153
- Promoter block sale (23 Jun 2025) — Business Standard: https://www.business-standard.com/companies/news/dixon-technologies-promoter-sunil-vachani-sells-stake-2221-crore-q4-results-125062301276_1.html
- Dixon–Vivo JV, Press Note 3 approval (Jul 2026) — Free Press Journal: https://www.freepressjournal.in/business/govt-approves-dixon-vivo-jv-for-smartphone-manufacturing-in-india-under-press-note-3-framework
- Dixon–Longcheer (Dixtel) JV — Business Standard: https://www.business-standard.com/companies/news/dixon-technologies-longcheer-joint-venture-dixtel-infocomm-govt-approval-125072501047_1.html
- Dixon–HKC display JV (~₹370 cr) — Business Standard: https://www.business-standard.com/markets/news/dixon-technologies-stock-jumps-4-on-370-cr-jv-with-china-s-hkc-overseas-125081800455_1.html
- Ismartu India acquisition (56% CCI approval) — PIB: https://www.pib.gov.in/PressReleasePage.aspx?PRID=2034124
- Q1 FY27 results & Aditya Infotech fair-value gain — Investing.com: https://www.investing.com/news/company-news/dixon-technologies-q1-fy27-slides-revenue-up-21-margins-contract-93CH-4828133
- Dixon IPO 2017 (subscription, listing) — Chittorgarh: https://www.chittorgarh.com/ipo/dixon-ipo/705/
FAQ
Is Dixon Technologies a good buy right now? This note offers no view on that. We do not issue buy/sell/hold calls, target prices or ratings. We lay out the verified numbers — the thin operating margin, the rising share of other income, the promoter sell-down, the clean cash conversion, the nil pledge — and leave the decision to you.
Why did June-2026 quarter profit nearly triple if margins fell? Because most of the jump was a one-time, non-cash fair-value gain on Dixon’s stake in Aditya Infotech. By the company’s own adjusted disclosure, owners’ profit was ~₹663 crore as reported but ~₹218 crore excluding that gain, while operating profit actually fell about 4% year-on-year as the Mobile PLI 1.0 scheme expired.
Are the promoters pledging or exiting? There is no pledge — the promoters have encumbered none of their shares. They have, however, reduced their stake over time, from ~38.9% at listing to 28.55% by June 2026, including a 2.77% block sale worth ~₹2,221 crore in June 2025. Those are two separate facts.
Does Dixon have offshore subsidiaries or hidden owners? Dixon itself carries no overseas subsidiary in its FY25 list; the operating companies are all India-incorporated. Several JV partners are China-linked (Transsion, Longcheer, HKC, Vivo), some via Singapore, and those JVs disclose the Press Note 3 government approvals they required. That is disclosed as structure, not as an allegation.
Is the profit real, or just accounting? The cash test is reassuring: over FY22–26 cumulative operating cash flow (₹4,515 crore) exceeded cumulative net profit (₹3,697 crore), a ratio of ~1.22. The caveat is that a growing slice of pre-tax profit is other income rather than manufacturing margin — strong cash generation, but watch where the profit is coming from.
What is the biggest risk the filings actually show? Margin dependence on factors outside the core assembly business — government PLI incentives (Mobile PLI 1.0 expired March 2026) and non-operating income — layered on a ~3.8% operating margin and a valuation of roughly 46x earnings and ~18x book. Whether the core margin holds without PLI is the checkable question of the next two quarters.
Independent research for education and discussion only. Not investment advice, not a recommendation, and not a rating — we issue no buy/sell calls and no target prices. Every figure is sourced from the primary documents linked above; figures can be restated and we can make mistakes, so always verify against the original. Nothing here alleges wrongdoing by any company or individual: where a fact raises a question we state the fact, cite it, and give the benign explanation alongside. Offshore holding structures, pledging and preferential allotments are all legal and common — they are disclosed here as facts, not as accusations.
This article is for educational and informational purposes only. It is not financial advice, investment recommendation, or a solicitation to buy or sell securities. Investing involves significant risks. I am not a SEBI-registered investment advisor. Readers should consult their own financial advisor and conduct their own research before making any investment decisions.
Comments
Join the conversation
Sign in to join the conversation.
Follow replies, add your view, and take part in the discussion.
Sign in to commentLoading comments...