

Kaynes Technology (KAYNES): the full file — the numbers, the owners, and what the filings actually show
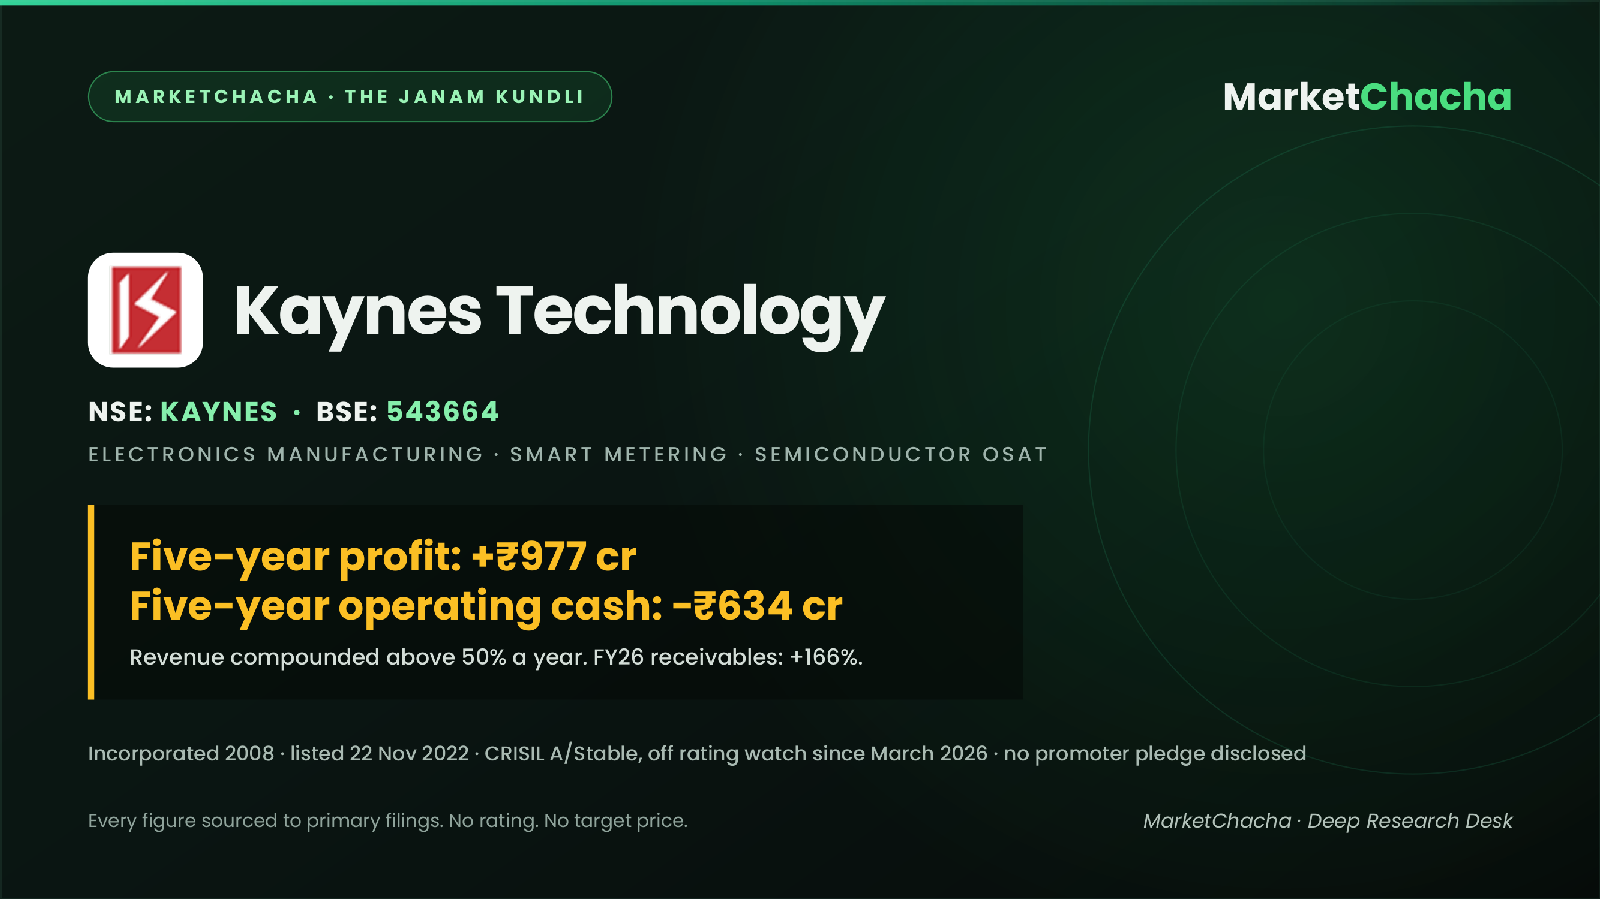
Kaynes Technology India Limited builds electronics for other people: printed circuit board assemblies, box builds and complete products for automotive, industrial, railway, medical, aerospace and defence customers, plus smart electricity meters sold to state power utilities. It earns a manufacturing margin on other companies' designs, and increasingly on its own — it is building an OSAT semiconductor packaging plant at Sanand and a high-density PCB plant.
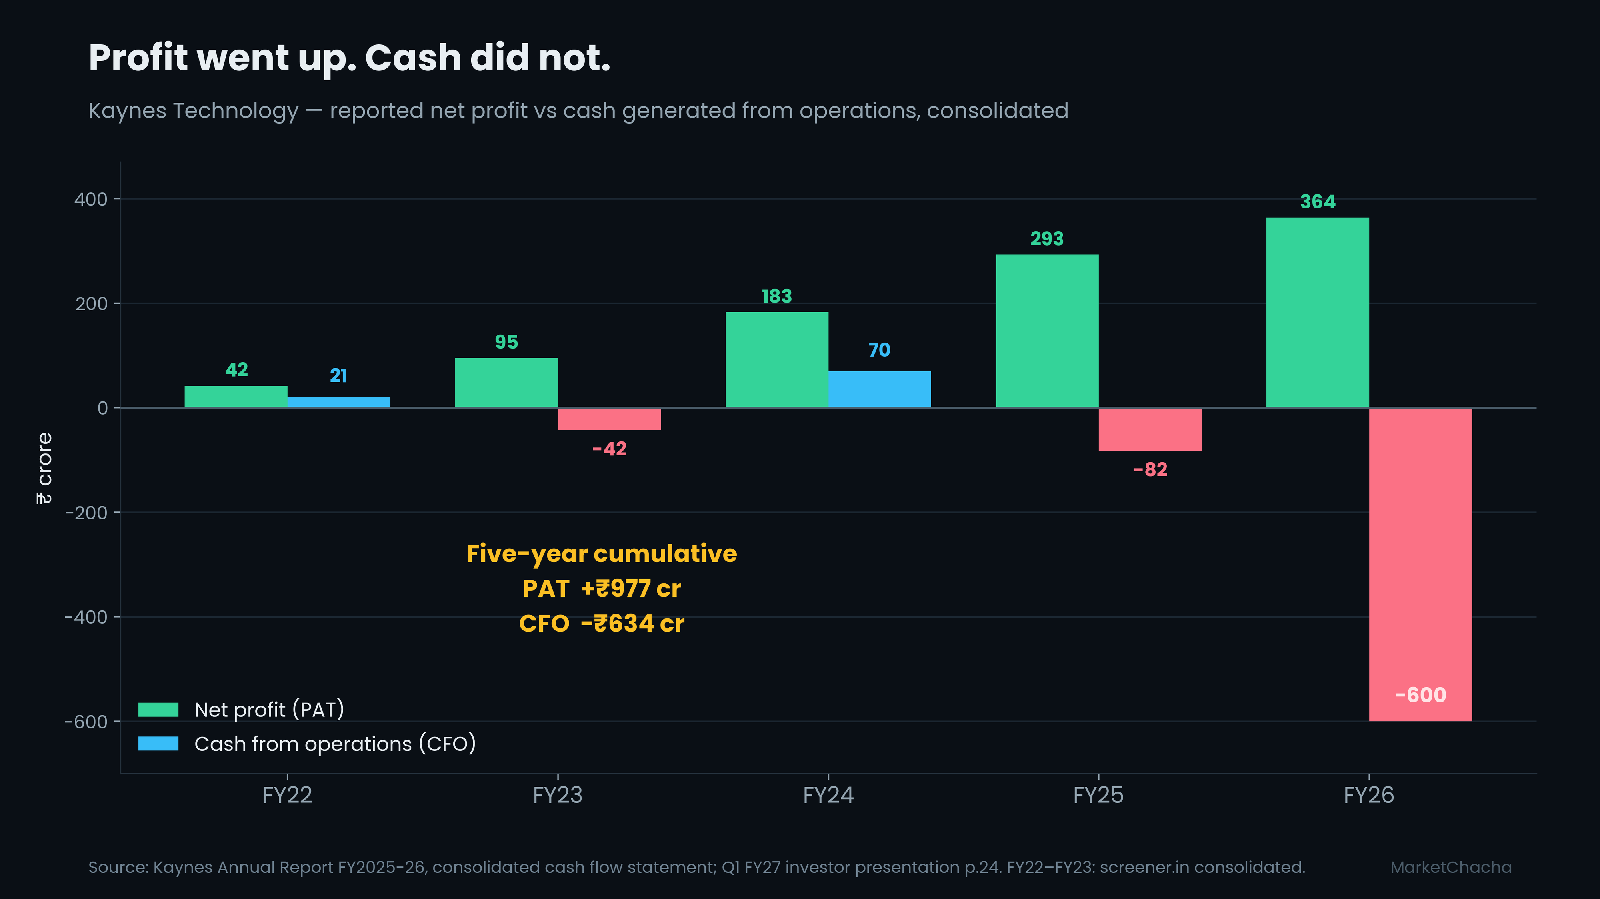
The record shows a company whose reported profit has compounded at over 70% a year for four years, and whose cash from operations over the same five years adds up to a negative number. Both statements come from the same audited accounts. This report lays out what the filings say, line by line, and links every document.
Origin — the company's birth certificate
The business started in 1988 as a sole proprietorship with a single unit in Mysore. It was converted into a private limited company in 2008, which is why the corporate identity number reads L29128KA2008PLC045825 and why the meeting called for 17 September 2026 is only the eighteenth annual general meeting. The registered office is still at 23-25, Belagola Food Industrial Estate, Metagalli PO, Mysuru 570016.
The promoters are Ramesh Kunhikannan (DIN 02063167) and Savitha Ramesh (DIN 01756684), both appointed to the board on 28 March 2008. Between them they held 3,58,38,533 shares, or 53.4627%, as at 31 March 2026 — and Ramesh Kunhikannan personally holds 3,58,18,633 of those. In other words the promoter block is, for practical purposes, one individual.
The company listed on 22 November 2022 at an IPO price of ₹587 per share. The issue raised ₹857.82 crore: ₹530 crore of fresh capital and ₹327.82 crore sold by existing holders. The stock closed at ₹3,815 on 20 August 2026. That is a gain of about 550% in three years and nine months, a compound annual return of roughly 65% — and also 50.5% below the ₹7,705 high of the past twelve months.
The business — what they actually sell
Consolidated revenue for FY2025-26 was ₹3,626 crore, up 33.2% from ₹2,722 crore. Of that, ₹3,520 crore was sale of goods and ₹107 crore sale of services. The company reports a single business segment — electronics manufacturing services — and splits revenue only by geography: ₹3,275 crore in India and ₹351 crore outside India. Exports are therefore under 10% of the top line.
Two things have changed the shape of the business. In September 2024 Kaynes acquired Iskraemeco India Private Limited, now renamed Gridcrest Technologies, which makes smart electricity meters for state utilities. In FY2026 it acquired August Electronics Inc in Canada for ₹414 crore, raised its stake in the Austrian railway-safety business Sensonic GmbH from 54% to 61%, and bought 76% each of Aerocaliph Components and Cryo Precision Technologies. The order book stood at ₹8,904 crore at 30 June 2026, against ₹7,401 crore a year earlier.
Who actually buys from them
The segment note discloses only customers above 10% of revenue, and does not name them. In FY2026 a single customer — "Customer A" — accounted for ₹844 crore, or 23.99% of sale of goods. In FY2025 the same disclosure line showed 13.07%. So concentration in the largest customer roughly doubled in one year. The company states that "customer identities have been excluded to safeguard confidentiality" and that "the entities represented in each period are not necessarily identical" — meaning it is not possible to confirm from the filing that FY26's Customer A is FY25's Customer A.
Beyond that the filings and the earnings call give named end-customers rather than revenue shares: Mahindra and Siemens are named as award-giving customers, and management refers to a "leading electric vehicle two-wheeler customer" and to India's second-largest two-wheeler EV manufacturer being onboarded. On the metering side the buyers are state power distribution utilities, which matters a great deal for the cash flow discussion below.
Where it is actually made — plants and supply chain
Manufacturing sits at Mysuru (headquarters and multiple units), Chamarajanagara, Manesar, Chennai and Hyderabad in India, with the ₹3,307 crore OSAT facility at Sanand, Gujarat, as the flagship new build. Overseas, Digicom Electronics operates a unit in Oakland, California; August Electronics adds a Canadian plant; Sensonic operates from Austria and the UK.
Input dependency is disclosed only in general terms. The annual report notes dependence on critical imported inputs and the India Semiconductor Mission context, and on the Q1 FY27 call management said lead times in some component categories have stretched to "more than 6 to 8 months", which is why it deliberately pre-bought inventory from February 2026. Named single-source suppliers are not disclosed. Nor is a supplier concentration percentage.
Five years of numbers
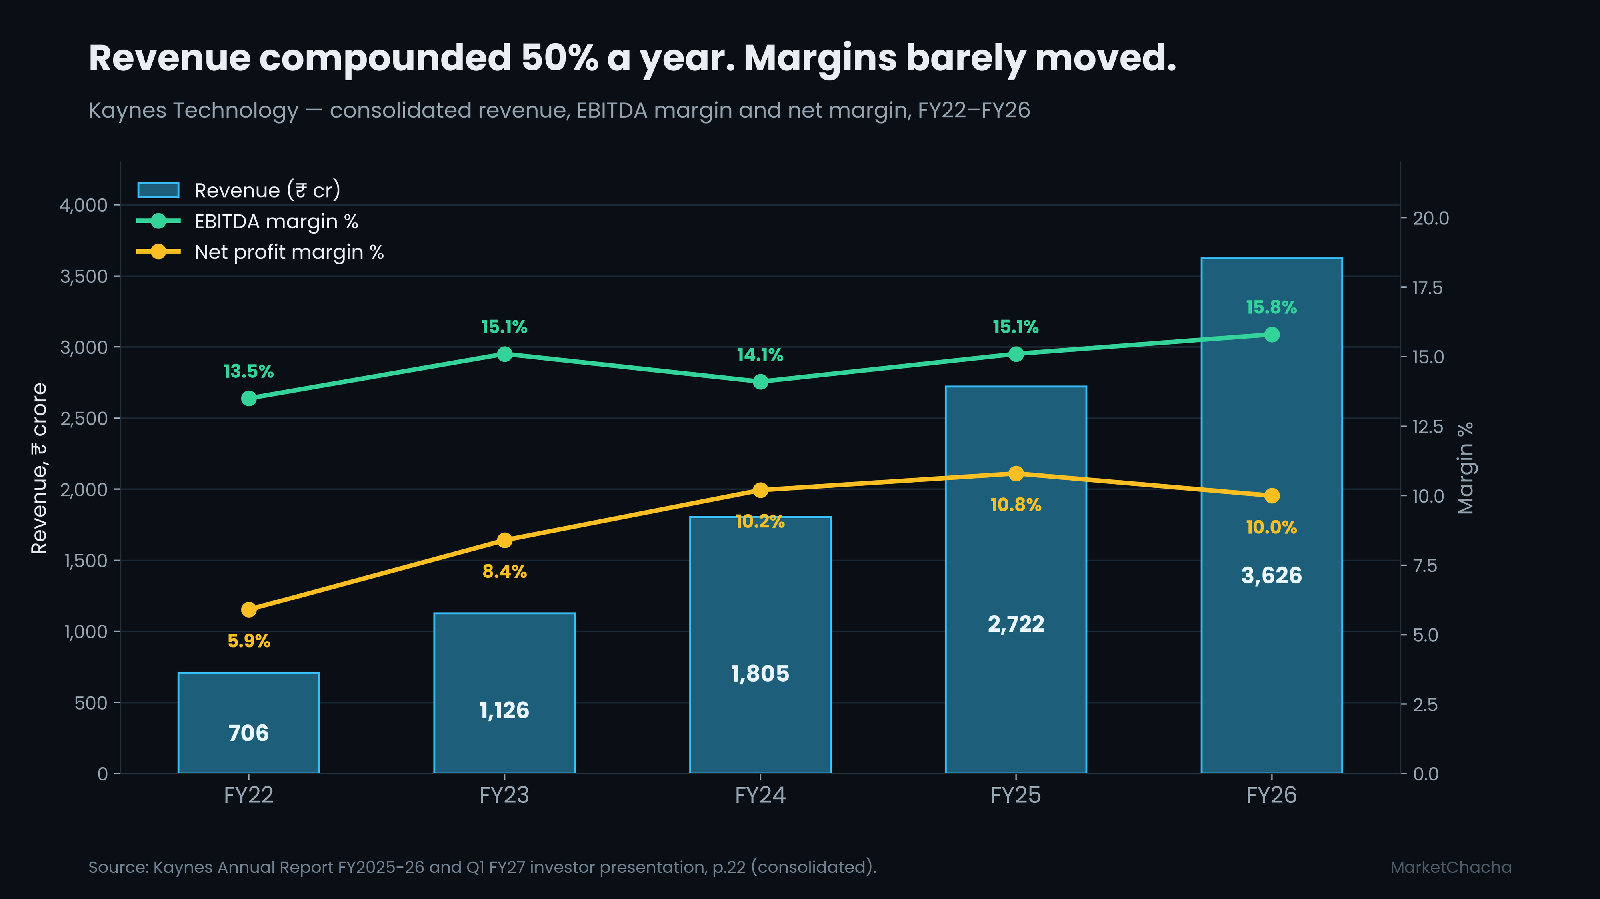
| ₹ crore, consolidated | FY22 | FY23 | FY24 | FY25 | FY26 |
| Revenue | 706 | 1,126 | 1,805 | 2,722 | 3,626 |
| EBITDA | 95 | 170 | 254 | 411 | 574 |
| EBITDA margin | 13.5% | 15.1% | 14.1% | 15.1% | 15.8% |
| Net profit | 42 | 95 | 183 | 293 | 364 |
| Net margin | 5.9% | 8.4% | 10.2% | 10.8% | 10.0% |
| Cash from operations | 21 | −42 | 70 | −82 | −600 |
Revenue compounded at 50.5% a year from FY22 to FY26; net profit at 71.6%; EPS from ₹9.03 to ₹54.85, a 57% compound rate. Over the same five years, cumulative net profit was +₹977 crore and cumulative cash from operations was −₹634 crore. The ratio is −0.65. On a healthy manufacturer that ratio sits somewhere around 0.8 to 1.2.
Income statement, FY2026 vs FY2025
| ₹ million, consolidated | FY26 | FY25 | Change | % |
| Revenue from operations | 36,263.54 | 27,217.52 | +9,046.02 | +33.2% |
| Cost of materials consumed | 25,422.22 | 19,116.26 | +6,305.96 | +33.0% |
| Employee benefits | 3,135.54 | 1,780.67 | +1,354.87 | +76.1% |
| Other expenses | 3,668.59 | 2,332.76 | +1,335.83 | +57.3% |
| EBITDA | 5,740.55 | 4,106.99 | +1,633.56 | +39.8% |
| EBITDA margin | 15.8% | 15.1% | +0.7 pt | — |
| Other income | 1,568.30 | 1,069.63 | +498.67 | +46.6% |
| Finance cost | 1,169.27 | 1,012.98 | +156.29 | +15.4% |
| Depreciation and amortisation | 1,070.68 | 447.40 | +623.28 | +139.3% |
| Exceptional items | −25.76 | — | −25.76 | — |
| Profit before tax | 5,043.14 | 3,716.24 | +1,326.90 | +35.7% |
| Tax | 1,404.24 | 781.91 | +622.33 | +79.6% |
| Profit after tax | 3,638.90 | 2,934.33 | +704.57 | +24.0% |
| Net margin | 10.0% | 10.8% | −0.8 pt | — |
| Basic EPS (₹) | 54.85 | 45.82 | +9.03 | +19.7% |
Two lines carry most of the story. Depreciation more than doubled, which is the OSAT and PCB capex and the acquired intangibles starting to be charged. And the effective tax rate rose from 21.0% to 27.8%, which is why PAT grew 24% while PBT grew 35.7% and EBITDA grew 39.8%. Other income of ₹1,568 million was 31.1% of pre-tax profit, against 28.8% the prior year; that income is largely interest on the unutilised IPO and QIP money sitting in fixed deposits, and it is not operating profit.
Balance sheet, FY2026 vs FY2025
| ₹ million, consolidated | FY26 | FY25 | % |
| Property, plant and equipment | 11,097.28 | 5,044.94 | +120.0% |
| Capital work-in-progress | 3,724.11 | 3,002.24 | +24.0% |
| Intangible assets | 3,819.54 | 1,328.56 | +187.5% |
| Inventories | 11,032.27 | 8,144.23 | +35.5% |
| Trade receivables, net | 15,276.15 | 5,745.80 | +165.9% |
| Cash and cash equivalents | 1,094.29 | 474.22 | +130.8% |
| Other bank balances (deposits) | 6,891.62 | 10,088.84 | −31.7% |
| Total assets | 68,940.15 | 46,412.17 | +48.5% |
| Total equity | 47,624.88 | 28,442.32 | +67.4% |
| Long-term borrowings | 3,369.98 | 674.80 | +399.4% |
| Short-term borrowings | 5,379.41 | 8,080.03 | −33.4% |
| Trade payables | 8,507.58 | 6,829.19 | +24.6% |
Total borrowings barely moved — ₹8,755 million to ₹8,749 million — but the mix shifted heavily from short-term to long-term after ₹841 crore of QIP proceeds went to debt repayment. Because deposits fell while borrowings held, the group moved from a net cash position of ₹1,808 million to net debt of ₹763 million. Book value per share is ₹708.
Cash flow, FY2026 vs FY2025
| ₹ million, consolidated | FY26 | FY25 |
| Operating profit before working capital changes | 6,717.06 | 4,343.02 |
| Increase in inventories | −2,888.04 | −2,660.99 |
| Increase in trade receivables | −10,238.66 | −2,190.08 |
| Increase in payables and other liabilities | +3,178.04 | +4,390.31 |
| Taxes paid | −1,398.75 | −644.35 |
| Cash from operations | −6,004.04 | −823.16 |
| Cash used in investing | −9,172.18 | −3,546.59 |
| Of which: purchase of fixed assets | −12,403.01 | −9,487.47 |
| Cash from financing | +15,796.29 | +4,649.86 |
| Free cash flow (CFO less capex) | −18,407 | −10,311 |
The arithmetic is unambiguous. Operating profit before working capital was ₹6,717 million. A ₹10,239 million increase in receivables and a ₹2,888 million increase in inventory consumed all of it and more. The ₹15,796 million of financing inflow — almost entirely the ₹16,000 million QIP — is what funded the year.
The latest quarter, decoded
| ₹ crore, consolidated | Q1 FY27 | Q4 FY26 | QoQ | Q1 FY26 | YoY |
| Revenue | 946 | 1,243 | −23.9% | 673 | +40.6% |
| Operating profit | 148 | 194 | −23.7% | 113 | +31.0% |
| Operating margin | 15.6% | 15.6% | flat | 16.8% | −1.2 pt |
| Other income | 14 | 42 | −66.7% | 27 | −48.1% |
| Finance cost | 37 | 41 | −9.8% | 28 | +32.1% |
| Depreciation | 37 | 54 | −31.5% | 16 | +131.2% |
| Profit before tax | 88 | 140 | −37.1% | 96 | −8.3% |
| Tax rate | 36% | 35% | — | 22% | +14 pt |
| Net profit | 56 | 91 | −38.5% | 75 | −25.3% |
Revenue grew 40.6% year on year and net profit fell 25.3%. Three things bridge that gap and only one of them is operating: depreciation more than doubled on the new plants, the tax rate went from 22% to 36%, and other income halved as the deposit pile shrank. Strip out the ₹13 crore fall in other income and pre-tax profit would have been roughly flat rather than down 8%. The quality of the miss is therefore mostly below the EBITDA line.
Management's own account of the quarter, from the 8 August 2026 earnings call, is worth quoting because it is unusually specific. EMS revenue was about ₹854 crore including GST and collections were ₹847 crore — near-complete. The metering business, Gridcrest, billed about ₹240 crore and collected ₹88 crore, and management said this "made us … take a decision to stop productions and supplies". Consolidated operating cash flow for the quarter was negative ₹235 crore. About ₹200 crore of metering money arrived in the first week of July. Working capital ran at 190 days for the standalone quarter, 163 days on a rolling twelve-month basis. Management stated it expects to be cash positive by the end of FY2027.
The receivables question, in detail
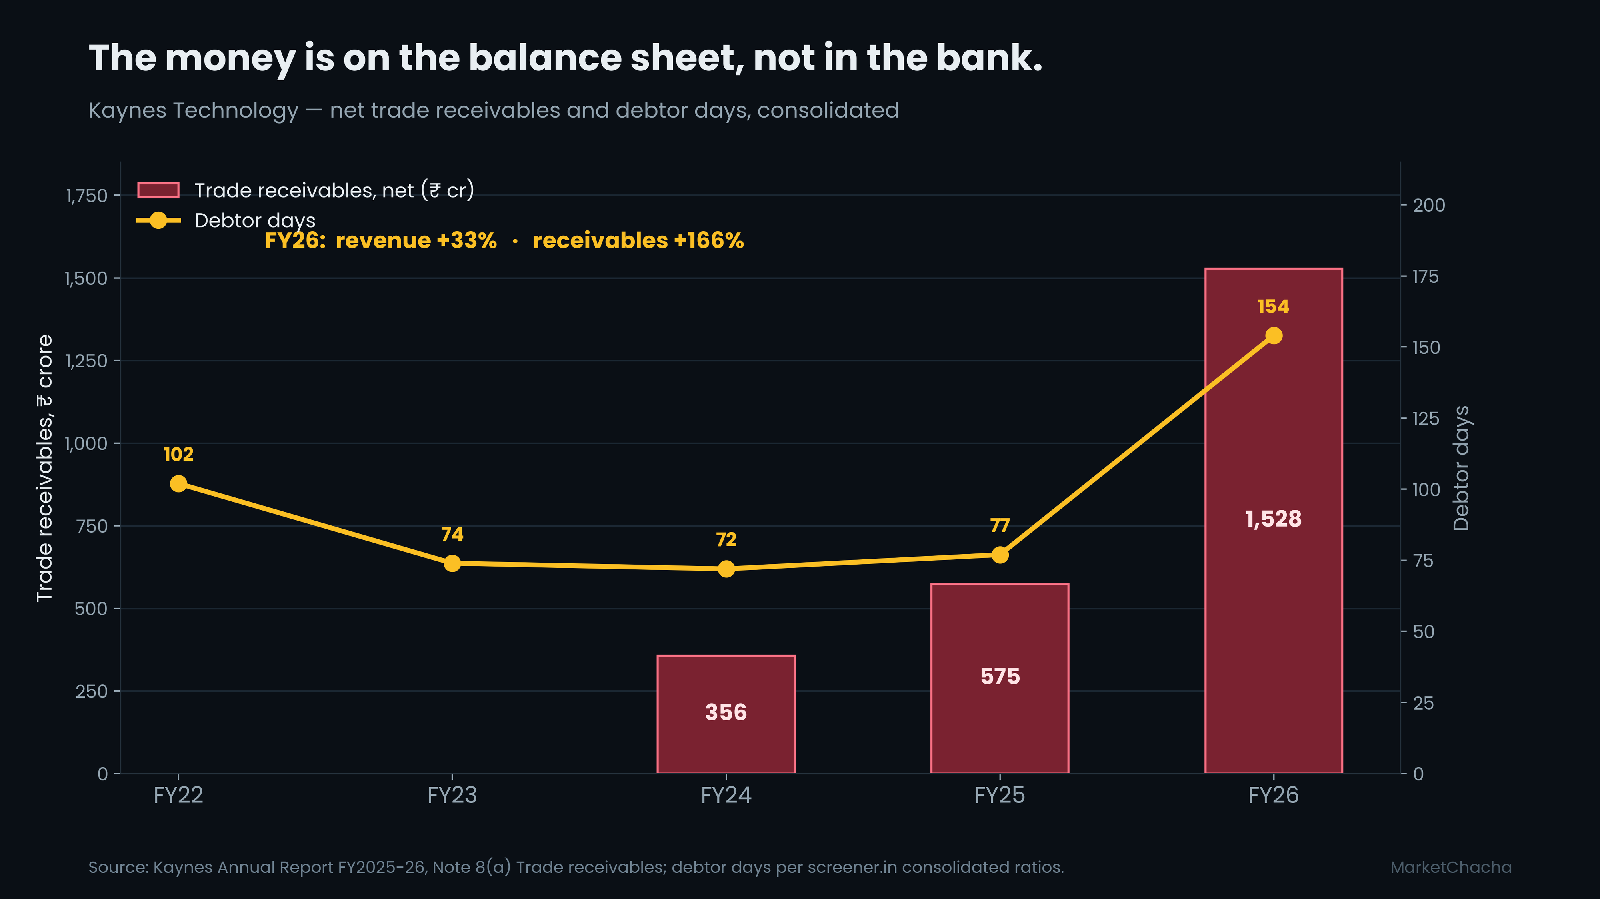
Net trade receivables went from ₹575 crore to ₹1,528 crore — from 21.1% of revenue to 42.1%. Debtor days went from 77 to 154. Gross receivables were ₹1,637 crore. The ageing schedule shows ₹61.2 crore more than three years past due, against ₹42.4 crore a year earlier, and ₹109.7 crore classified as doubtful across all buckets, against ₹42.0 crore — an increase of 161%.
The expected credit loss allowance rose from ₹42.04 crore to ₹109.68 crore. Within that, ₹78.21 crore was charged to the profit and loss account during FY2026 (against ₹19.35 crore in FY2025) and ₹10.57 crore was written off. Receivables are pledged with banks for working capital facilities.
The benign reading, which the company gives and which the filings support, is that this is concentrated rather than general: EMS customers pay, state utility metering customers pay late, and the group is choosing to hold the receivable rather than stop selling — until, in Q1 FY27, it did stop. The uncomfortable reading is simply the arithmetic: the provision charge rose fourfold, the doubtful balance rose 161%, and a company cannot fund a 166% receivable increase out of a 33% revenue increase indefinitely without external capital. Both readings sit on the same page of the same annual report.
Who owns it — and where those owners are registered
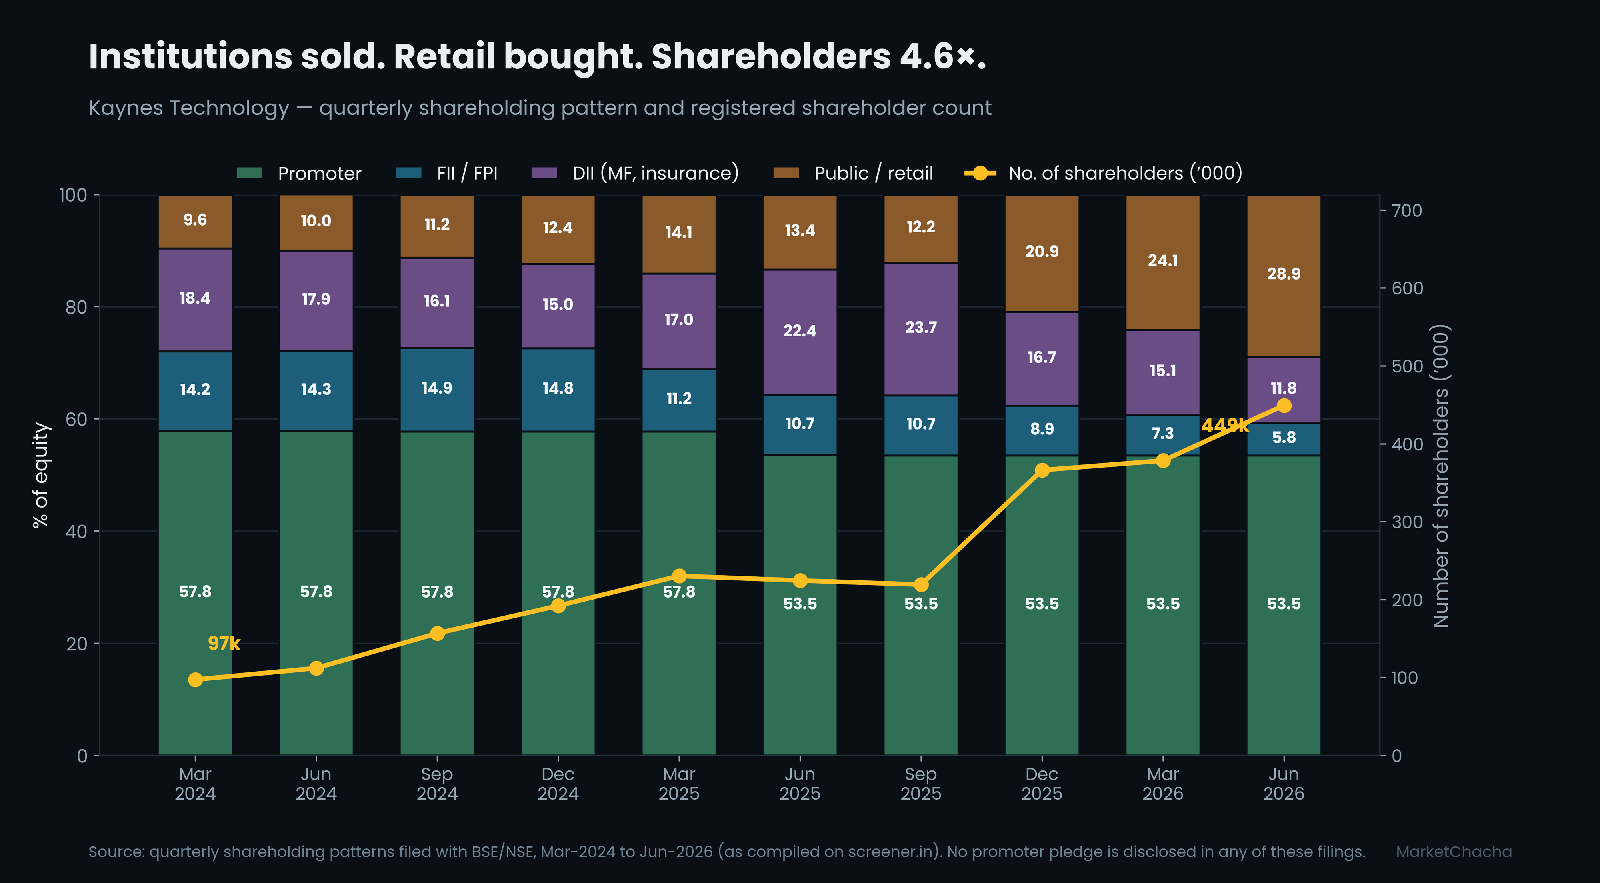
This is the most striking table in the whole file. Between March 2024 and June 2026:
- Foreign portfolio investors went from 14.19% to 5.82%.
- Domestic institutions went from 18.36% to 11.78%, having peaked at 23.66% in September 2025.
- Promoters went from 57.83% to 53.46%.
- Public and retail went from 9.61% to 28.93%.
- Registered shareholders went from 97,423 to 4,49,428 — a 4.6-fold increase.
Institutional holdings fell by roughly 15 percentage points in nine quarters and retail absorbed all of it, while the stock fell 38% over the last twelve months. The distribution schedule at 31 March 2026 shows 3,86,762 holders — 99.24% of all shareholders — owning 500 shares or fewer between them, or 14.57% of the capital. The other 79.6% sits with 169 holders.
On promoters: the shift from 57.75% to 53.46% has two components. On 4 June 2025 Ramesh Kunhikannan sold 11.25 lakh shares — 6.25 lakh on NSE and 5 lakh on BSE — in the ₹5,550.87 to ₹5,553.03 range, for about ₹624.58 crore. That is roughly 1.8 percentage points. The remaining ~2.5 points is arithmetic dilution from the QIP. Promoter share count fell from about 3,70,08,686 to 3,58,38,533, a reduction of about 11.7 lakh shares. No promoter pledge is disclosed in any shareholding pattern filed over this period, and the company confirms no outstanding warrants, GDRs, ADRs or convertible instruments.
The jurisdiction map
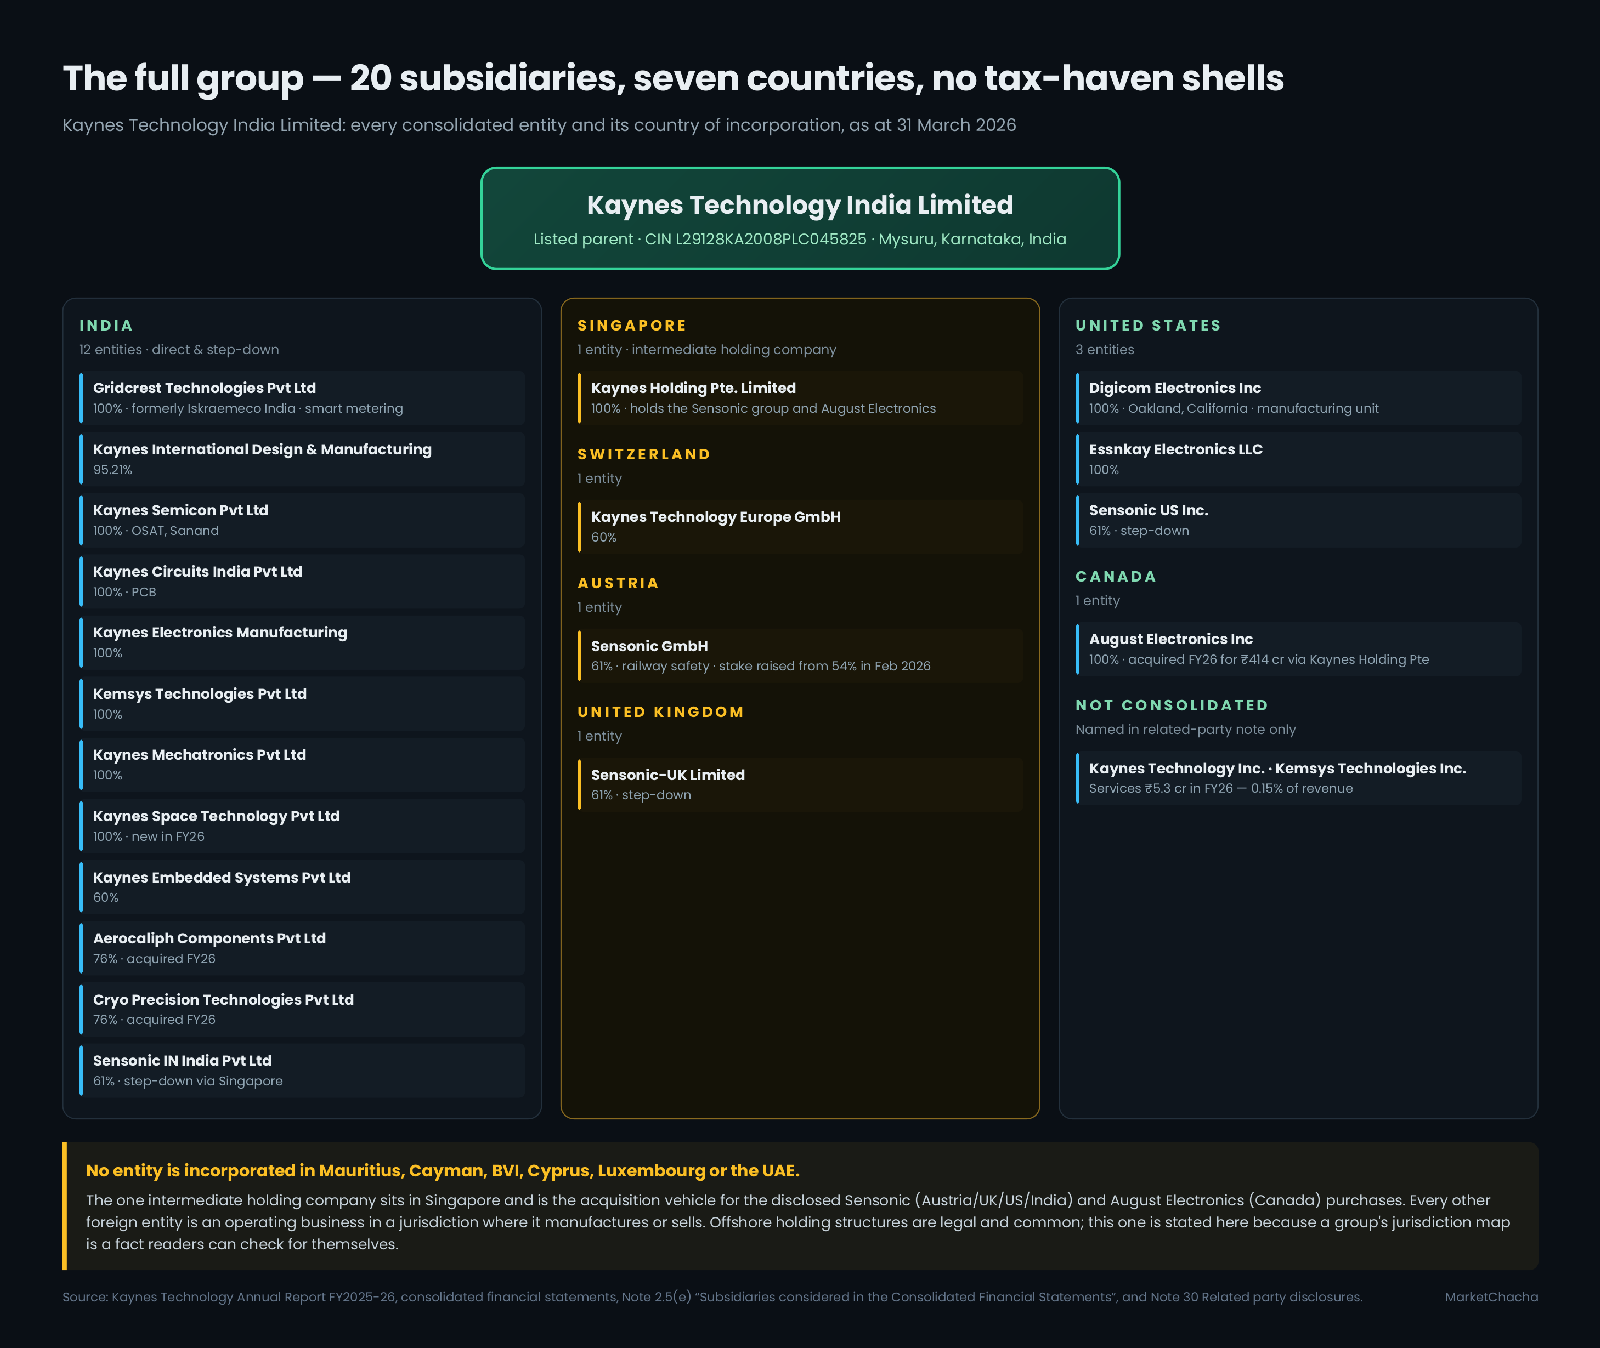
Twenty consolidated subsidiaries across seven countries. Twelve are Indian. One — Kaynes Holding Pte. Limited, Singapore — is an intermediate holding company, and it is the vehicle through which the Sensonic group and August Electronics were bought. Three are in the United States, one each in Switzerland, Austria, the United Kingdom and Canada.
There is no entity in Mauritius, the Cayman Islands, the British Virgin Islands, Cyprus, Luxembourg or the UAE. Offshore holding structures are legal and extremely common in Indian groups, and they are worth checking because the ultimate beneficial owner of such vehicles is often not publicly identifiable. Here, the single non-operating offshore entity sits in Singapore and its purpose — holding two named, disclosed acquisitions — is stated in the accounts. On the FPI side, the shareholding pattern discloses FPI (Corporate) I and II as categories totalling 7.28% at March 2026; no individual foreign portfolio investor is separately disclosed above 1%. A clean, diffuse, largely domestic ownership structure is itself a finding.
Capital history — every time they raised money
| Event | Shares | Price | Raised |
| Bonus issue (EGM 24 Dec 2021) | 11,121 + 17,377 | — | — |
| IPO, listed 22 Nov 2022 | 0.90 cr fresh + 0.56 cr OFS | ₹587 | ₹857.82 cr (₹530 cr fresh) |
| QIP 1 | 57,75,577 | ₹2,424 | ₹1,400 cr |
| QIP 2 (June 2025) | 28,72,788 | ₹5,569.50 | ₹1,600 cr |
QIP 1 was earmarked for the OSAT facility (₹756.7 cr), the PCB facility (₹307.3 cr) and general corporate purposes; ₹1,242 crore of the ₹1,374 crore had been spent by FY26. QIP 2 went to debt repayment (₹841.3 cr), working capital (₹200 cr), inorganic growth (₹122.8 cr of ₹160 cr) and general corporate purposes. The board confirms no deviation in utilisation, and the monitoring agency report for the quarter ended 30 June 2026 reports no material deviation.
Two neutral facts follow from the dates. QIP 2 was priced at ₹5,569.50 in June 2025 and the promoter sold at about ₹5,552 in the same month; the stock closed at ₹3,815 on 20 August 2026, 31% below both. And there have been no preferential allotments to related parties — the two raises were open QIPs to qualified institutional buyers. No dividend has ever been paid.
Who runs it, and the wider web
The board as at 31 March 2026: Savitha Ramesh (Executive Chairperson), Ramesh Kunhikannan (Executive Vice-Chairman), Jairam Paravastu Sampath (Whole-Time Director and CFO), Dr Muthukumar Narayanaswamy (Managing Director), and independent directors S. G. Murali, Alexander Koshy, Heinz Franz Moitzi and Poornima Ranganath.
FY2026 saw a considerable amount of change in that group, all of it disclosed:
- 24 September 2025 — Ramesh Kunhikannan was re-designated from Managing Director to Executive Vice-Chairman; Dr Muthukumar Narayanaswamy was appointed Managing Director.
- 10 November 2025 — Anup Kumar Bhat ceased to be an Independent Director.
- 11 March 2026 — Anuj Mehtha resigned as Company Secretary and Compliance Officer; Sudha Sri Addepalli was appointed.
- 31 May 2026 — Heinz Franz Moitzi ceased to be an Independent Director.
- Two Additional Independent Directors were subsequently appointed.
On auditors: K P Rao & Co (FRN 003135S) signed the FY2026 accounts on 13 May 2026 and complete their tenure at the 18th AGM. The board has proposed Walker Chandiok & Co LLP (FRN 001076N/N500013) for five years from the 18th to the 23rd AGM. This is the mandatory rotation cycle under section 139 of the Companies Act, not a resignation, and the outgoing auditor's report contains no qualification, reservation or adverse remark. Brahmayya & Co are internal auditors.
Related-party transactions outside the consolidated group are small: services of ₹2.93 crore with Kaynes Technology Inc. and ₹2.35 crore with Kemsys Technologies Inc., together 0.15% of revenue. Key managerial personnel remuneration was ₹14.84 crore, 0.41% of revenue.
The regulatory and surveillance record
No SEBI order, settlement or show-cause naming the company, its promoters or its directors was located. The secretarial audit report contains no qualification, reservation or adverse remark, and the statutory auditors reported no matter under section 143(12) of the Companies Act — the fraud-reporting provision.
Exchange surveillance: the stock is not currently in ASM or GSM. It exited long-term ASM on 17 May 2024 and short-term ASM on 17 December 2025.
Credit ratings. The record here is the most substantive item in the file, and it is entirely public:
- ICRA has upgraded steadily: BBB (Jan 2023) → BBB+ (Dec 2023) → A- (Positive) (Nov 2024), reaffirmed at A- (Positive) on 12 December 2025 on ₹216 crore of facilities.
- On 15 December 2025 CRISIL reaffirmed CRISIL A and placed it on "Rating Watch with Developing Implications" on ₹770 crore of bank facilities — all of them cash credit lines, across Federal Bank, HDFC, Axis, SBI, Canara, ICICI and HSBC.
- On 12 March 2026 CRISIL reaffirmed CRISIL A/Stable and removed the rating watch.
The trigger is documented. An independent research report dated 3 December 2025 raised questions about the company; Kaynes issued a disclosure on 5 December and held an analyst call on 8 December; ICRA published an "Update on entity" on 12 December summarising the concerns and the company's responses. Per ICRA, the concerns covered goodwill and intangible-asset treatment after the acquisitions, cash-flow presentation, a high imputed borrowing cost, rising contingent liabilities, working-capital stretch, and disclosure gaps in related-party transactions.
ICRA's own conclusions, which are the useful part: the acquisition accounting "appears consistent with Ind AS 103, with customer contracts recognised as intangible assets rather than goodwill"; the grouping of customer contracts under "technical know-how" "does not indicate a misstatement but warrants improved disclosure"; the missing acquisition line in the consolidated cash flow "stems from the indirect method of reporting". Management acknowledged an "inadvertent omission" in related-party disclosures in the standalone financials. ICRA's summary sentence: "These misses reflect deficiencies in disclosures and internal controls." ICRA viewed management's responses as "analytically consistent while noting areas where enhanced disclosures and stronger compliance measures are needed."
Two related items appear in the FY2026 accounts themselves. The statement of changes in equity carries a "previous year adjustment" of ₹736.73 million against opening other equity — ₹539.81 million reversed out of General Reserve and ₹196.92 million out of retained earnings — which note 41 explains as the FY2025 Sensonic acquisition reserve being reclassified into retained earnings and the foreign currency translation reserve. And the auditors' internal financial controls opinion, while unmodified, carries this sentence verbatim: "However, the existing policies, systems, procedures and internal controls followed by the Company have to be completely and appropriately documented and reconciled." The same report notes that internal-financial-control reports had not been issued by the auditors of three subsidiaries — Cryo Precision Technologies, Aerocaliph Components and Sensonic IN India — as at the date of the principal auditor's report.
NCLT: one matter, ₹6.02 crore, against Gridcrest Technologies, relating to a supplier under the Insolvency and Bankruptcy Code. Tax matters: 11 income-tax cases totalling ₹13.02 crore (FY2018 to FY2022) and 13 indirect-tax cases totalling ₹12.48 crore (FY2019 to FY2024).
Forensic checks — what the accounts show
| Check | What we found | A benign explanation |
| 1. Five-year CFO ÷ PAT | Cumulative CFO −₹634 cr vs PAT +₹977 cr. Ratio −0.65. FY26 alone: −1.65. | A business growing revenue at 50% a year in an inherently working-capital-heavy industry funds that growth on the balance sheet. The gap is fully explained by receivables and inventory, not by unexplained items. |
| 2. Cash pile vs interest earned | Interest income ₹1,011 million on average cash, deposits and investments of ₹11,222 million = implied yield 9.0%. | Consistent with Indian corporate fixed-deposit rates. This check passes cleanly — the cash appears to be real and earning. |
| 3. Implied interest rate on debt | Finance cost ₹1,169 million on average borrowings of ₹8,923 million = 13.1% — high versus prevailing rates. | ICRA states the group discounts bills on a non-recourse basis; the cost is booked in finance costs but the liability appears nowhere on the balance sheet, inflating the apparent rate. Management estimates the true effective cost at about 10%. |
| 4. Receivable and inventory days | Debtor days 77 → 154. Inventory days 156 → 170. Working capital days −7 → 133. | Concentrated in the smart-metering subsidiary selling to state utilities, not spread across the book: EMS collections in Q1 FY27 were ₹847 cr on ₹854 cr billed. Inventory build was a stated deliberate response to 6-8 month component lead times. |
| 5. Related-party transactions | 0.15% of revenue outside the consolidated group. Management acknowledged an inadvertent omission in the FY2025 standalone disclosure. | The quantum is genuinely immaterial. The omission was self-corrected and flagged by ICRA rather than concealed. |
| 6. Promoter holding and pledge | 57.83% → 53.46%. One disclosed sale of ₹624.58 cr on 4 June 2025. No pledge disclosed. | A promoter monetising a small slice near an all-time high after a 10x run is ordinary. The absence of any pledge removes the single most common Indian small-cap risk. |
| 7. Auditor | K P Rao & Co → Walker Chandiok & Co LLP from the 18th AGM. No qualification in five years. IFC opinion carries a documentation caveat. | Mandatory rotation under section 139, not a resignation — and the incoming firm is a large national practice. |
| 8. Subsidiaries and jurisdictions | 20 subsidiaries, 7 countries. One holding company in Singapore. No Mauritius, Cayman, BVI, Cyprus, Luxembourg or UAE entity. | The Singapore entity's purpose — holding two named acquisitions — is disclosed. This check is clean. |
| 9. Dilution | Shares 6.39 cr → 6.70 cr. Two QIPs totalling ₹3,000 cr at ₹2,424 and ₹5,569.50. No preferential allotments to related parties. | Open QIPs to institutions at market-linked prices are the cleanest way to raise equity. The capital is traceable to named plants. |
| 10. Other income as % of PBT | 31.1% in FY26 (28.8% in FY25). In Q1 FY27 it halved year on year and took PAT with it. | It is interest on unutilised IPO and QIP proceeds, which the company itself adjusts for when reporting ROE. Genuinely non-operating, and genuinely disclosed as such. |
| 11. Capex vs depreciation | Capex ₹12,403 million vs D&A ₹1,071 million — 11.6×. Asset turnover 0.59 → 0.53. Capital commitments ₹810 cr. | Building an OSAT plant and a PCB plant from scratch. Asset turnover mechanically falls while plants are pre-revenue; the question is whether it recovers. |
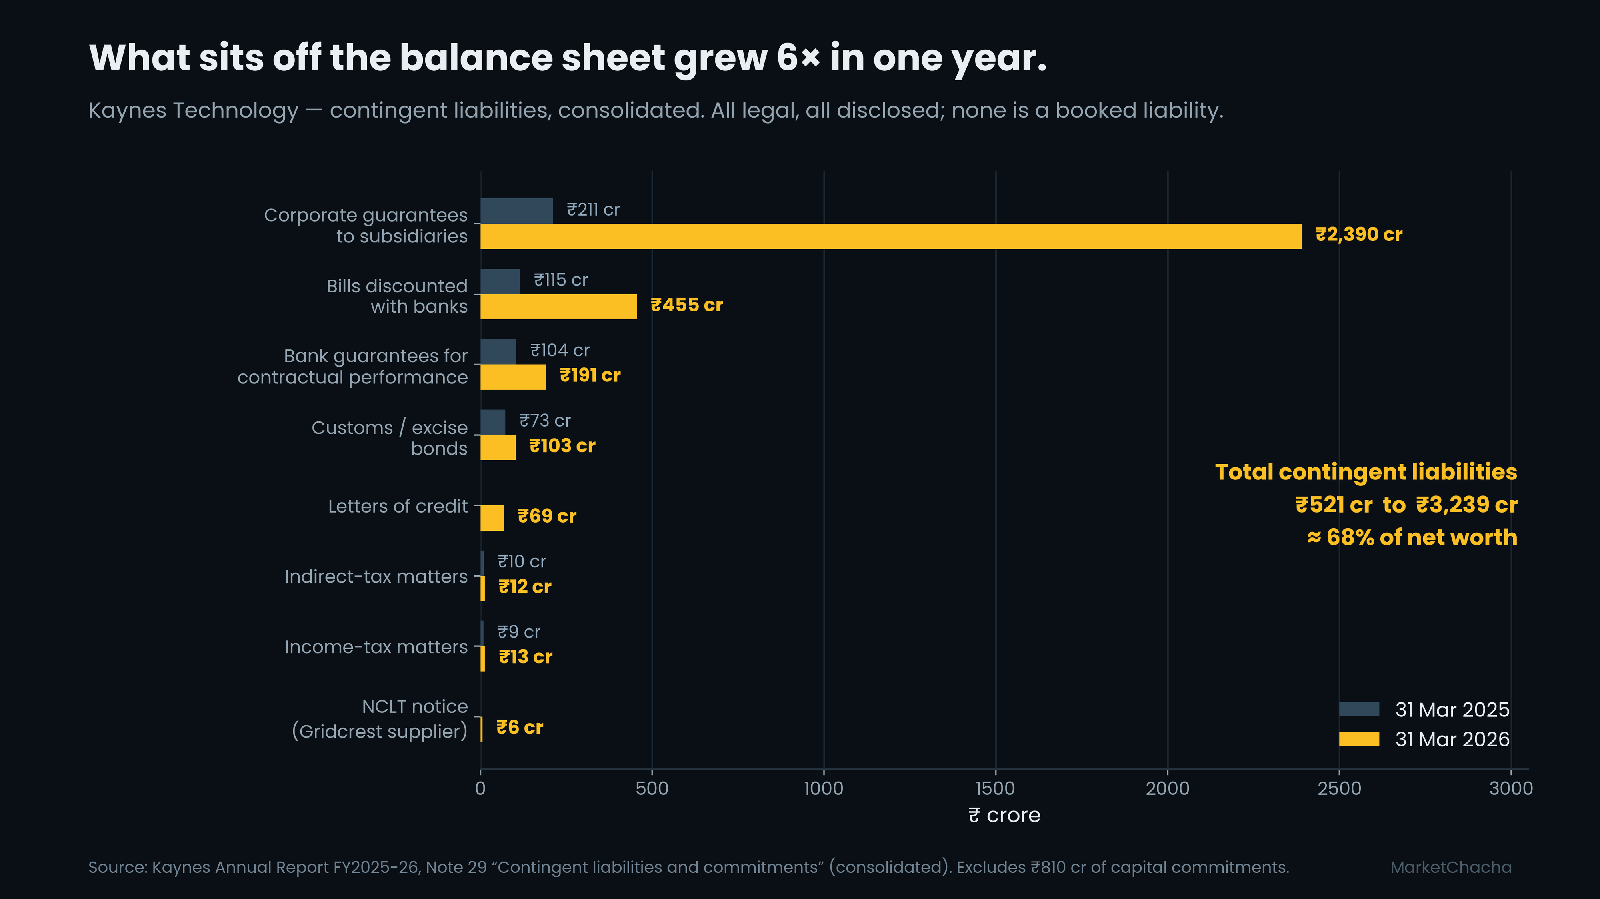
| 12. Contingent liabilities | ₹521 cr → ₹3,239 cr, about 68% of net worth. Corporate guarantees to subsidiaries ₹211 cr → ₹2,390 cr (11.4×). Bills discounted ₹115 cr → ₹455 cr (4×). | Guarantees to wholly-owned subsidiaries are intra-group — the borrowing is largely already consolidated. Bills discounting is a normal working-capital tool and was disclosed. Neither is a booked liability. |
Valuation, for reference only: at ₹3,815 the stock trades at a P/E of 74.1 and 5.39 times book value; peer Dixon Technologies trades at a P/E of 76.4 and 18.8 times book. ROE was 9.64% and ROCE 13.2%. We draw no conclusion from these numbers.
What we could not verify
- Customer identity. Customer A at 23.99% of goods revenue is not named, and the company states the entity may differ between periods.
- Supplier concentration. No named suppliers, no single-source dependency disclosure, no supplier concentration percentage.
- The QIP 1 date. The corporate governance section of the FY2026 annual report dates QIP 1 to FY2024-25, but the statement of changes in equity shows only 1,66,232 shares issued in FY2024-25, and the share count rose by roughly 60 lakh in FY2023-24. On the face of the filings, the ₹1,400 crore allotment sits in FY2023-24. We could not reconcile this from the FY2026 report alone.
- FY2024 operating cash flow. The company's own presentation shows ₹70.1 crore; third-party databases show ₹88 crore. We used the company figure.
- The 3 December 2025 research report. ICRA does not name the firm and we did not obtain the report; everything above is ICRA's characterisation of it and of the company's response.
- Non-recourse bill discounting quantum. By its nature it appears neither as a liability nor as a contingent liability. The ₹455 crore in contingent liabilities is the with-recourse portion only. The total amount of receivables discounted is not disclosed.
- Beneficial ownership of the FPI block. No individual foreign portfolio investor is disclosed above 1%, so the category cannot be broken down further from public filings.
- Directors' other directorships. We did not pull MCA records for each director; the annual report does not tabulate them.
What would change the picture
- The FY2027 half-year cash flow statement. Management has committed to positive operating cash flow by end-FY2027. Q1 was −₹235 crore. Six-month CFO is the single number that settles this.
- The receivables ageing schedule in the FY2027 annual report — specifically the over-three-year bucket and the ECL charge, which quadrupled in FY2026.
- The first audit report signed by Walker Chandiok & Co LLP, and whether the internal-financial-controls documentation caveat persists.
- Gridcrest revenue and collections. The metering business is where the working capital sits; management has already throttled supply once.
- Contingent liabilities at 31 March 2027, particularly corporate guarantees to subsidiaries.
- Quarterly shareholding patterns. FII holding has fallen for six consecutive quarters. Whether that reverses, and whether promoter share count moves again.
- Revenue from the Sanand OSAT plant, which is where ₹756 crore of QIP 1 and the depreciation step-up have gone.
Sources
- Kaynes Technology India Limited — Annual Report FY2025-26 (filed with BSE, 20 August 2026; 321 pages; consolidated and standalone financial statements, auditor's report, corporate governance report, notes 8(a), 13-20, 29, 30, 31, 32, 41, 42)
- Q1 FY27 earnings call transcript, 8 August 2026
- Q1 FY27 investor presentation (three-year P&L, balance sheet and cash flow, pp. 22-24)
- CRISIL rating letter and bank-wise annexure, filed under Regulation 30, 15 December 2025
- ICRA — "Kaynes Technology India Limited: Update on entity", 12 December 2025
- Monitoring agency report on QIP proceeds, quarter ended 30 June 2026
- Kaynes Technology — Annual Report FY2024-25
- IPO prospectus filed with SEBI, November 2022
- IPO terms — price, size, fresh issue vs offer for sale
- screener.in — consolidated financials, ratios and quarterly shareholding patterns
- BSE corporate announcements — Kaynes Technology
- ASM and GSM surveillance history
- Credit rating history — CRISIL, ICRA, CARE, India Ratings
- PTI report on the promoter share sale of 4 June 2025
- Bulk and block deals — NSE and BSE
- NSE quote page — KAYNES
FAQ
How can a company report ₹364 crore of profit and negative ₹600 crore of operating cash in the same year? Profit is recognised when a sale is made; cash arrives when the customer pays. In FY2026 Kaynes' trade receivables rose by ₹1,024 crore and inventory by ₹289 crore. Those two increases exceeded the entire ₹672 crore of operating profit before working capital changes. Nothing about that is unusual accounting — it is the standard indirect-method cash flow statement, disclosed on page 285 of the annual report.
Is the receivable problem spread across all customers? On management's own account, no. In the June 2026 quarter EMS billed ₹854 crore and collected ₹847 crore, while the smart-metering subsidiary billed ₹240 crore and collected ₹88 crore. The company stopped production and supply in metering as a result, and said ₹200 crore arrived in early July.
Why did CRISIL put the rating on watch and then take it off? CRISIL reaffirmed CRISIL A and placed it on Rating Watch with Developing Implications on 15 December 2025, twelve days after an independent research report raised questions about the accounts. On 12 March 2026 it reaffirmed CRISIL A/Stable and removed the watch. ICRA, which reviewed the same questions, concluded the acquisition accounting was consistent with Ind AS 103 but that the episode reflected "deficiencies in disclosures and internal controls".
Is there any promoter pledge? No pledge is disclosed in any shareholding pattern filed between March 2024 and June 2026. Trade receivables are pledged to banks for working-capital facilities, which is a different thing entirely and is standard practice.
Does the group use offshore tax-haven structures? Not on the evidence of the accounts. Twenty subsidiaries across India, Singapore, the United States, Switzerland, Austria, the United Kingdom and Canada. The single non-operating holding entity is in Singapore and holds two named, disclosed acquisitions. No Mauritius, Cayman, BVI, Cyprus, Luxembourg or UAE entity appears.
Why did Q1 FY27 profit fall when revenue rose 40%? Depreciation more than doubled year on year as the new plants came on the books, the effective tax rate went from 22% to 36%, and other income halved as the deposit balance shrank. Operating profit itself rose 31%. The decline is almost entirely below the EBITDA line.
Independent research for education and discussion only. Not investment advice, not a recommendation, and not a rating — we issue no buy/sell calls and no target prices. Every figure is sourced from the primary documents linked above; figures can be restated and we can make mistakes, so always verify against the original. Nothing here alleges wrongdoing by any company or individual: where a fact raises a question we state the fact, cite it, and give the benign explanation alongside. Offshore holding structures, pledging and preferential allotments are all legal and common — they are disclosed here as facts, not as accusations.
This article is for educational and informational purposes only. It is not financial advice, investment recommendation, or a solicitation to buy or sell securities. Investing involves significant risks. I am not a SEBI-registered investment advisor. Readers should consult their own financial advisor and conduct their own research before making any investment decisions.
Comments
Join the conversation
Sign in to join the conversation.
Follow replies, add your view, and take part in the discussion.
Sign in to commentLoading comments...