

Palantir (PLTR): the full file — the numbers, the owners, and what the filings actually show
Palantir Technologies builds software platforms — Gotham, Foundry, Apollo, and the newer Artificial Intelligence Platform (AIP) — that sit as an operating layer on top of an organisation's data, and it makes money by selling multi-year subscriptions to two kinds of customer: governments (defence, intelligence, health agencies) and large commercial enterprises. What the record shows is a company that spent its first eighteen years losing money, turned GAAP-profitable in 2023, and by the year ended December 31, 2025 was compounding revenue in the mid-50s percent while generating more than $2 billion of operating cash — all while three founders retain up to 49.999% of the vote from a share class that represents a tiny fraction of the economics. This is the full file: what the filings actually say, with a link to each one.
Origin — the company's birth certificate
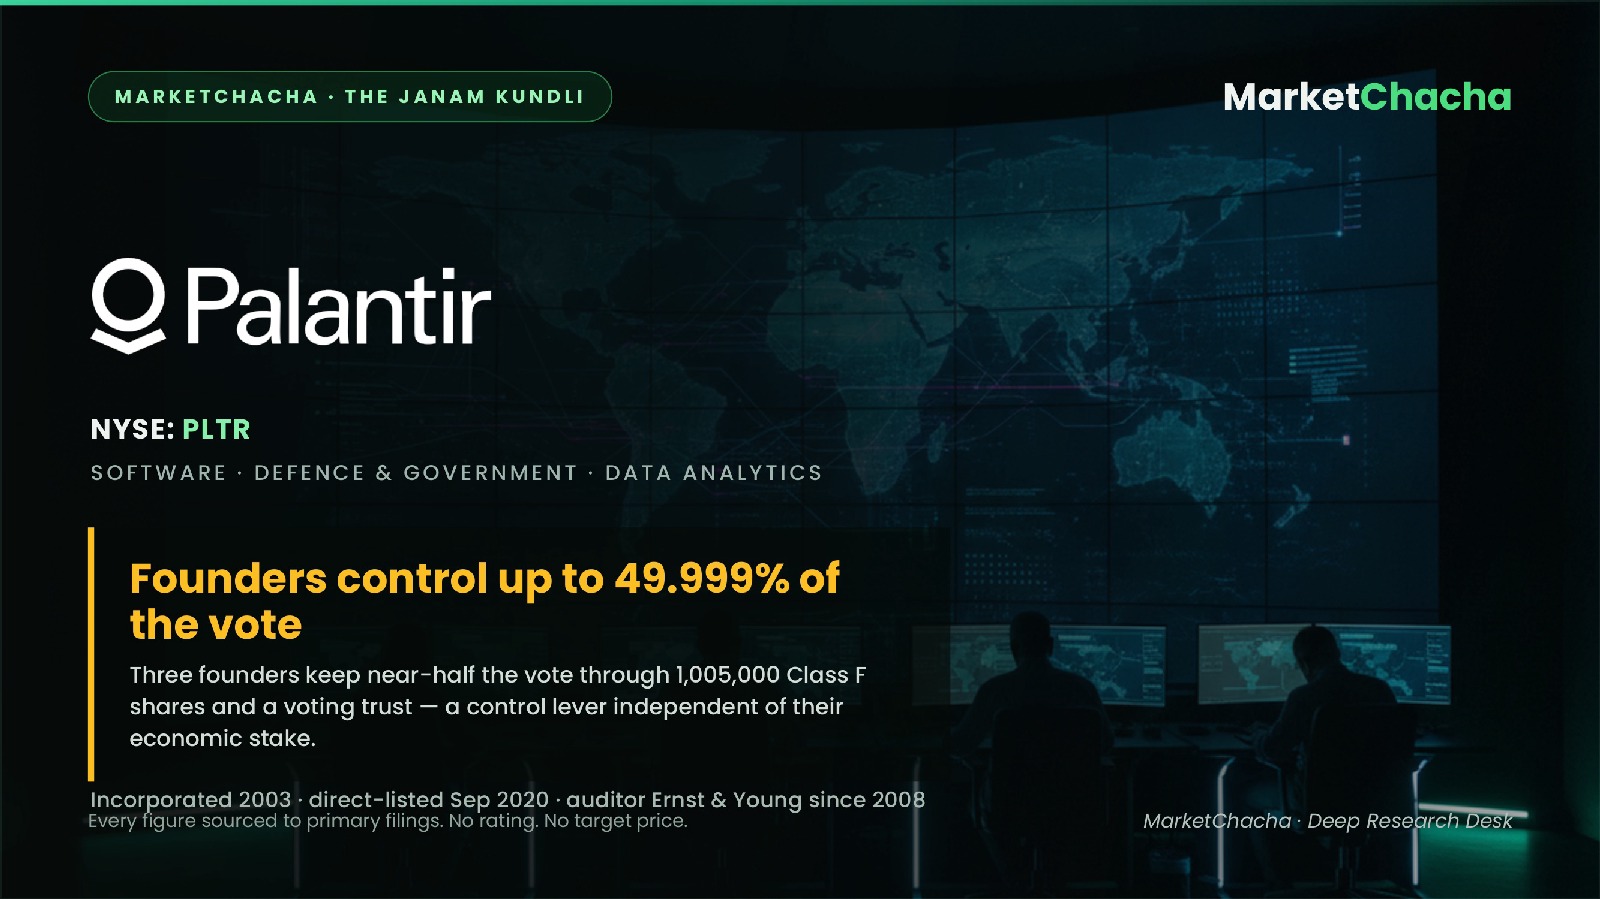
Palantir Technologies Inc. was incorporated in Delaware on May 6, 2003 (Note 1, FY2025 10-K). It was co-founded by Peter Thiel (chairman), Alexander Karp (CEO), and Stephen Cohen (president and secretary); Karp and Cohen have served since the mid-2000s, Thiel since inception. The company's early funding famously included the CIA's venture arm, In-Q-Tel, and its first product, Gotham, was built for the U.S. defence and intelligence community. For most of its private life Palantir was a heavily loss-making, secretive government-software house. It came to the public market on September 30, 2020 not through a conventional IPO but through a direct listing on the NYSE under ticker PLTR; the exchange set a reference price of $7.25 the evening before, valuing the company near $16 billion on a fully diluted basis, and the shares opened close to $10 (CNBC, Sept 29–30, 2020). The head office, historically Palo Alto and then Denver, Colorado, is now listed as Aventura, Florida (10-K cover).
The business — what they actually sell
Palantir sells software, not hardware, and the gross margins reflect that: cost of revenue was $789.2 million on $4,475.4 million of 2025 revenue, an 82.4% gross margin. The company reports along two lines. Government revenue was $2,402.3 million in 2025 (about 54% of the total); Commercial revenue was $2,073.2 million (about 46%). Both segments now run at a 66% contribution margin, up from roughly 59–60% in 2023. The centre of gravity has shifted: U.S. commercial — enterprises adopting AIP — is the fastest-growing part of the business, even as government (the U.S. Army, the broader defence apparatus, and allied governments) remains the single largest bloc. Geographically, 74% of 2025 revenue came from the United States and 26% from abroad (10-K, MD&A). Contract liabilities (mostly deferred revenue — cash customers have already paid) stood at $812.3 million at year-end, up from $566.4 million.
Who actually buys from them
Palantir's customer base is concentrated but has been broadening. The 10-K states that the company's top three customers together accounted for 16% of 2025 revenue (17% in 2024), and that those three have been customers for an average of about ten years. Crucially, the notes disclose that no single customer represented 10% or more of total revenue in 2023, 2024 or 2025, and no customer was more than 10% of accounts receivable. The average trailing-twelve-month revenue from the top twenty customers rose to $93.9 million in 2025 from $64.6 million in 2024 — the company's own evidence that its largest relationships are deepening. The dependency to keep in view is structural rather than single-name: a large slice of revenue comes from government budgets and contract awards, which can be delayed, cut, or subject to procurement rules, and many commercial contracts allow termination for convenience on less than twelve months' notice (10-K, Contract Liabilities note).
Where it is actually made — plants & supply chain
There is no factory to inspect. Palantir is a software company; its "production" is engineering labour and cloud infrastructure. It has no fabs, no plants, and negligible capital assets — capital expenditure was just $33.9 million in 2025 on a balance sheet of $8.9 billion, and property and equipment is a rounding error against roughly $7.2 billion of cash and marketable securities. The relevant "supply chain" is therefore third-party cloud and compute (the platforms run on hyperscaler infrastructure), and the key inputs are engineers and forward-deployed staff. What is not disclosed at line-item level is the split of hosting costs by provider or the concentration of its cloud spend; the 10-K discusses reliance on third-party infrastructure as a risk factor without quantifying it.
Five years of numbers
The trajectory is unusually clean to read because the inflection is so sharp. Revenue roughly quadrupled from 2020 to 2025; the company crossed into GAAP profit in 2023 and then saw margins expand fast.
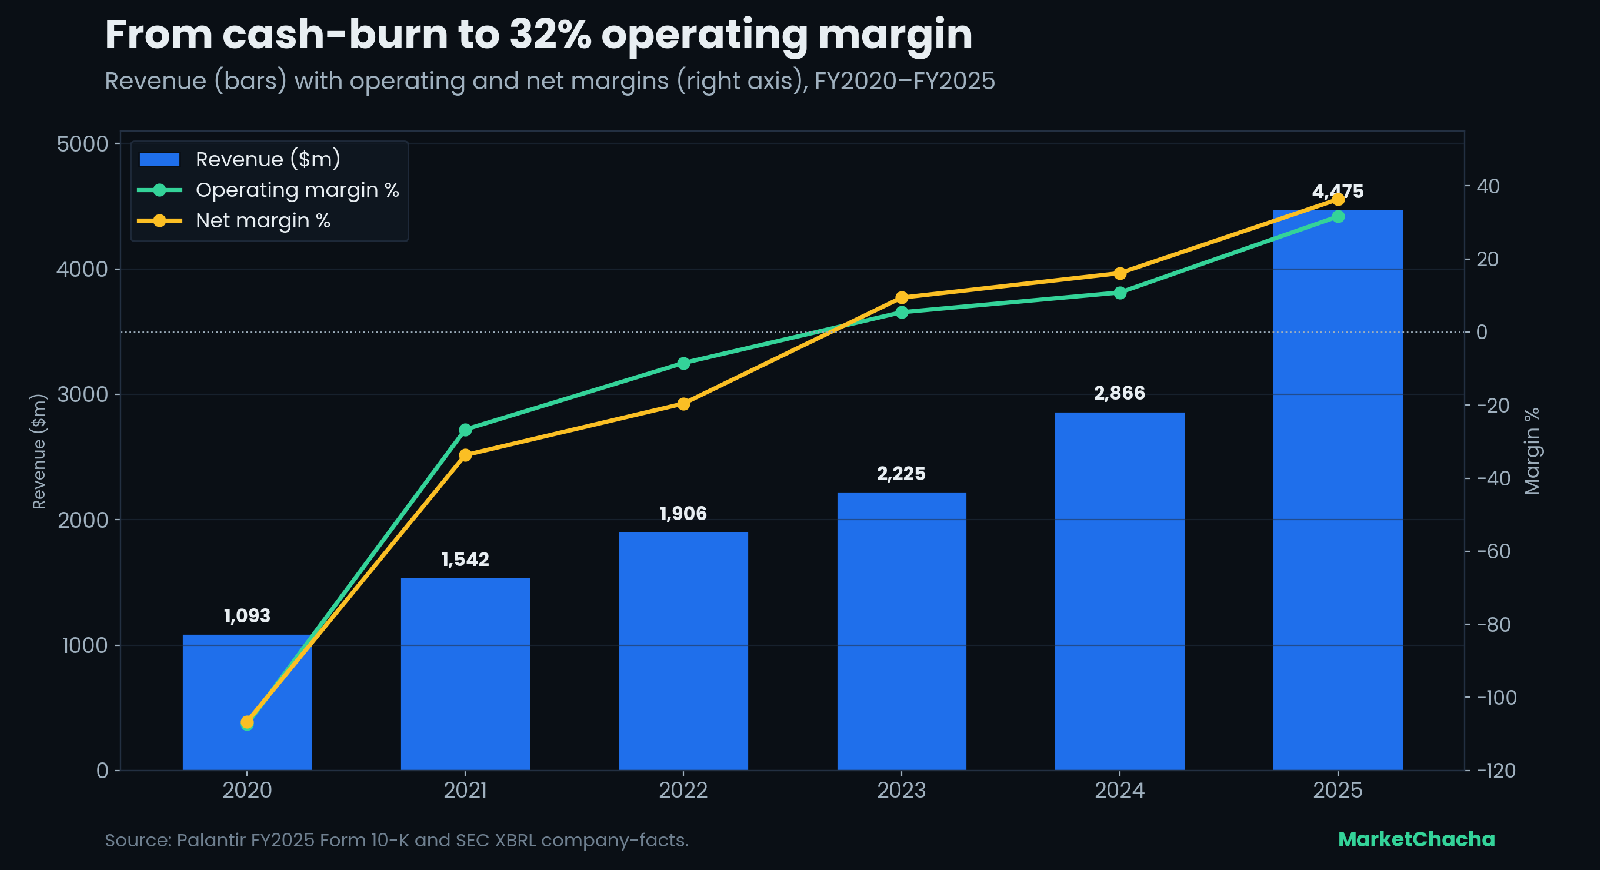
| Year ($m) | Revenue | Operating income | Net income | Operating cash flow | Stock-based comp |
|---|---|---|---|---|---|
| 2020 | 1,092.7 | (1,173.7) | (1,166.4) | (296.6) | 1,270.7 |
| 2021 | 1,541.9 | (411.0) | (520.4) | 333.9 | 778.2 |
| 2022 | 1,905.9 | (161.2) | (373.7) | 223.7 | 564.8 |
| 2023 | 2,225.0 | 120.0 | 209.8 | 712.2 | 475.9 |
| 2024 | 2,865.5 | 310.4 | 462.2 | 1,153.9 | 691.6 |
| 2025 | 4,475.4 | 1,414.0 | 1,625.0 | 2,134.5 | 684.0 |
Source: Palantir FY2025 Form 10-K and SEC XBRL company-facts. Figures in $ millions.
Revenue compounded at roughly 33% a year over 2020–2025; operating cash flow compounded even faster off a small base. On the share price, from the $7.25 direct-listing reference to about $130.80 in late July 2026, the stock is up roughly 18-fold (about a 64% annualised gain); measured from the first-day close near $9.50 it is up about 13.8-fold. That price performance has run ahead of even this revenue trajectory — the market capitalisation sits near $300 billion — which is itself a fact readers should weigh, though we assign no view to it.
Financial statements — FY2025 vs FY2024
| Income statement ($m) | FY2024 | FY2025 | Δ | Δ% |
|---|---|---|---|---|
| Revenue | 2,865.5 | 4,475.4 | +1,609.9 | +56.2% |
| Cost of revenue | 566.0 | 789.2 | +223.2 | +39.4% |
| Gross profit | 2,299.5 | 3,686.3 | +1,386.8 | +60.3% |
| Gross margin | 80.2% | 82.4% | +2.2pt | — |
| Research & development | 507.9 | 557.7 | +49.8 | +9.8% |
| Stock-based compensation (in opex) | 691.6 | 684.0 | (7.6) | −1.1% |
| Operating income | 310.4 | 1,414.0 | +1,103.6 | +355.5% |
| Operating margin | 10.8% | 31.6% | +20.8pt | — |
| Interest & investment income | 196.8 | 229.2 | +32.4 | +16.5% |
| Pre-tax income | 483.4 | 1,647.8 | +1,164.3 | +240.8% |
| Income tax | 21.3 | 22.7 | +1.5 | +6.9% |
| Net income | 462.2 | 1,625.0 | +1,162.8 | +251.6% |
| Net margin | 16.1% | 36.3% | +20.2pt | — |
| Diluted EPS | $0.19 | $0.63 | +$0.44 | +231.6% |
| Balance sheet ($m) | FY2024 | FY2025 | Δ% |
|---|---|---|---|
| Cash & equivalents | 2,098.5 | 1,423.8 | −32.2% |
| Marketable securities | 3,131.5 | 5,753.2 | +83.7% |
| Accounts receivable, net | 575.0 | 1,042.1 | +81.2% |
| Total assets | 6,340.9 | 8,900.4 | +40.4% |
| Deferred revenue (contract liabilities) | 566.4 | 812.3 | +43.4% |
| Total liabilities | 1,246.5 | 1,412.4 | +13.3% |
| Total stockholders' equity | 5,003.3 | 7,387.3 | +47.6% |
| Cash flow ($m) | FY2024 | FY2025 | Δ% |
|---|---|---|---|
| Operating cash flow (CFO) | 1,153.9 | 2,134.5 | +85.0% |
| Investing cash flow (CFI) | (340.7) | (2,783.6) | n/m |
| Financing cash flow (CFF) | 463.4 | (26.9) | n/m |
| Capital expenditure | 12.6 | 33.9 | +168.2% |
| Free cash flow (CFO − capex) | 1,141.2 | 2,100.6 | +84.1% |
Source: Palantir FY2025 Form 10-K, filed Feb 17, 2026.
What moved, and how clean it is. The 2025 step-change is overwhelmingly operating: revenue rose 56%, gross profit rose 60%, and because operating expenses grew far more slowly, operating income more than quadrupled to $1.41 billion and the operating margin jumped from 11% to 32%. Of the $1,647.8 million pre-tax profit, about 86% came from operations; interest and investment income on the cash pile supplied the remaining ~15%. Two lines deserve a flag on earnings quality. First, the effective tax rate was 1.4% — the company still shields nearly all of its profit with net-operating-loss carryforwards accumulated over its loss-making years; a normalised tax rate would materially reduce reported net income, so GAAP net income currently flatters the underlying, fully-taxed earnings power. Second, the big −32% swing in cash and the large negative investing cash flow are not a cash drain: the company simply moved money out of "cash" into "marketable securities" (up $2.6 billion), so the two lines net to a growing, not shrinking, treasury. On the balance sheet, the line that grew fastest relative to revenue was accounts receivable (+81%), addressed in the forensic section below.
The latest quarter, decoded
The most recent reported period is the quarter ended March 31, 2026 (Q1 FY2026, 10-Q filed May 5, 2026). Second-quarter numbers are not yet filed.
| ($m) | Q1 2025 | Q4 2025 | Q1 2026 | QoQ | YoY |
|---|---|---|---|---|---|
| Revenue | 883.9 | 1,406.8 | 1,632.6 | +16.0% | +84.7% |
| Operating income | 176.0 | — | 754.0 | — | +328.3% |
| Net income | 214.0 | 608.7 | 870.5 | +43.0% | +306.7% |
| Stock-based comp | 155.3 | — | 201.6 | — | +29.8% |
Source: Palantir Q1 2026 Form 10-Q and SEC XBRL. Q4 2025 net income derived as FY2025 less the first three reported quarters.
Revenue growth accelerated to nearly 85% year-on-year — a faster rate than the full-year 2025 figure — with operating income up more than fourfold. The quality caveat is in the below-the-line detail: of the $888.6 million pre-tax profit, operating income was $754.0 million (about 85%), while interest income ($66.4 million) and "other income, net" ($68.2 million) together contributed roughly 15%. That "other income" line is notably larger than in prior quarters (it was a small negative a year earlier), so a meaningful chunk of the quarter's headline beat sits in non-operating items; and, as with the full year, tax was near-zero (1.4%). None of that contradicts the operating strength — it simply means the reported net-income growth rate overstates the operating growth rate.
Who owns it — and where those owners are registered
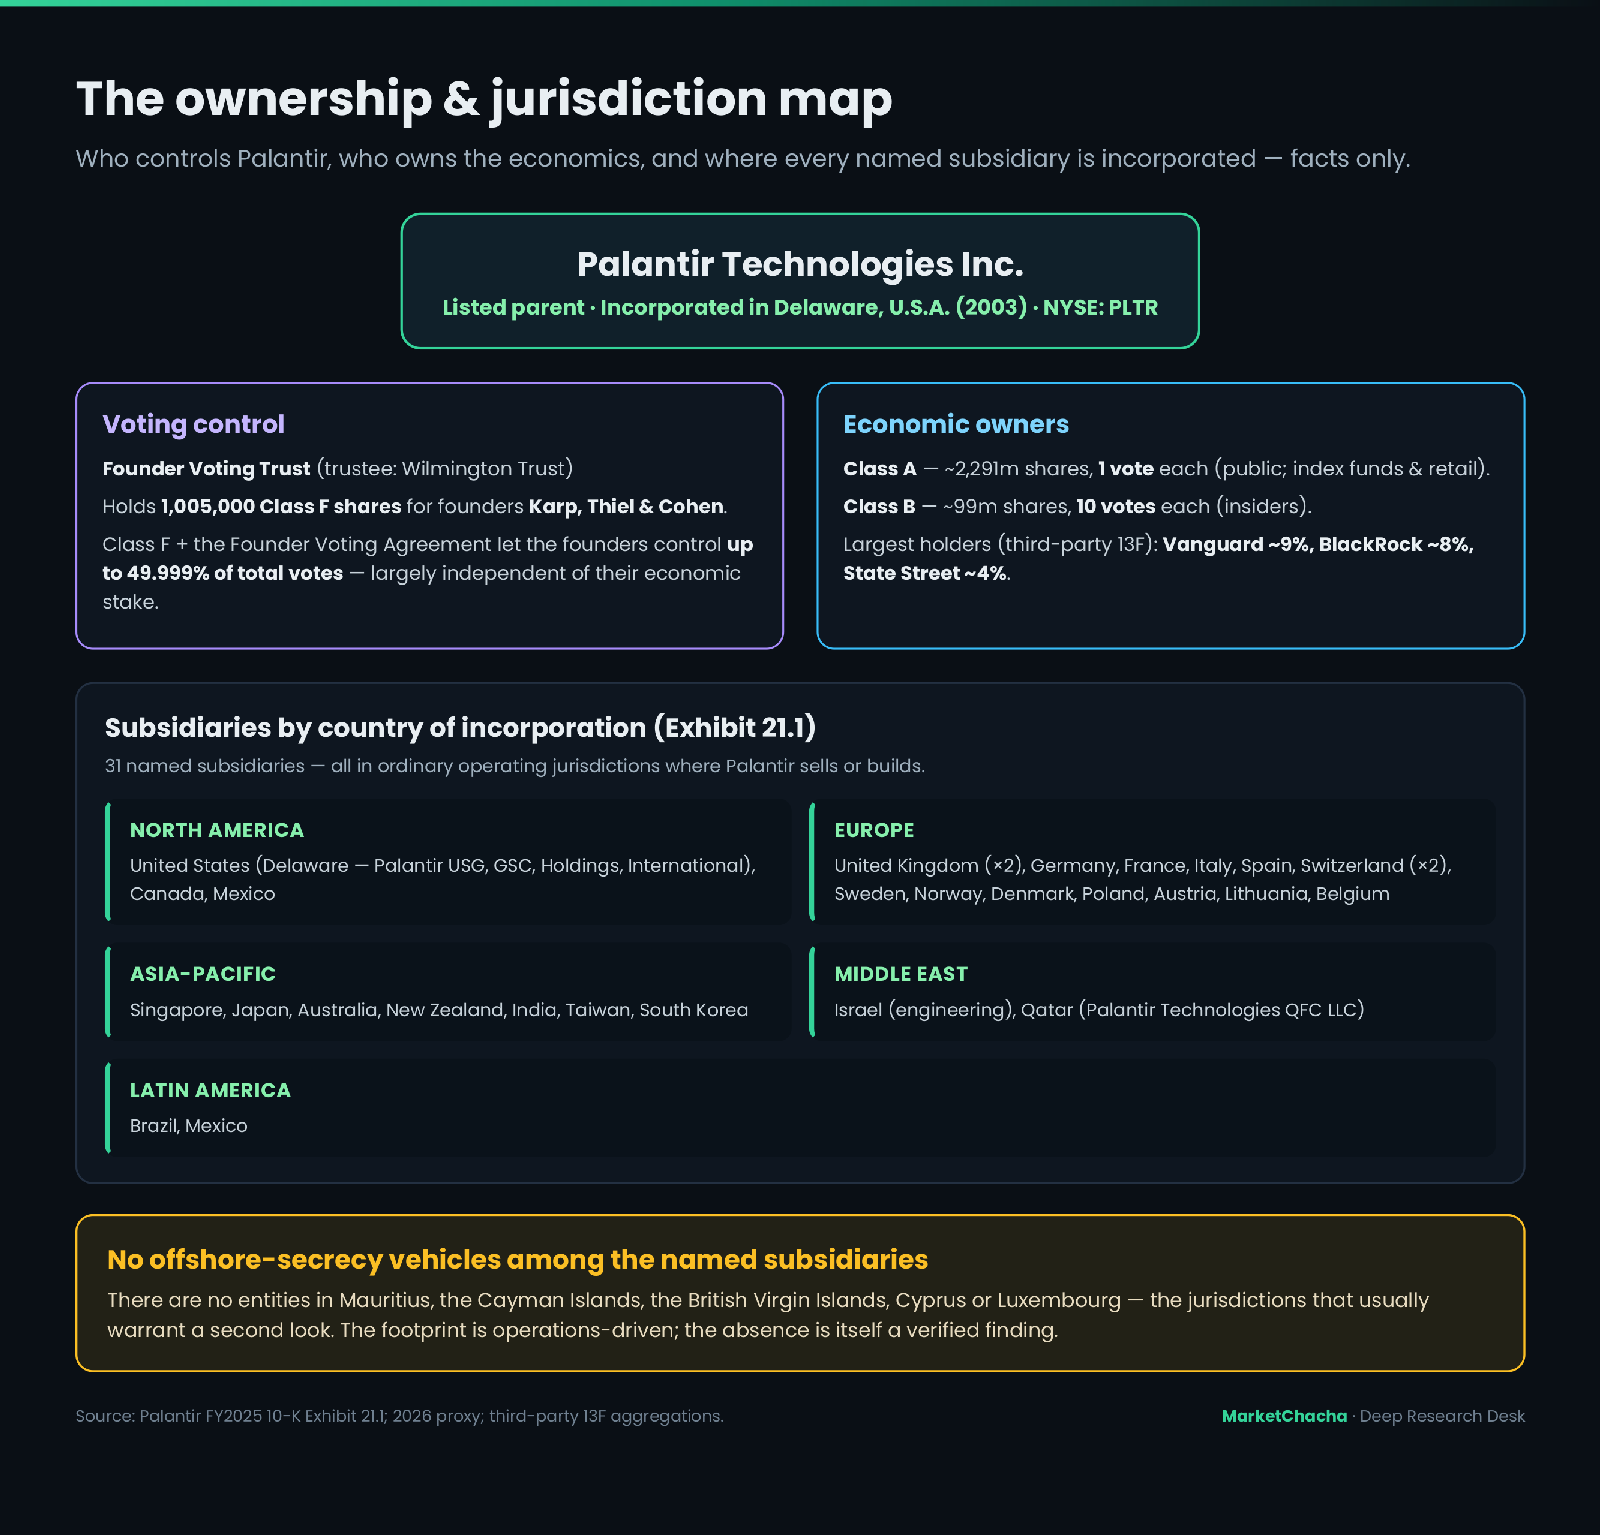
This is the most distinctive part of Palantir's file. The company has a three-class share structure. As of February 10, 2026 there were about 2,291.5 million Class A shares (one vote each, publicly traded), 99.2 million Class B shares (ten votes each, held by insiders), and just 1,005,000 Class F shares. The Class F shares are held in a Founder Voting Trust (trustee: Wilmington Trust) and are engineered so that, together with the founders' other holdings and the Founder Voting Agreement, Stephen Cohen, Alexander Karp and Peter Thiel can control up to 49.999999% of the total voting power of the company (10-K; 2026 proxy). At the record date the aggregate Class A + Class B voting power was about 3.30 billion votes, of which founder-affiliated shares under the voting agreement represented roughly 931 million, with Class F topping the founders up toward the ~50% ceiling. In plain terms: the founders own a small fraction of the economics but hold a near-controlling share of the vote. That is legal and fully disclosed; it is material because it means public shareholders, who own the overwhelming majority of the economic value, have limited ability to change control, the board, or governance.
On the economic side, ownership is dominated by index funds and retail. Third-party 13F aggregations put the largest institutional holders as Vanguard (~9%), BlackRock (~8% plus additional funds), and State Street (~4%), with the big index complexes plus Geode and Morgan Stanley together holding roughly a quarter of the shares; the same trackers estimate institutions at ~45%, retail at ~51%, and insiders at ~4% of shares (Fintel/HedgeFollow, 2026 — third-party estimates, not filings). Insider activity has been one-directional: selling. CEO Alexander Karp realised on the order of $2 billion from stock sales across 2024 (Fortune, Feb 2025), and founders and executives continued to sell through 2025–2026 — Peter Thiel adopting a plan to sell about 2 million shares (~$280 million) and Stephen Cohen selling tens of millions (Yahoo Finance/Bloomberg). Substantially all of these sales are executed under pre-arranged Rule 10b5-1 trading plans, which set the schedule in advance; heavy, plan-based founder selling is common at founder-led companies whose shares have risen sharply, and it is a fact to note rather than to interpret.
On the jurisdiction chain — the part of an ownership map where offshore vehicles usually appear — Palantir's Exhibit 21 is notably plain. Its named subsidiaries sit in Delaware and ordinary operating markets: Switzerland, Italy, Singapore, New Zealand, Australia, Germany, Canada, Japan, Israel, Sweden, Mexico, Brazil, Spain, France, Poland, Denmark, Norway, the UK, India, Taiwan, Qatar, Austria, South Korea, Lithuania and Belgium. There are no entities in Mauritius, the Cayman Islands, the British Virgin Islands, Cyprus or Luxembourg — the jurisdictions that usually warrant a second look. The one financial-centre entity, Palantir Technologies QFC LLC in Qatar, aligns with the company's Gulf government business, and the Singapore entity is a routine Asia-Pacific base. This is a clean, operations-driven international footprint, and its cleanliness is itself a finding.
Capital history — every time they raised money
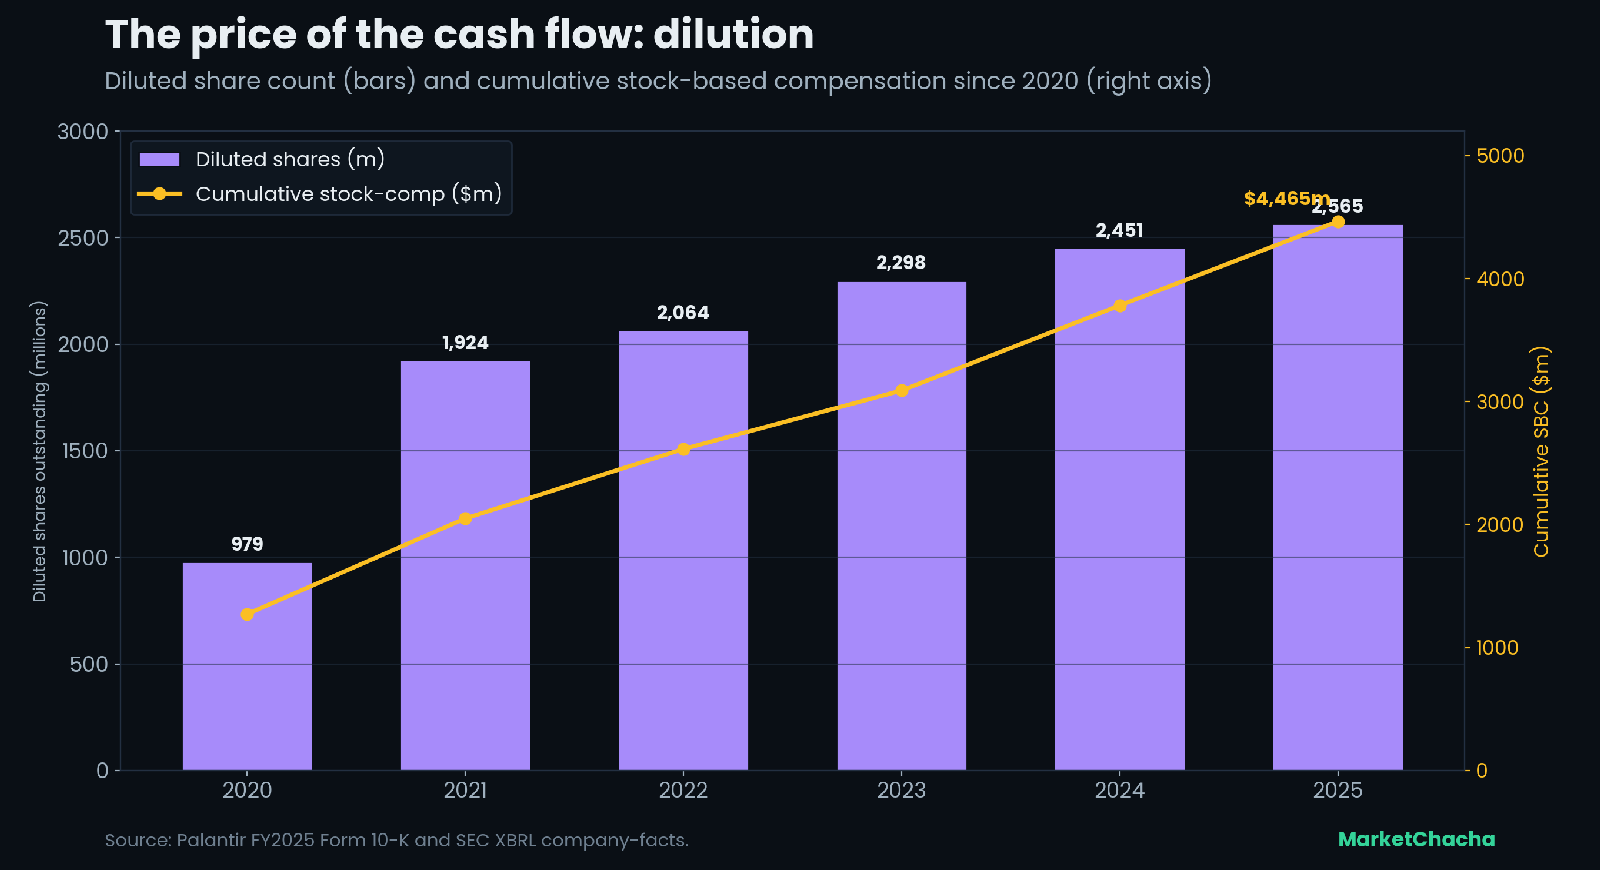
Palantir raised extensively as a private company (multiple venture rounds from the mid-2000s onward), then reached the public market via direct listing in September 2020 — a mechanism that let existing holders sell without the company issuing new primary shares or using traditional underwriters. Since listing there have been no rights issues or bonus/split events. The ongoing "capital events" are almost entirely equity compensation: diluted share count rose from about 979 million (2020) to 2,565 million (2025), roughly 2.6× (much of the initial jump reflects the direct-listing year); measured from 2021 to 2025 the count grew about 33%. Cumulative stock-based compensation over 2021–2025 was about $3.19 billion — larger than the company's cumulative GAAP net income over the same window. At year-end 2025 there were still options outstanding to purchase roughly 22.0 million Class A, 130.2 million Class B and 18.2 million Class F shares, plus unvested RSUs, all of which represent future dilution. Against that, the board authorised a $1.0 billion share-repurchase programme in August 2023, but actual buybacks have been modest — about $64 million in 2024 and $75 million in 2025 — so repurchases have offset only a small share of the compensation-driven issuance to date.
Who runs it, and the wider web
The board is small — seven directors. The three founders hold the executive chairs: Alexander Karp (CEO), Peter Thiel (chairman), and Stephen Cohen (president and secretary). The four non-founder directors are Alexander Moore (2020), Alexandra Schiff (2020), Lauren Friedman Stat (2021) and Eric Woersching (2022); the audit committee is composed of the independent directors. Key officers include CFO David Glazer and CTO Shyam Sankar. On related parties, the proxy discloses ordinary-course commercial dealings tied to chairman Peter Thiel's venture holdings: in 2025 Palantir received $17.66 million from Anduril Industries and $167,782 from Memoir/Chapter — companies in which Thiel may be deemed a >10% owner — and invested $40 million in Anduril's Series G preferred (a sub-1% stake). The company states Thiel has no material interest in these transactions; in scale, the Anduril revenue is about 0.4% of total revenue. The auditor is Ernst & Young LLP, which has served since 2008 — no auditor change or resignation in the company's public history — and it issued an unqualified opinion on both the FY2025 financial statements and internal controls (dated Feb 17, 2026). Audit fees were $6.61 million with negligible non-audit fees.
The structure and jurisdiction map
The regulatory and surveillance record
As a U.S.-listed company Palantir is not subject to Indian exchange surveillance measures (ASM/GSM) or credit-rating "issuer not cooperating" notices. On the U.S. side, the FY2025 10-K's Legal Proceedings section does not disclose any material pending litigation of the SEC-order or restatement type, and there is no Form 8-K Item 4.01 auditor-dismissal event in the record (E&Y has been continuous since 2008). The company carries essentially no funded debt: its only facility is a $500 million revolving credit line, entirely undrawn, maturing March 2027. The genuine regulatory exposures it discloses are of the operating kind — dependence on U.S. government budgets and contract awards, export-control and data-protection regimes across the many countries it operates in, and the ordinary risk of contract terminations — rather than any regulator action against the company or its officers that we could verify.
Forensic checks — what the accounts show
| Check | What we found | Source | A benign explanation |
|---|---|---|---|
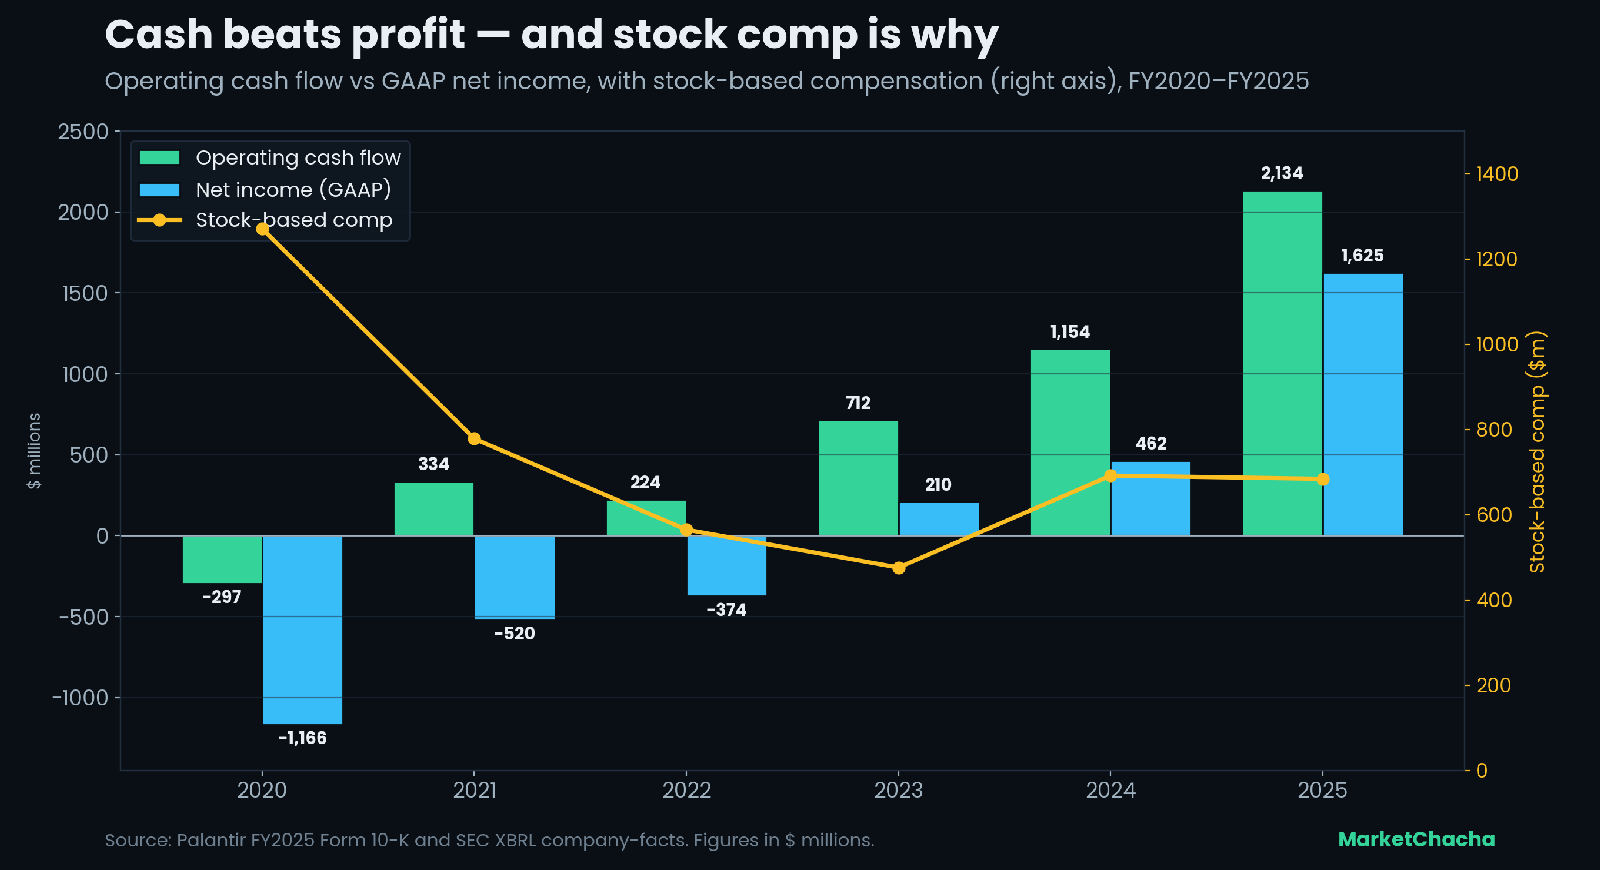
| 5-yr cumulative CFO ÷ net income (2021–25) | CFO $4,558m vs net income $1,403m → ratio ≈ 3.25. Reported profit converts to more than 100% cash. | 10-K / XBRL | High-margin software with prepaying customers (deferred revenue) and large non-cash stock comp added back → CFO structurally exceeds GAAP profit; the opposite of the classic "profit without cash" flag. |
| Stock comp vs profit | Cumulative SBC 2021–25 ≈ $3,195m — larger than cumulative net income of $1,403m. Still $684m (15% of revenue) in 2025. | 10-K / XBRL | SBC is a real cost borne through dilution; it is falling as a % of revenue as the company scales. The dilution it drives is the price of the strong reported cash flow. |
| Cash pile vs interest earned | Year-end liquid assets ≈ $7,177m; 2025 interest/investment income $229m → implied yield ≈ 3.2%. | 10-K / XBRL | A market yield on genuine, conservatively invested cash and government/agency securities — a reassuring check, not a red flag. |
| Debt & implied interest rate | No material funded debt. $500m revolver undrawn; net cash ≈ $7.2bn. | 10-K | Check not applicable — the company is effectively debt-free. |
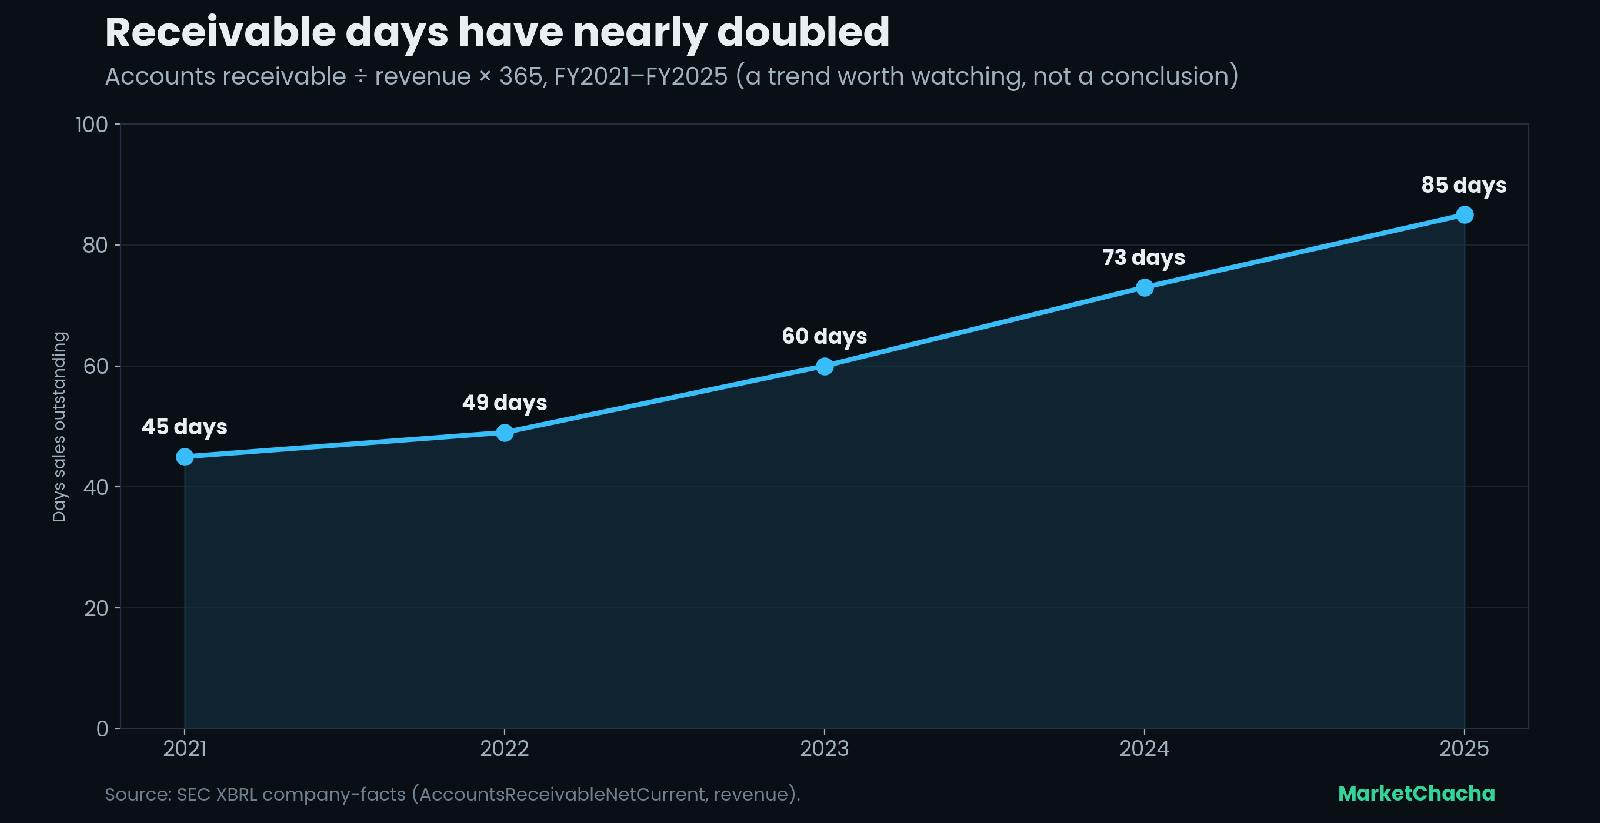
| Receivable days | Rose from 45 days (2021) to 85 days (2025); accounts receivable +81% in 2025 vs +56% revenue. | 10-K / XBRL | Fast growth with revenue recognised ahead of billing, plus long government payment cycles and year-end deal timing; deferred revenue also rose 43%, so customers are still prepaying on net. Worth watching. |
| Related-party transactions | Anduril revenue $17.66m (0.4% of revenue) + $40m invested in Anduril; Chapter $0.17m — all tied to chairman Thiel's venture holdings. | 2026 proxy | Ordinary-course, disclosed, and immaterial in scale; company states no material interest. |
| Insider selling | Founders/executives are net sellers (Karp ~$2bn in 2024; Thiel/Cohen ongoing), under 10b5-1 plans, while retaining ~50% voting control. | Form 4 / Fortune / Bloomberg | Pre-arranged diversification, common after a large run-up; the vote is unaffected because control runs through Class F, not economics. |
| Auditor | Ernst & Young LLP since 2008; unqualified opinion; no change or resignation. | 10-K audit report | Long-tenured auditor, clean opinions — no flag. |
| Subsidiary jurisdictions | 31 named subsidiaries, all in ordinary operating jurisdictions; none in Mauritius/Cayman/BVI/Cyprus/Luxembourg. | Exhibit 21.1 | An operations-driven global footprint with no offshore-secrecy vehicles — a clean finding. |
| Other income as % of pre-tax profit | FY2025 ≈ 15% non-operating; Q1 2026 ≈ 15%, with an unusually large "other income, net" of $68.2m. | 10-K / 10-Q | Interest on the cash pile plus fair-value moves on investments; operating income still supplies ~85% of profit. |
| Effective tax rate | 1.4% in 2025 — profit shielded by accumulated NOLs. | 10-K tax note | Legitimate use of past losses; as NOLs are consumed, the tax rate — and thus the gap between GAAP and fully-taxed earnings — will normalise upward. |
Dilution — the other side of the cash flow
Receivables — the one trend line worth watching
What we could not verify
Several things are genuinely not disclosed and we did not estimate them. The company does not break out revenue by individual customer or contract, so we cannot verify concentration beyond the "top three = 16%" and "no customer >10%" disclosures. It does not disclose its cloud/hosting cost by provider, so the compute-supplier concentration is unknown. The precise economic ownership percentage of each founder is not cleanly reported in a single figure (the proxy reports votes, not a consolidated economic stake), so we have deliberately not put a single number on "how much of Palantir the founders own." The nature of the Q1 2026 "other income, net" is not itemised in the summary data we pulled; readers should check the 10-Q's other-income note for the split. And third-party ownership percentages (Vanguard/BlackRock/retail) come from 13F aggregators, which lag and can differ from the next filing.
What would change the picture
Concrete, checkable things to watch: (1) the effective tax rate — when NOLs deplete and the rate steps up toward a normal level, GAAP net income growth will slow even if the business does not; (2) the receivable-days trend — whether it keeps climbing above 85 days or stabilises as billings catch up; (3) stock-based compensation and share count — whether SBC keeps falling as a % of revenue and whether buybacks scale up to offset dilution; (4) the quality of each quarter's beat — how much sits in "other income" versus operations; (5) customer concentration — the next 10-K's "top three" figure and any customer crossing 10%; and (6) insider selling — the pace of founder/executive Form 4 sales relative to the share price.
Sources
- Palantir Technologies Inc., Form 10-K for FY2025 (filed Feb 17, 2026), SEC EDGAR: https://www.sec.gov/Archives/edgar/data/1321655/000132165526000011/pltr-20251231.htm
- Exhibit 21.1, Subsidiaries of Palantir Technologies Inc. (FY2025 10-K): https://www.sec.gov/Archives/edgar/data/1321655/000132165526000011/a2025fyexhibit211.htm
- Palantir Technologies Inc., Form 10-Q for the quarter ended March 31, 2026 (filed May 5, 2026): https://www.sec.gov/Archives/edgar/data/1321655/000132165526000028/pltr-20260331.htm
- Palantir Technologies Inc., Definitive Proxy Statement (DEF 14A) for the 2026 Annual Meeting: https://www.sec.gov/Archives/edgar/data/1321655/000132165526000019/pltr-20260423.htm
- SEC XBRL company-facts (all financial series): https://data.sec.gov/api/xbrl/companyfacts/CIK0001321655.json
- CNBC, "Palantir reference price for direct listing comes in at $7.25 a share" (Sept 29, 2020): https://www.cnbc.com/2020/09/29/palantir-direct-listing-reference-price-7point25-says-nyse.html
- Fortune, "Palantir CEO Alex Karp made nearly $2 billion from selling company stock last year" (Feb 22, 2025): https://fortune.com/2025/02/22/palantir-ceo-alex-karp-2-billion-stock-net-worth-sales-insider-trading/
- Yahoo Finance / Bloomberg, "Thiel Cashes Out $280M While the Palantir Faithful Do the Math": https://finance.yahoo.com/news/thiel-cashes-280m-while-palantir-200529287.html
- Institutional ownership (third-party 13F aggregation): https://hedgefollow.com/stocks/PLTR and https://fintel.io/so/us/pltr
- Market capitalisation / price reference: https://stockanalysis.com/stocks/pltr/market-cap/
FAQ
Is Palantir actually profitable, or is it an accounting illusion? It is GAAP-profitable and, unusually, generates even more cash than reported profit: 2025 net income was $1.63 billion and operating cash flow was $2.13 billion. The main caveats are that stock-based compensation ($684 million) is a real cost paid through dilution, and the 1.4% tax rate (from past losses) flatters net income relative to a fully-taxed business.
Who controls Palantir? Its three founders — Karp, Thiel and Cohen — can control up to 49.999% of the vote through 1.005 million Class F shares held in a voting trust, even though they own only a small fraction of the economics. Public Class A shareholders own most of the value but have limited voting power.
Does Palantir depend on one giant customer? No single customer was 10% or more of revenue in 2023–2025. The top three together were 16% of 2025 revenue. The broader dependency is on government budgets and contract awards, and many contracts can be terminated for convenience.
Why is insider selling so heavy? Founders and executives have sold large amounts (Karp ~$2 billion in 2024; Thiel and Cohen ongoing), almost all under pre-set Rule 10b5-1 plans. That is common after a sharp run-up; because control runs through Class F shares, selling economic stock does not reduce their voting control.
Are there any offshore or shell-company structures? Not among the named subsidiaries. All 31 sit in ordinary operating jurisdictions (the U.S. plus the countries where Palantir sells), with none in Mauritius, the Caymans, the BVI, Cyprus or Luxembourg.
What's the single biggest thing to watch next? The effective tax rate. Once the accumulated net-operating-losses are used up, the tax rate rises toward normal and reported net-income growth will slow even if revenue and cash flow keep climbing.
Independent research for education and discussion only. Not investment advice, not a recommendation, and not a rating — we issue no buy/sell calls and no target prices. Every figure is sourced from the primary documents linked above; figures can be restated and we can make mistakes, so always verify against the original. Nothing here alleges wrongdoing by any company or individual: where a fact raises a question we state the fact, cite it, and give the benign explanation alongside. Offshore holding structures, pledging and preferential allotments are all legal and common — they are disclosed here as facts, not as accusations.
This article is for educational and informational purposes only. It is not financial advice, investment recommendation, or a solicitation to buy or sell securities. Investing involves significant risks. I am not a SEBI-registered investment advisor. Readers should consult their own financial advisor and conduct their own research before making any investment decisions.
Comments
Join the conversation
Sign in to join the conversation.
Follow replies, add your view, and take part in the discussion.
Sign in to commentLoading comments...