

Sterlite Technologies (STLTECH): the full file — the numbers, the owners, and what the filings actually show
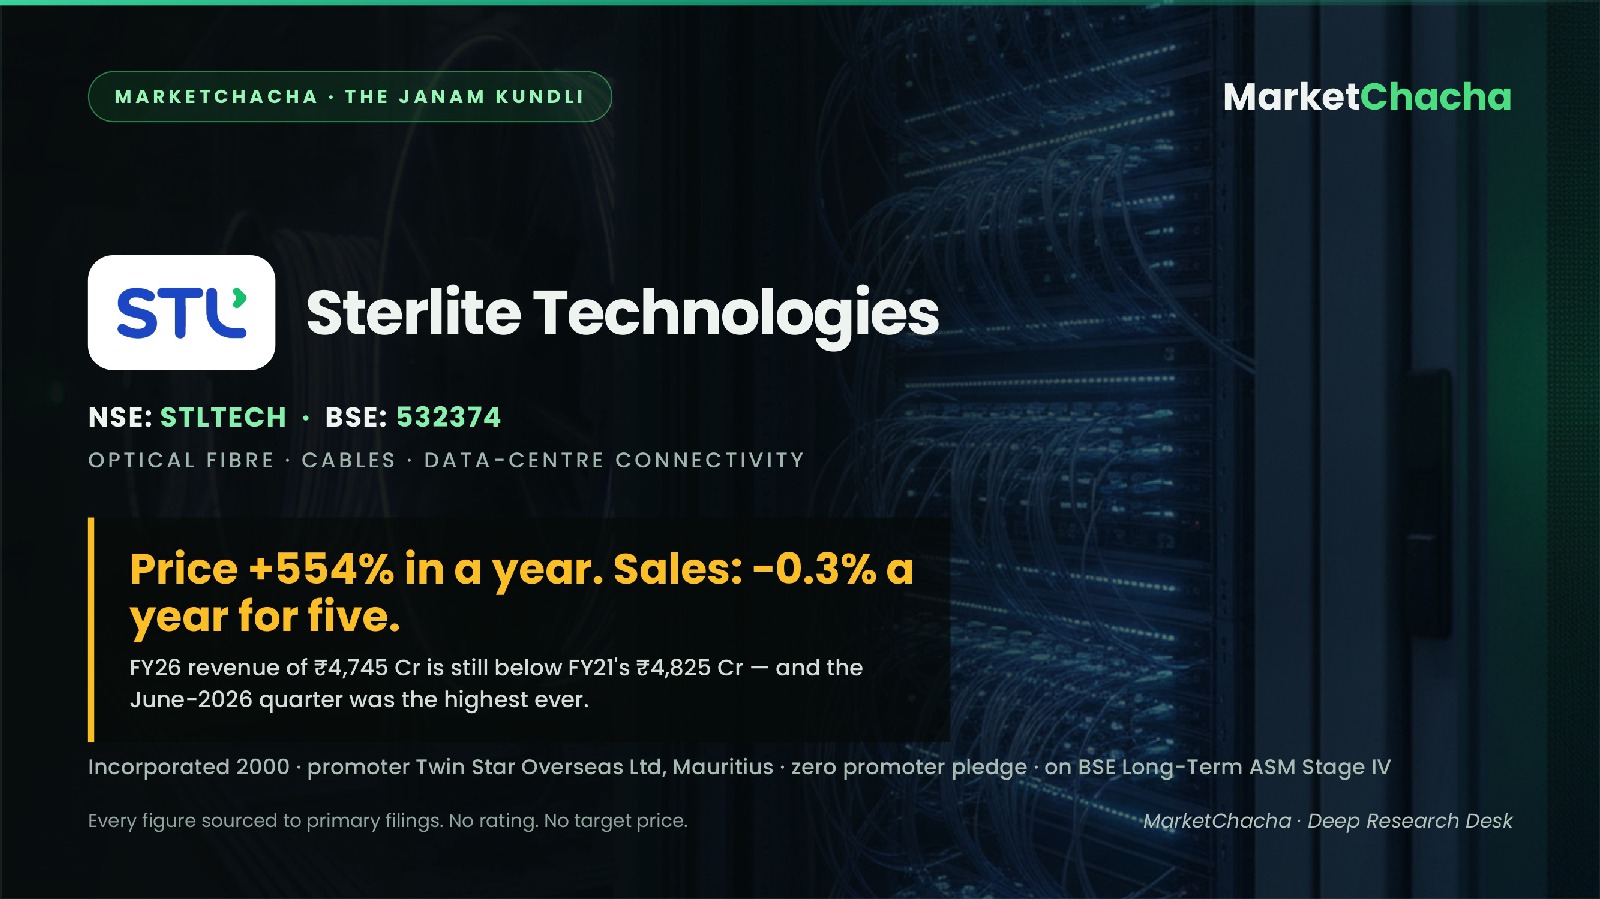
Sterlite Technologies makes optical fibre, turns it into optical fibre cable, and increasingly sells the connectors, patch panels and pre-terminated assemblies that plug that cable into a data centre. It earns money by selling those products, mostly to telecom carriers and, since roughly last year, to the operators building AI data centres.
Here is the fact that frames everything else. Over the year to 3 September 2026 the share price rose about 554%, from a 52-week low of ₹84.60 to ₹713. Over the five years to FY26, consolidated revenue compounded at roughly minus 0.3% a year — FY26 revenue of ₹4,745 crore is still below the ₹4,825 crore the company reported in FY21. The stock and the income statement have been telling two different stories, and in the June-2026 quarter the income statement finally started to move. This file sets out what the filings actually show.
Origin — the company's birth certificate
Sterlite Technologies Limited carries the corporate identity number L31300PN2000PLC202408, which places its incorporation in 2000 with the Registrar of Companies at Pune. It took its present shape in July 2001, when the telecom division of Sterlite Industries (India) Limited was demerged into it. In July 2006 it acquired Sterlite Industries' transmission-line business, adding power cables; that line was later separated out. The company has been listed on the BSE (code 532374) and the NSE (STLTECH) throughout.
It belongs to the promoter group built around Anil Agarwal — the same group as Vedanta Limited, Sterlite Power and Hindustan Zinc. That matters for two later sections: the ownership chain, and the related-party numbers.
The most recent structural event is the largest. With effect from 31 March 2025, STL demerged its Global Services Business into a separate listed entity, STL Networks Limited (trading under the brand Invenia), whose shares were listed on 4 September 2025. Any comparison of FY26 against FY23 or FY24 is therefore not like-for-like: a chunk of revenue left the company. We flag this every time it is relevant below.
The business — what they actually sell
Two reported segments. Optical Networking — optical fibre, optical fibre cable, optical interconnect and connectivity products — is the engine. Digital Solutions (STL Digital) is a much smaller software and services arm. In the June-2026 quarter, Optical Networking produced segment revenue of ₹1,842 crore and segment EBITDA of ₹401 crore against a group total of ₹1,910 crore and ₹397 crore, which is to say the optical business is effectively the whole company right now.
The company describes itself as backward-integrated — it draws its own fibre and cables it in-house — and states a global ex-China optical fibre cable market share of 8% in FY26. It reports an intellectual property portfolio of 785+ patents filed and granted.
Who actually buys from them
The FY26 consolidated accounts are explicit: "No individual customer contributed more than 10% of Group's Total Revenue for the year ended March 31, 2026 and March 31, 2025." On the standard concentration test, FY26 is clean.
The geography, however, is concentrated. Revenue from external customers within India was ₹776 crore in FY26 against ₹3,969 crore from outside India — 83.6% of revenue is export. Domestic revenue actually fell 2.9% year on year, from ₹799 crore. All of FY26's growth came from abroad.
Two things will change the concentration picture from FY27, and both are worth watching rather than assuming. First, the company disclosed a multi-year product award letter worth US$1.11 billion (the company puts it at ₹10,000+ crore) to supply optical connectivity products for next-generation AI data centres across FY27 to FY29. The counterparty is not named in any filing we could find. Second, the open order book stood at ₹18,618 crore at the end of the June-2026 quarter, roughly 3.9× FY26 revenue. A single award of that size, converting over three years, mechanically raises single-customer concentration — the FY27 accounts will show whether the "no customer above 10%" line survives.
Where it is actually made — plants and supply chain
From the FY26 annual report's plant-locations disclosure:
- Optical fibre: Waluj Industrial Area and Shendra Five Star Industrial Area, Chhatrapati Sambhajinagar, Maharashtra, India; and Haimen City, Jiangsu, China.
- Optical fibre cables and optical interconnect: Rakholi village, Silvassa, Dadra & Nagar Haveli, India; Dello (Brescia), Italy; and Lugoff, South Carolina, USA.
- Copper telecom cables and optical interconnect: Dadra, Dadra & Nagar Haveli, India.
So the company owns fibre-drawing capacity inside China and cabling capacity inside both the EU and the US — relevant given tariff and supply-chain localisation pressure in exactly those two markets. On 3 September 2026 the board approved roughly ₹3,000 crore of capex for about 50% capacity addition at an existing facility by end-FY29, alongside a stated FY29 revenue ambition of ₹20,000 crore.
Not disclosed: the company does not name its key raw-material suppliers, does not quantify single-source dependencies, and does not break out the cost of silica/preform inputs. Any claim about STL's supplier risk is inference, not disclosure.
Five years of numbers
All figures consolidated, ₹ crore.
| Year | Revenue | Operating profit | OPM | PAT | CFO |
|---|---|---|---|---|---|
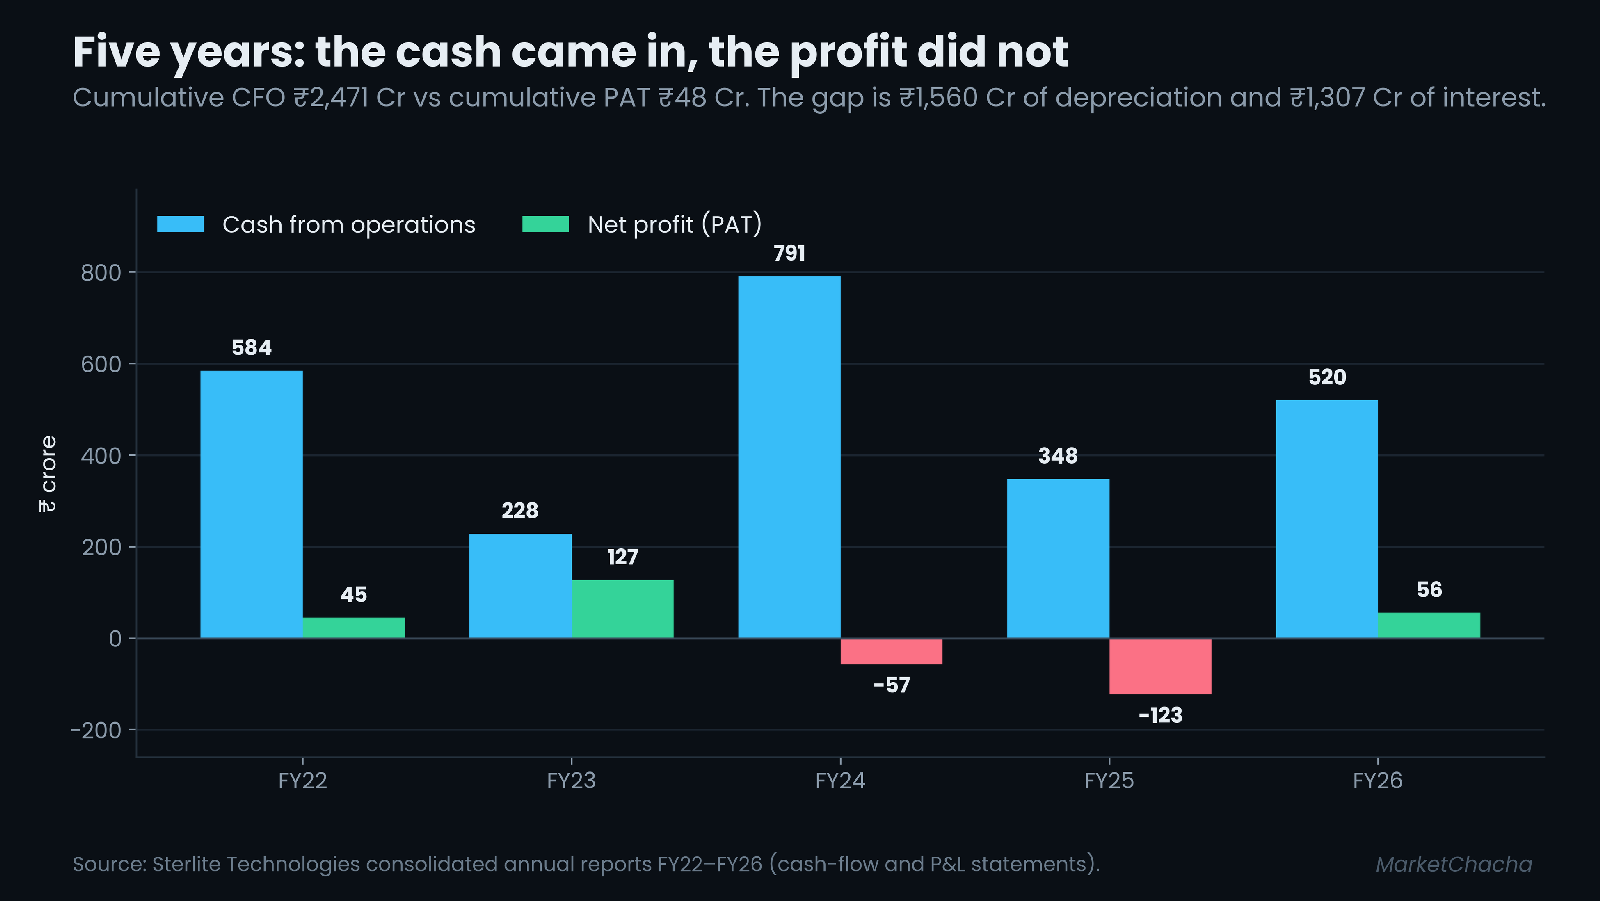
| FY22 | 5,437 | 665 | 12.2% | 45 | 584 |
| FY23 | 6,925 | 895 | 12.9% | 127 | 228 |
| FY24 | 4,083 | 471 | 11.5% | -57 | 791 |
| FY25 | 3,996 | 416 | 10.4% | -123 | 348 |
| FY26 | 4,745 | 569 | 12.0% | 56 | 520 |
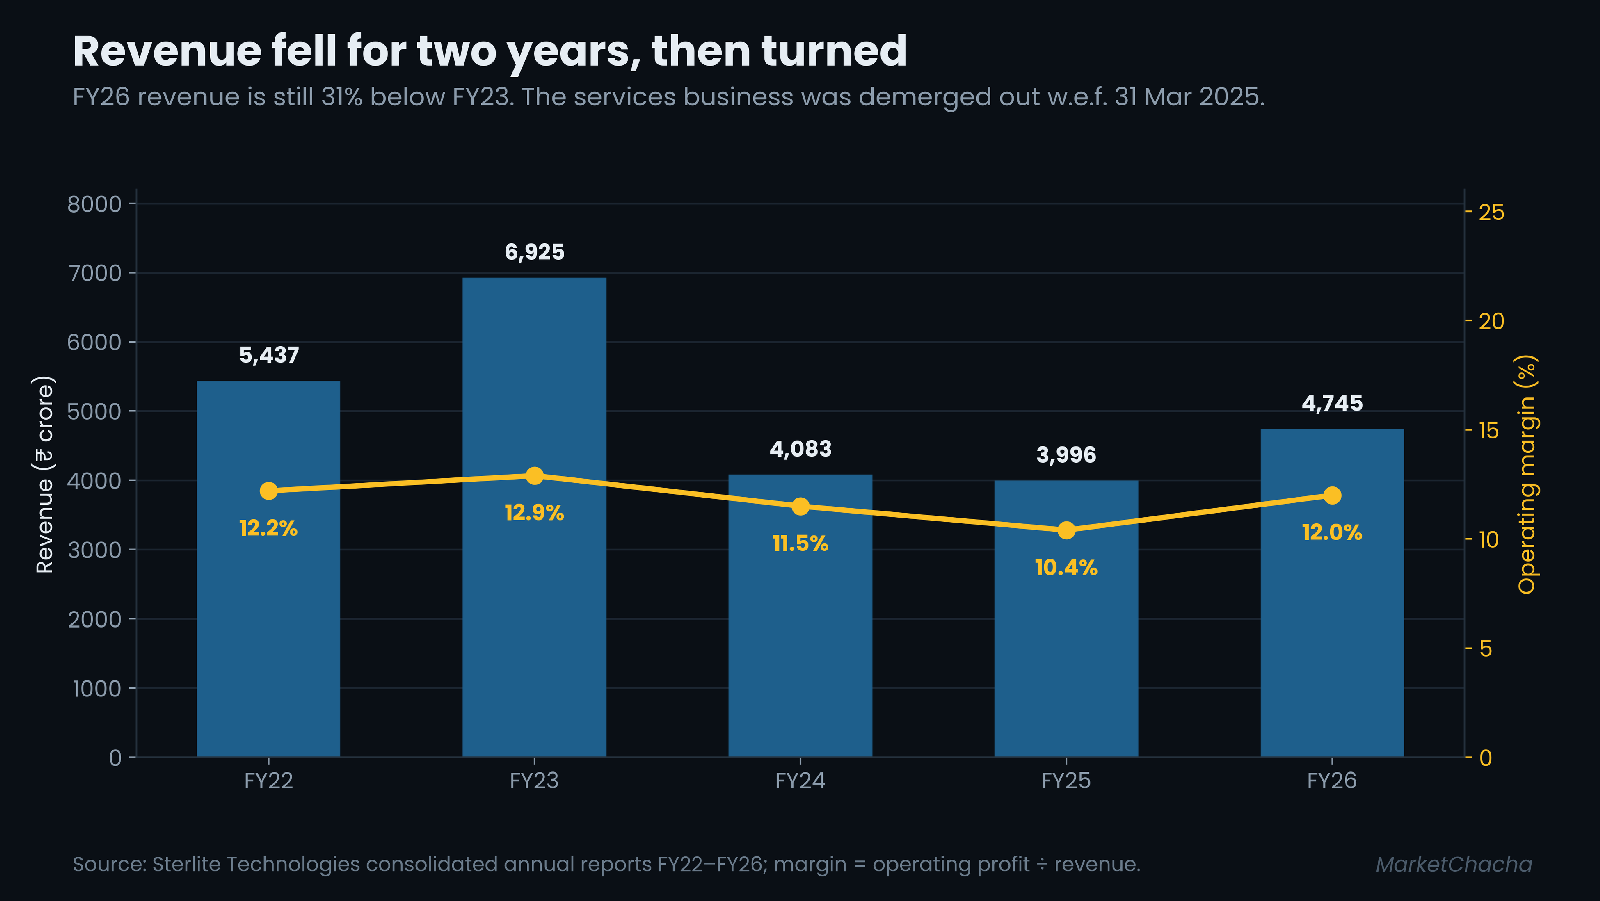
The arithmetic: revenue over FY22–FY26 compounded at −3.3% a year; over FY21–FY26 at −0.3%. Cumulative PAT across the five years is ₹48 crore on cumulative revenue of ₹25,186 crore. Cumulative cash from operations across the same five years is ₹2,471 crore. Meanwhile the five-year share price CAGR is 29%, which compounds to a total five-year return of roughly +257%, and the one-year return is about +554%.
Income statement, FY26 vs FY25
| ₹ crore | FY26 | FY25 | Change | % |
|---|---|---|---|---|
| Revenue | 4,745 | 3,996 | +749 | +18.7% |
| Operating expenses | 4,176 | 3,580 | +596 | +16.6% |
| Operating profit (EBITDA) | 569 | 416 | +153 | +36.8% |
| Operating margin | 12.0% | 10.4% | +1.6pp | — |
| Other income | 75 | -15 | +90 | n.m. |
| Finance cost | 224 | 241 | -17 | -7.1% |
| Depreciation & amortisation | 313 | 316 | -3 | -0.9% |
| Profit before tax | 107 | -156 | +263 | n.m. |
| Tax | 51 | -7 | +58 | n.m. |
| Profit after tax | 56 | -123 | +179 | n.m. |
| Net margin | 1.2% | -3.1% | +4.3pp | — |
| EPS (basic, ₹) | 1.15 | -2.54 | +3.69 | n.m. |
Balance sheet, FY26 vs FY25
| ₹ crore | FY26 | FY25 | Change | % |
|---|---|---|---|---|
| Net worth (equity + reserves) | 2,268 | 1,990 | +278 | +14.0% |
| Borrowings | 1,942 | 1,926 | +16 | +0.8% |
| Other liabilities | 2,078 | 1,530 | +548 | +35.8% |
| Investments | 467 | 90 | +377 | +418.9% |
| Fixed assets | 2,971 | 2,928 | +43 | +1.5% |
| Total assets | 6,288 | 5,446 | +842 | +15.5% |
Cash flow, FY26 vs FY25
| ₹ crore | FY26 | FY25 | Change |
|---|---|---|---|
| Operating (CFO) | 520 | 348 | +172 |
| Investing (CFI) | -485 | -295 | -190 |
| Financing (CFF) | -133 | 4 | -137 |
| Free cash flow | 344 | 226 | +118 |
The material variances. Two balance-sheet lines moved more than 35%: investments (+419%, ₹90 crore to ₹467 crore) and other liabilities (+36%). Borrowings were essentially flat at ₹1,942 crore. On the income statement, the swing from a ₹156 crore pre-tax loss to a ₹107 crore pre-tax profit is ₹263 crore, of which ₹153 crore came from operating profit, ₹90 crore from the swing in other income, and ₹20 crore from lower finance and depreciation charges.
Earnings quality, stated plainly. Other income of ₹75 crore equals 70% of FY26 pre-tax profit. Take it away and pre-tax profit is roughly ₹32 crore rather than ₹107 crore. The benign reading is straightforward and probably correct: this is a company with 84% export revenue, so its "other income" line is dominated by foreign-exchange movement and swings both ways — it was negative ₹15 crore in FY25 and negative ₹64 crore in FY23. It is not a quality flag so much as a volatility flag, and the honest summary is that FY26's return to profit was real at the operating level but flattered at the pre-tax level.
The latest quarter, decoded
| ₹ crore | Q1 FY27 (Jun-26) | Q4 FY26 (Mar-26) | QoQ | Q1 FY26 (Jun-25) | YoY |
|---|---|---|---|---|---|
| Revenue | 1,910 | 1,441 | +32.5% | 1,019 | +87.4% |
| Operating profit | 385 | 195 | +97.4% | 132 | +191.7% |
| Operating margin | 20.2% | 13.5% | +6.7pp | 13.0% | +7.2pp |
| Other income | 12 | 54 | -77.8% | 8 | +50.0% |
| Finance cost | 55 | 63 | -12.7% | 50 | +10.0% |
| Depreciation | 85 | 77 | +10.4% | 77 | +10.4% |
| Profit before tax | 257 | 109 | +135.8% | 13 | +1,877% |
| Profit after tax | 197 | 59 | +233.9% | 10 | +1,870% |
This is the cleanest quarter in the table, and the reason is the margin, not the arithmetic of a low base. Operating margin of 20.2% is the highest in roughly twenty quarters; the company attributes it to product mix and operating leverage, with a larger data-centre contribution. Company-reported EBITDA was ₹397 crore at a 20.8% margin.
The quality check that matters here. Other income was 4.7% of pre-tax profit this quarter, against 49.5% in the March-2026 quarter and 61.5% in the June-2025 quarter. In other words, the two comparison quarters leaned heavily on a non-operating line and this one did not. Tax was charged at 23%, against a 46% effective rate in Q4 FY26 and a negative rate in the loss-making quarters — so the year-ago and prior-quarter PAT numbers are noisy denominators, and the +1,870% headline should be read as "off a near-zero base", not as a rate of growth that means anything.
Who owns it — and where those owners are registered
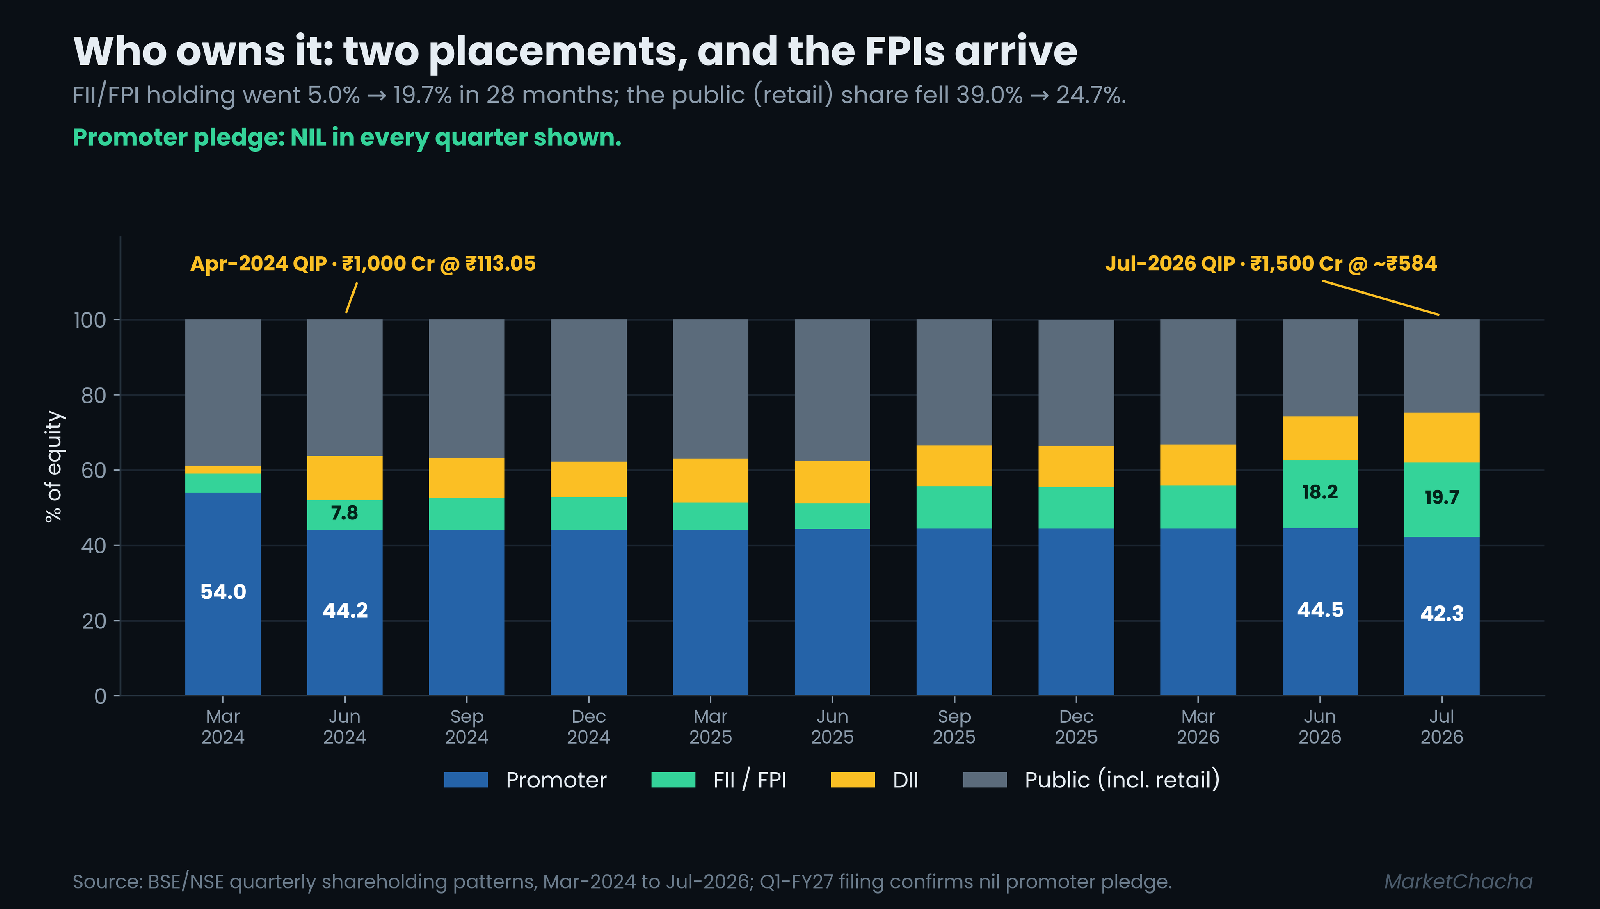
As at 30 June 2026, the promoter and promoter group held 44.51% across ten entities. Of that, 42.90% sits in a single foreign entity, Twin Star Overseas Limited, which the annual report identifies as the immediate holding company and as registered in Mauritius. The Indian promoter entities together hold 1.62%, the largest being Vedanta Limited at 0.98%; the named individuals are small (Ankit Agarwal 0.37%, Pravin Agarwal 0.22%, Navin Agarwal 0.03%). Anil Kumar Agarwal is listed in the promoter group with nil direct shares.
Above Twin Star, the shareholding pattern lists, all as overseas corporate bodies with nil direct holding: Vedanta Incorporated (erstwhile Volcan Investments Limited), Conclave PTC Limited and the Anil Agarwal Discretionary Trust. Note 39(6) of the FY26 accounts independently confirms the Bahamas connection, recording that a ₹114 crore corporate guarantee given to the income-tax authorities is itself "backed by the corporate guarantee issued by Volcan Investments Limited (now known as Vedanta Incorporated Bahamas)".
On the pledge question, the filing is unambiguous. The Q1-FY27 shareholding pattern answers "No" to all three encumbrance questions — pledge, non-disposal undertaking, and any other encumbrance. Zero promoter shares are encumbered, and the same is true in every quarter shown in the chart above. Given this promoter group's history — Twin Star pledged and then released STL shares around 2019 — the current nil position is a verified, positive fact rather than an assumption.
The institutional shift is the loudest number in the ownership file. FII/FPI holding went from 5.02% in March 2024 to 19.71% by July 2026; DII went from 2.00% to 13.27%; and the public (largely retail) share fell from 38.99% to 24.74%. The count of shareholders moved from 2,32,669 to 2,35,524 over the same period, dipping to 2,12,162 in March 2026 before recovering. Not disclosed: the shareholding pattern for the quarter does not individually name any FPI above 1%, so we cannot tell you which foreign funds these are, or where each is registered. A diffuse FPI register with no individually disclosable holder is itself a finding, not an omission.
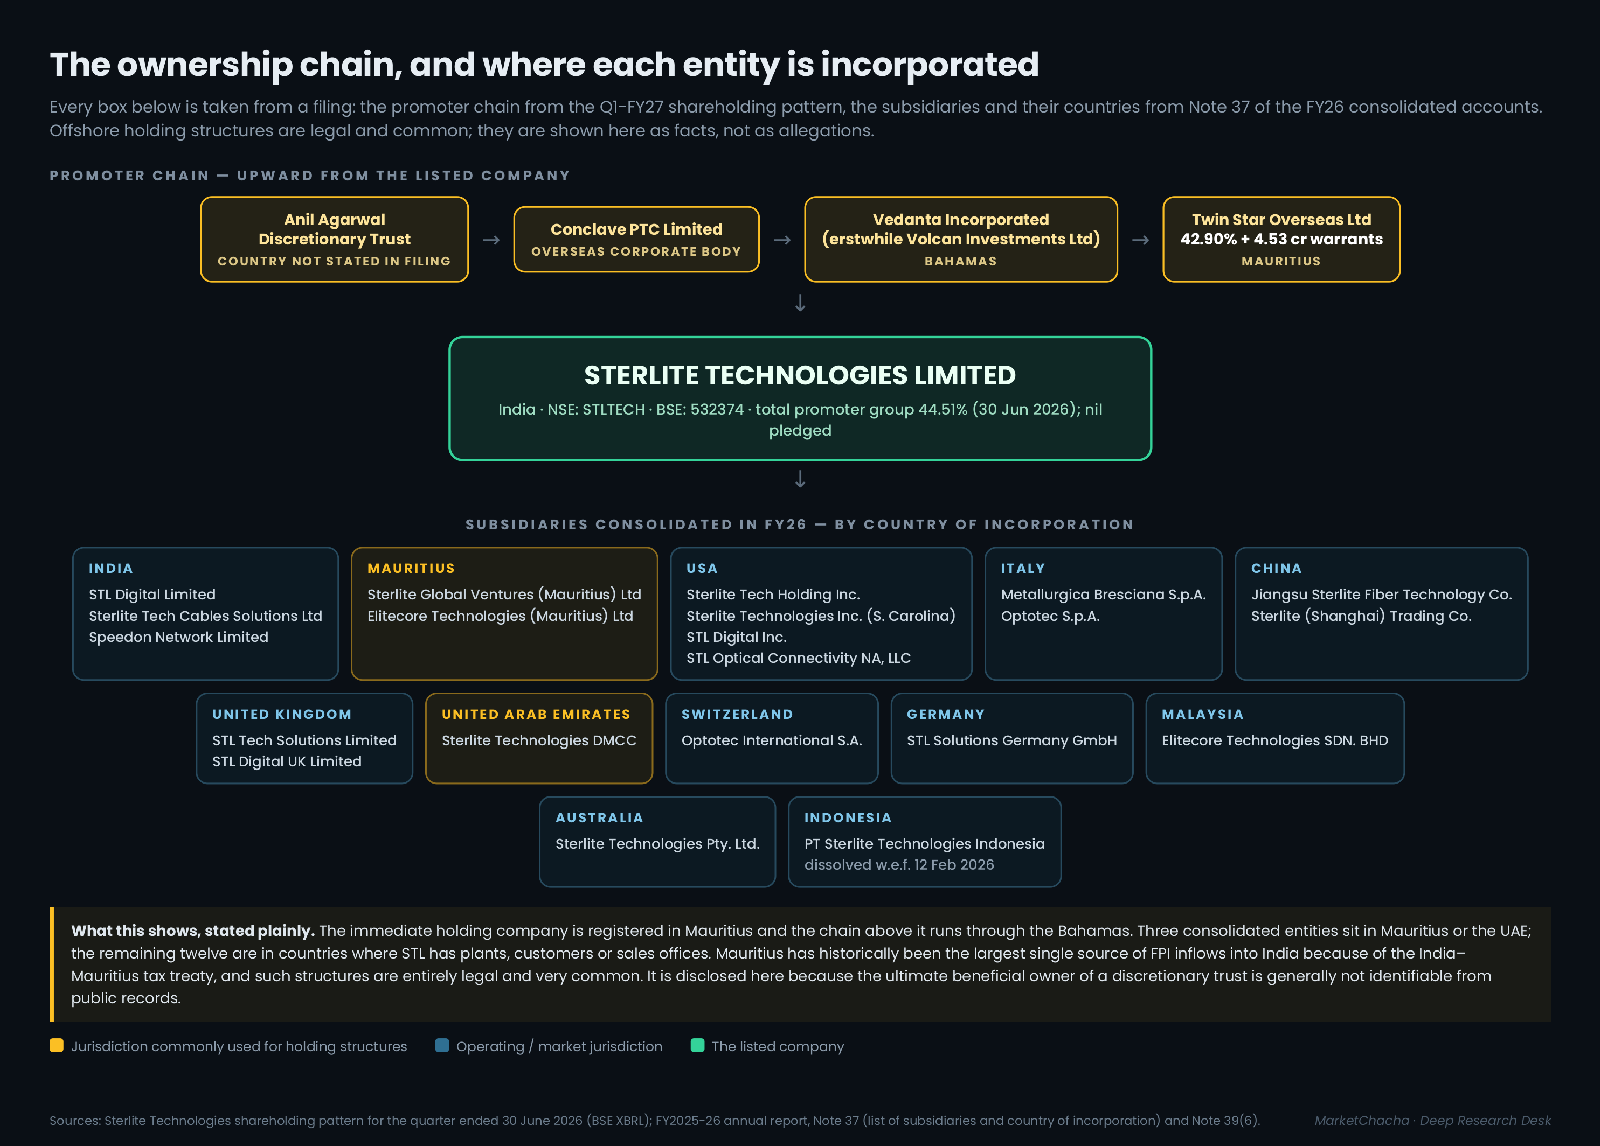
On the subsidiary side, Note 37 of the FY26 consolidated accounts lists every consolidated entity with its country of incorporation. Fifteen are active. Three sit in jurisdictions commonly used for holding structures — Sterlite Global Ventures (Mauritius) Limited and Elitecore Technologies (Mauritius) Limited in Mauritius, and Sterlite Technologies DMCC in the United Arab Emirates. The remaining twelve are in countries where STL has plants, customers or sales offices: India, the USA, Italy, China, the UK, Switzerland, Germany, Malaysia and Australia. PT Sterlite Technologies Indonesia was dissolved with effect from 12 February 2026, and STL Optical Interconnect S.p.A. merged into Metallurgica Bresciana S.p.A. effective 31 March 2026.
The neutral context, said once: Mauritius has historically been the largest single source of FPI inflows into India because of the India–Mauritius tax treaty, and an offshore holding chain of this kind is entirely legal and extremely common among Indian promoter groups. It is set out here because the ultimate beneficial owner behind a discretionary trust is generally not identifiable from public records — and because a reader entitled to know who controls 42.9% of a company should be able to see the chain rather than be told it exists.
Capital history — every time they raised money
- 2010: a 1:1 bonus issue (record date March 2010) and a sub-division of the face value from ₹5 to ₹2. Face value remains ₹2.
- April 2024 — QIP, ₹1,000 crore. 8.85 crore shares at ₹113.05. Promoter holding fell from 53.98% to 44.18% in a single quarter as a direct result.
- 31 March 2025 — demerger. The Global Services Business separated into STL Networks Limited, listed 4 September 2025.
- February–March 2026 — preferential warrants to the promoter. On 7 February 2026 the board approved 4.53 crore convertible warrants to Twin Star Overseas at ₹110 each (₹2 face value plus ₹108 premium), aggregating ₹498.3 crore, exercisable in tranches over 18 months. Shareholders approved at an EGM on 4 March 2026 with 99.95% support. The 45,300,000 warrants appear as outstanding convertible securities in the 30 June 2026 shareholding pattern, which puts promoter holding at 48.99% on a fully diluted basis on that date's share count.
- June–July 2026 — QIP, ₹1,500 crore. Launched 25 June 2026 at a floor price of ₹613.69; concluded 2 July 2026 with 2.57 crore shares issued at approximately ₹583.66, a discount within the 5% maximum SEBI permits against the floor. The company states this made it net debt free.
The pricing fact, stated without adjective. On 7 February 2026, the day the warrant issue was approved, the stock closed around ₹139.50, up 5.32%. The warrant price of ₹110 is about 21% below that day's price. Indian preferential-issue pricing is not set by the closing price — SEBI's formula uses 90-trading-day and 10-trading-day volume-weighted averages, and after a sharp run-up the formula price will sit below the spot price by construction. So the discount to spot is expected, is legal, and is the direct arithmetic consequence of a rising share price. What the reader should simply note is the outcome: those warrants carry a ₹110 exercise price and the shares closed at ₹713 on 3 September 2026, roughly 6.5×; and that institutions who took the July QIP paid about ₹584, roughly 22% below the same closing price.
Dilution. Shares outstanding went from about 40.0 crore before the April-2024 QIP to about 51.4 crore after the July-2026 QIP — +28.6%. If all 4.53 crore warrants convert, the increase from the FY24 base is about +39.9%. Dividend payout has been zero in FY24, FY25 and FY26.
Who runs it, and the wider web
Per the FY26 annual report: Anil Agarwal is Non-Executive Chairman; Pravin Agarwal is Vice Chairman and Whole-time Director; Ankit Agarwal is Managing Director. Tushar Shroff has been Chief Financial Officer since December 2022. The promoter-group list in the shareholding pattern maps the wider web directly: Vedanta Limited, STL Networks Limited, Sterlite Electric Limited, Sterlite Grid 5 Limited, Twin Star Technologies Limited, Runaya Private Limited and Runaya Metsource Limited all appear as promoter-group entities, most with nil shareholding.
Auditor. Price Waterhouse Chartered Accountants LLP (firm registration 012754N/N500016), appointed at the AGM of 26 August 2022 for a second five-year term running to the AGM in 2027. No auditor resignation, no mid-term auditor change and no qualified opinion in the last five years.
Related-party transactions. Most of the standalone related-party lines are transactions with subsidiaries, which eliminate on consolidation. The one that does not is the fellow-subsidiary relationship: purchases of goods and services from Vedanta Limited of ₹265 crore in FY26, up from ₹211 crore in FY25 — roughly 10.8% of the standalone turnover of ₹2,446 crore disclosed in the CSR section. Purchases from Runaya Private Limited were ₹16 crore. The benign explanation is the obvious one and is almost certainly the whole story: STL manufactures copper telecom cables and consumes aluminium and copper, Vedanta produces exactly those metals, related-party purchases require audit-committee approval and arm's-length certification, and the FY26 directors' report records that no material contracts requiring Section 134(3)(h) disclosure were entered into. It is listed here because 10.8% of standalone turnover flowing to a single group company is material enough that a reader should know it exists.
The regulatory and surveillance record
Exchange surveillance — the hardest checkable fact in this file. STL is currently on the BSE's Long-Term Additional Surveillance Measure, Stage IV, entered on 11 May 2026 and still active as at 4 September 2026. The escalation ladder is visible in the exchange record and tracks the price move almost exactly: Short-Term ASM Stage I from 2 February 2026, Long-Term ASM Stage I from 11 February, Stage II from 16 April, back to Stage I on 24 April, then Stage IV from 11 May. The company has an earlier ASM history too (July 2025, and February 2021). It has not been shortlisted under GSM.
What ASM means, neutrally: it is a price-and-volume-triggered surveillance framework applied by SEBI and the exchanges, and the higher stages carry consequences such as a 100% margin requirement and, at the top stages, trade-for-trade settlement — which is consistent with STL appearing in the NSE's "BE" series. It is not a finding of wrongdoing and it says nothing about the company's accounts. It is a statement that the stock's price and volume behaviour crossed objective thresholds. Given a 554% one-year move, it would be more surprising if the stock were not there.
Credit ratings — moving the other way. The FY26 annual report discloses CRISIL at AA-/Negative and ICRA at AA-/Stable. Since then the trajectory reversed: CRISIL revised its outlook to Stable, ICRA upgraded to AA (Stable), and on 2 September 2026 CRISIL upgraded the long-term rating from AA- to AA, reaffirming commercial paper at A1+. There is no "Issuer Not Cooperating" rating anywhere in the record, and no downgrade in the period reviewed.
The Emphasis of Matter — this is the one to read carefully. The FY26 consolidated audit report carries an Emphasis of Matter drawing attention to Note 39(4). Prysmian Cables and Systems USA, LLC sued Stephen Szymanski, an employee of STL's US subsidiary Sterlite Technologies Inc. ("STI"), and STI itself, alleging that Szymanski breached non-compete and confidentiality agreements and passed confidential information on. On 9 August 2024 a jury returned a verdict of US$0.2 million against Szymanski and US$96.5 million against STI. On 29 August 2025 the court confirmed the verdict, with the total award reaching US$101.25 million including US$4.75 million of attorneys' fees and costs. STI has appealed to the US Court of Appeals for the Fourth Circuit and has deposited a bond of US$41.53 million. The accounts state that "the ultimate financial implications, if any, cannot be ascertained at this stage", and that STL itself is not a party and no claims are being made against it.
The scale, in rupees at roughly ₹88 to the dollar: the confirmed award is about ₹891 crore, or roughly 39% of FY26 net worth of ₹2,268 crore, against FY26 profit after tax of ₹56 crore. The bond posted is about ₹365 crore. No provision has been made, and the amount does not appear in the quantified contingent-liability table. The benign — and accounting-correct — explanation is that Ind AS requires a provision only where an outflow is both probable and reliably estimable; with an appeal live before a federal appellate court, management's position that the outcome cannot be ascertained is a standard and defensible treatment. An Emphasis of Matter is precisely the mechanism by which an auditor flags a disclosed matter without qualifying the opinion — the FY26 opinion is unmodified. But a reader should know that an unresolved claim worth roughly 39% of net worth is sitting outside the balance sheet.
Also on the record: patent litigation initiated by Fujikura in the United Kingdom concerning certain low-fibre-count air-blown cables, currently under appeal with no injunction in place and no reliable estimate of financial impact; a ₹25 crore claim by a bank in the Debt Recovery Tribunal, decided in the group's favour in 2015 and now under writ petition in the Bombay High Court; and Department of Telecommunications AGR demand orders dated 21 February 2022 covering FY15 to FY19, stayed on petition, secured by a ₹3 crore bank guarantee. Unrecognised deferred tax assets on unused tax losses stood at ₹213 crore. We found no SEBI order, settlement or show-cause naming the company in the period reviewed.
Forensic checks — what the accounts show
| Check | What we found | Source | A benign explanation |
|---|---|---|---|
| 5-yr cumulative CFO ÷ PAT | CFO ₹2,471 cr vs PAT ₹48 cr. The ratio is meaningless because the denominator is near zero — but the direction is the important part: cash massively exceeded profit, the opposite of the classic warning sign. | FY22–FY26 consolidated cash-flow and P&L statements | The ₹2,423 cr gap is almost exactly ₹1,560 cr of depreciation plus ₹1,307 cr of interest. A capital-intensive, formerly leveraged manufacturer generates operating cash and then hands it to lenders and the depreciation schedule. |
| Implied interest rate on debt | FY26: interest on borrowings ₹177 cr ÷ average borrowings ₹1,934 cr = 9.2%. FY25: ₹190 cr ÷ ₹2,651 cr = 7.2%. | Note 33, FY26 annual report; balance sheets | Both sit in a normal band for an Indian corporate rated AA-/AA. The FY25 average is distorted by the demerger, which moved debt off the balance sheet mid-period. |
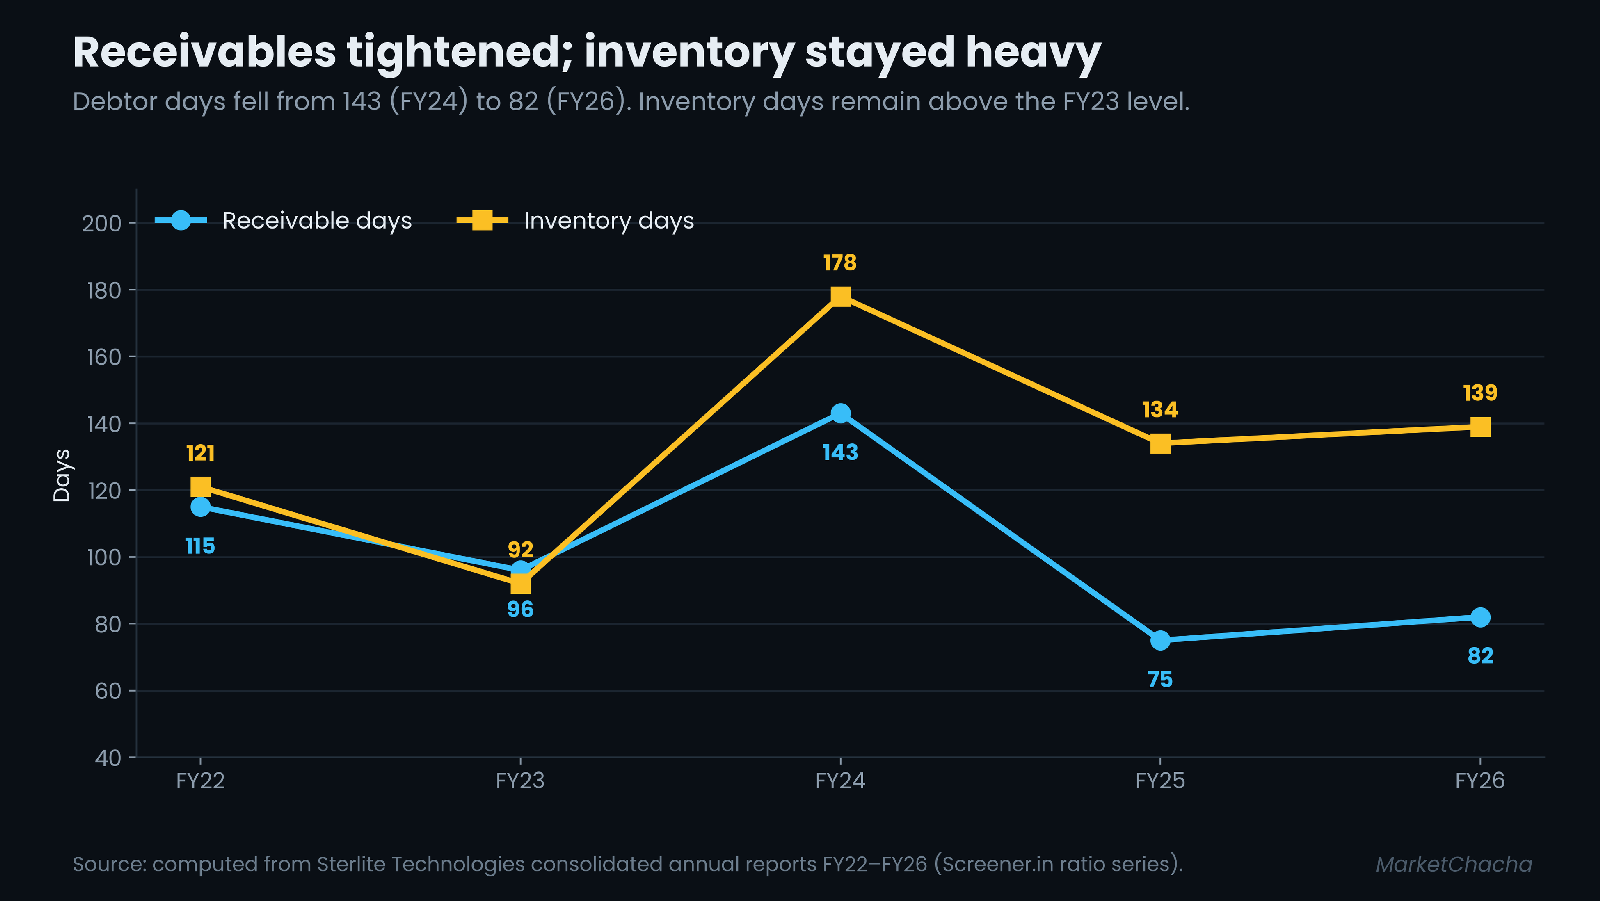
| Receivable days | 115 → 96 → 143 → 75 → 82 across FY22–FY26. Improved sharply from the FY24 peak. | Computed from consolidated accounts | Falling receivable days alongside rising revenue is the healthy direction. The FY24 spike coincides with the revenue collapse, when the denominator fell faster than the balance. |
| Inventory days | 121 → 92 → 178 → 134 → 139. Still well above the FY23 level and rising again in FY26. | Computed from consolidated accounts | A company building into a ₹18,618 cr order book and a large multi-year connectivity award would reasonably carry more stock ahead of delivery. |
| Related-party transactions | Purchases from fellow subsidiary Vedanta Limited of ₹265 cr (FY26) vs ₹211 cr (FY25), ≈10.8% of standalone turnover. | Standalone related-party note, FY26 annual report | STL consumes copper and aluminium; Vedanta produces them. Audit-committee approval and arm's-length certification are mandatory, and the directors' report records no material Section 134(3)(h) contracts. |
| Promoter pledge | NIL. All three encumbrance questions answered "No". | Shareholding pattern, quarter ended 30 June 2026 | Not applicable — this is a clean result. |
| Promoter holding trend | 53.98% (Mar-24) → 44.18% (Jun-24) after the QIP → 44.51% (Jun-26) → 42.29% (Jul-26) after the second QIP. The falls are dilution, not selling; the promoter has been adding via warrants. | Quarterly shareholding patterns | Dilution from primary issuance is not a promoter exit. Subscribing ₹498 cr of warrants points the other way. |
| Auditor | Price Waterhouse Chartered Accountants LLP throughout. No resignation, no change, no qualified opinion in five years. FY26 opinion unmodified, with an Emphasis of Matter on the Prysmian litigation. | FY26 annual report, independent auditor's report | An Emphasis of Matter is a signpost to a disclosed note, not a qualification. |
| Subsidiaries and jurisdictions | 15 active consolidated entities. 3 in Mauritius/UAE; 12 in operating countries. Immediate holding company registered in Mauritius; chain above runs through the Bahamas. | Note 37 and Note 39(6), FY26 annual report; Q1-FY27 shareholding pattern | Legal, disclosed and very common. The two Mauritius subsidiaries are legacy acquisition vehicles; DMCC is a Dubai trading entity. |
| Dilution & preferential allotment | +28.6% shares since FY24; +39.9% fully diluted. Promoter warrants at ₹110 vs ₹139.50 market on approval day; QIP at ~₹584 vs ₹613.69 floor. | Shareholding patterns; BSE announcements 7 Feb 2026 and 25 Jun 2026 | Both prices follow SEBI's mandated formulas; a discount to spot is arithmetic when the price is rising fast, not a concession. |
| Other income as % of PBT | FY26: 70%. Q1 FY27: 4.7%. Q4 FY26: 49.5%. | Consolidated P&L and quarterly results | 84% export revenue makes this line a forex swing factor — it was negative in FY23 and FY25. Volatility, not manufacture. |
| Capex vs depreciation | FY26 D&A ₹313 cr against roughly flat gross block (fixed assets ₹2,971 cr vs ₹2,928 cr) and CWIP down to ₹19 cr. Investing outflow ₹485 cr, but ₹377 cr of that is the rise in investments. | FY26 consolidated balance sheet and cash-flow statement | The company underspent depreciation through the downturn and is only now committing ₹3,000 cr of new capex (approved 3 September 2026). Asset turnover on ₹4,745 cr of revenue is roughly 1.6×. |
Valuation, for context only. At ₹713 on 3 September 2026, market capitalisation is about ₹36,680 crore. Book value per share is ₹46.5, so the stock trades at roughly 15.3× book. Trailing EPS of ₹4.98 puts the P/E near 143× (Screener displays 155). The nearest listed comparable, HFCL Limited — also an optical fibre and cable maker — trades at about 58.8× earnings and 6.9× book. Tejas Networks is loss-making and so has no meaningful P/E, at about 3.4× book. We state the multiples; we are not telling you what they should be.
What we could not verify
- The identity of the AI data-centre customer behind the US$1.11 billion award. Not named in any filing we could locate.
- The identity of any individual FPI. The 30 June 2026 shareholding pattern discloses no foreign portfolio investor above 1% by name, so the composition of the 19.71% FPI block is not publicly resolvable from this filing.
- The ultimate beneficial owner behind the Anil Agarwal Discretionary Trust. The country of registration of the trust and of Conclave PTC Limited is not stated in the shareholding pattern.
- Supplier concentration and raw-material sourcing. Not disclosed at all.
- Segment-level order book split between the AI data-centre award, the BSNL-type domestic contracts and the rest of the ₹18,618 crore.
- Like-for-like FY23/FY24 comparatives excluding the demerged services business. We have not restated them and neither, in the summary tables, has the data source; treat multi-year growth rates spanning 31 March 2025 with care.
- Directors' other directorships — we did not pull the MCA director-master data for each board member, so we make no claim about the wider directorship web beyond the promoter-group entities the shareholding pattern itself names.
What would change the picture
- The Fourth Circuit ruling in the Prysmian appeal. This is the single largest binary item in the file — roughly 39% of net worth, currently unprovided.
- The FY27 customer-concentration note. Does "no customer above 10%" survive the US$1.11 billion award? The answer arrives in next year's accounts.
- The next two quarterly results. Q1 FY27's 20.8% EBITDA margin is a twenty-quarter high. Whether it holds at higher volumes is the whole question.
- Warrant conversion. 4.53 crore warrants at ₹110 are exercisable over 18 months from allotment. Watch the shareholding pattern for the promoter stake moving toward the indicated 48.99%.
- ASM status. Exit from Stage IV, or further escalation, is published by the exchanges and is checkable weekly.
- The inventory line. 139 days and rising. If revenue accelerates and inventory days fall, that is execution; if both rise together, it is worth a second look.
- Execution against the ₹3,000 crore capex and the stated ₹20,000 crore FY29 revenue ambition — against a company that did ₹4,745 crore in FY26.
Sources
- Sterlite Technologies Annual Report FY2025-26 — auditor's report and Emphasis of Matter, Note 37 (subsidiaries and countries of incorporation), Note 39(4)–(6) (litigation and guarantees), Notes 32–34, geographical revenue, plant locations, credit-rating table, related-party notes.
- Shareholding pattern, quarter ended 30 June 2026 — promoter chain, encumbrance answers, warrants outstanding, category-wise holdings.
- Q1 FY27 audited/limited-review financial results.
- STL press release: Q1 FY27 results — order book, EBITDA margin, US$1.11 bn award, net-debt-free statement.
- Subsidiaries' financial statements, FY26.
- FY26 / Q4 FY26 financial results.
- BSE/NSE ASM & GSM status history for STLTECH — Long-Term ASM Stage IV, active from 11 May 2026.
- CRISIL Ratings — Sterlite Technologies Limited rating rationale.
- BSE filing — preferential issue of convertible warrants, 7 February 2026.
- Business Standard — board clears promoter warrant issue (market price on approval day).
- Business Standard — QIP launch at ₹613.69 floor price, 25 June 2026.
- STL press release — completion of the Global Services Business demerger.
- STL press release — Sterlite Technologies Inc. to appeal the South Carolina verdict.
- Screener.in — Sterlite Technologies consolidated financial series and ratios (cross-checked against the annual reports).
- Screener.in — HFCL Limited (peer multiples).
FAQ
Why is Sterlite Technologies under ASM Stage IV? The Additional Surveillance Measure is triggered by objective price and volume thresholds set by SEBI and the exchanges, not by any view on the company's accounts. STL entered Long-Term ASM Stage I on 11 February 2026 and reached Stage IV on 11 May 2026, alongside a roughly 554% one-year price move. Higher stages carry a 100% margin requirement and trade-for-trade settlement. It is not a finding of wrongdoing.
Is any promoter holding pledged? No. The shareholding pattern for the quarter ended 30 June 2026 answers "No" to pledge, non-disposal undertaking and any other encumbrance, and the same holds for every quarter from March 2024 onwards.
What is the US$101.25 million litigation about? Prysmian Cables and Systems USA sued STL's US subsidiary and a former employee over alleged breach of non-compete and confidentiality agreements. A jury awarded US$96.5 million against the subsidiary in August 2024; the court confirmed it in August 2025, taking the total to US$101.25 million with fees. The subsidiary has appealed to the Fourth Circuit and posted a US$41.53 million bond. STL itself is not a party, no provision has been made, and the accounts state the ultimate implications cannot be ascertained. The auditor flagged it as an Emphasis of Matter while issuing an unmodified opinion.
Why did revenue fall so much between FY23 and FY25? Two things happened at once: a global optical fibre and cable downturn, and the demerger of the Global Services Business into STL Networks Limited with effect from 31 March 2025. Multi-year growth rates spanning that date are not like-for-like.
Who ultimately controls the company? The immediate holding company is Twin Star Overseas Limited, registered in Mauritius, holding 42.90%. Above it, the shareholding pattern lists Vedanta Incorporated (erstwhile Volcan Investments Limited), Conclave PTC Limited and the Anil Agarwal Discretionary Trust as overseas corporate bodies with nil direct holding. The FY26 accounts separately identify Vedanta Incorporated as Bahamas-registered. The ultimate beneficiary behind a discretionary trust is not identifiable from public records.
What does the June-2026 quarter actually tell us? Revenue of ₹1,910 crore was up 87% year on year with a 20.2% operating margin, the highest in about twenty quarters, and only 4.7% of pre-tax profit came from other income — a materially cleaner mix than the prior two quarters. The +1,870% PAT growth headline is off a near-zero base and should not be read as a growth rate.
Independent research for education and discussion only. Not investment advice, not a recommendation, and not a rating — we issue no buy/sell calls and no target prices. Every figure is sourced from the primary documents linked above; figures can be restated and we can make mistakes, so always verify against the original. Nothing here alleges wrongdoing by any company or individual: where a fact raises a question we state the fact, cite it, and give the benign explanation alongside. Offshore holding structures, pledging and preferential allotments are all legal and common — they are disclosed here as facts, not as accusations.
This article is for educational and informational purposes only. It is not financial advice, investment recommendation, or a solicitation to buy or sell securities. Investing involves significant risks. I am not a SEBI-registered investment advisor. Readers should consult their own financial advisor and conduct their own research before making any investment decisions.
Comments
Join the conversation
Sign in to join the conversation.
Follow replies, add your view, and take part in the discussion.
Sign in to commentLoading comments...