

US retail sales fall 0.6% in July — the sharpest drop in over a year, and it isn't just cars
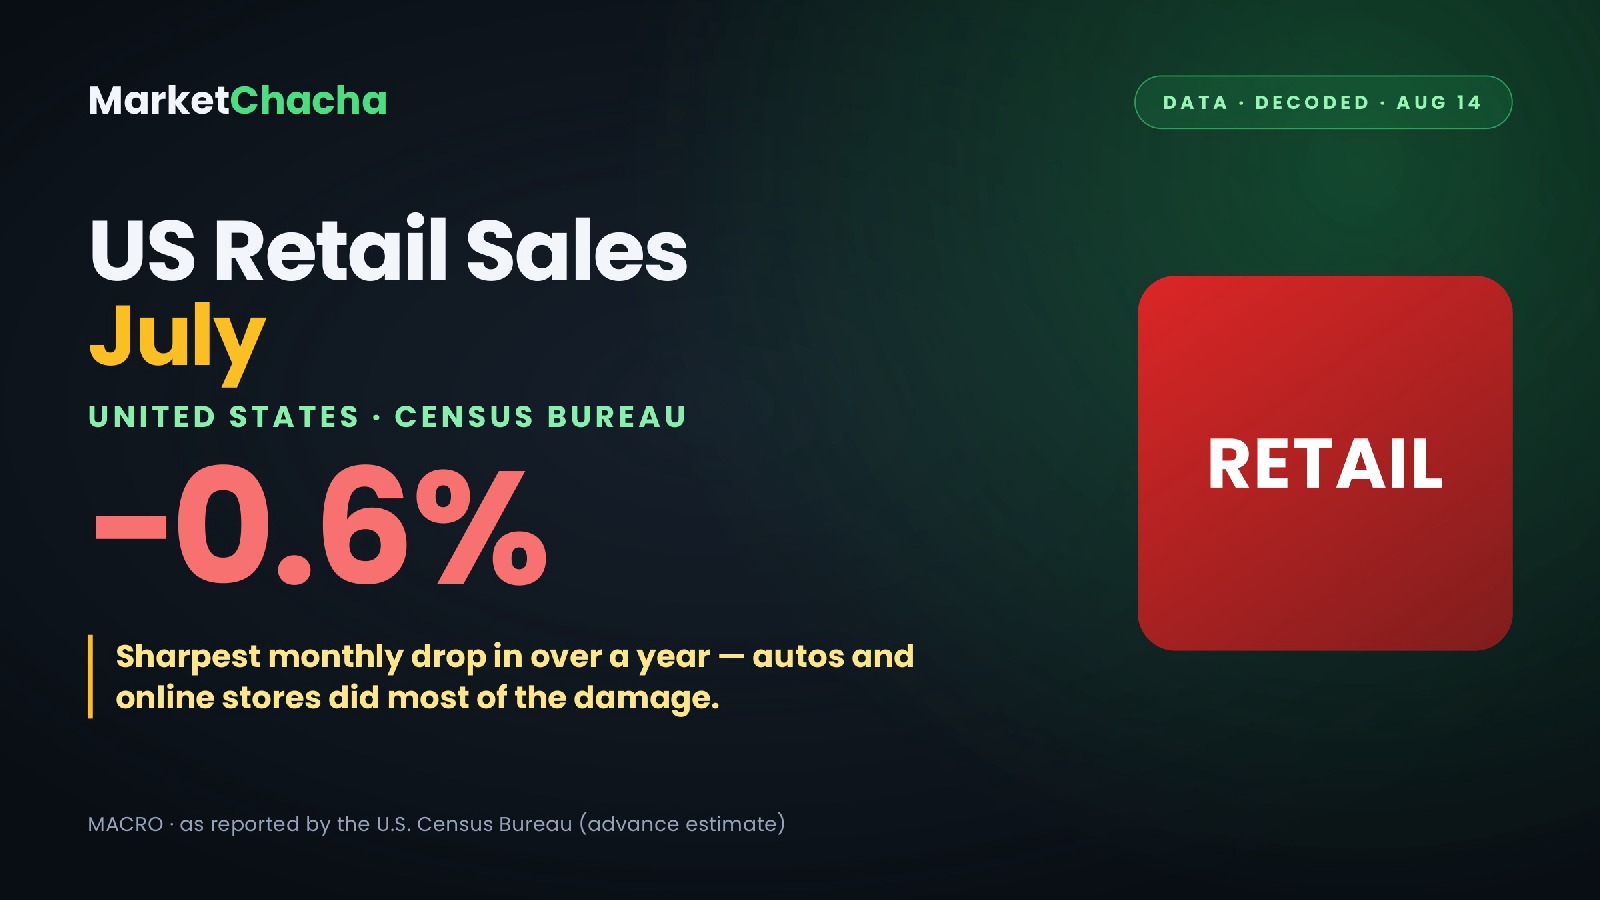
The American consumer just took a step back. US retail and food services sales fell 0.6% in July to $763.6 billion, according to the advance estimate released this morning by the US Census Bureau. Economists had penciled in a small gain — roughly +0.1% to +0.3%. Bloomberg called it the sharpest monthly drop in more than a year.
The numbers
Straight from the Census release (seasonally adjusted, advance estimate):
- Headline: -0.6% MoM (±0.4) vs +0.2% in June, which was left unrevised. Year-on-year: +5.0%.
- Excluding autos: -0.3%. Excluding autos and gas (the cleaner read): -0.2%.
- Motor vehicles & parts: -1.8% — auto and other motor vehicle dealers alone were -2.0%.
- Nonstore retailers (online): -2.2%, the single biggest drag outside cars — though still +7.7% YoY.
- Gasoline stations: -0.9% MoM but +16.2% YoY — that YoY number is pump prices, not more driving.
- Not everything cracked: clothing +1.9%, health & personal care +0.7%, restaurants and bars +0.5%, building materials +0.3%, general merchandise +0.3%. Groceries were flat at -0.1%.
- Three-month view (May–July): +6.3% YoY, so the trend is still up. One month doesn't make a recession.
What it means
Two things people constantly get wrong about this report, and both matter today.
One: these are nominal dollars. Census says it plainly — the data is adjusted for seasonality and trading days, but not for price changes. With July CPI running at 3.4%, that headline +5.0% YoY shrinks to something closer to 1.5% once you strip out inflation. Americans are spending more money for not that much more stuff.
Two: this is an advance estimate built from a subsample of about 4,800 firms, then benchmarked up to a universe of three million. Census itself publishes the revision history — the median absolute revision to the month-on-month change is around 0.1 percentage point. So the direction is real, the decimal isn't gospel.
The shape of the miss is the interesting part. Cars and e-commerce did the damage. Both are exactly where a nervous household defers: you can put off replacing the car and you can leave the cart unchecked-out. Restaurants and clothing — small, immediate, feel-good spending — held up. That's the signature of a consumer trimming big-ticket decisions, not one running out of money.
Who it touches
- The Fed. This lands right after July CPI at 3.4% and a soft PPI print. A cooling consumer strengthens the case of the doves on the committee — weak demand does the disinflation work that rate hikes would otherwise have to do.
- Big-box and discretionary retail. Q2 earnings season for US retailers is running right now, and this print sets the mood music for guidance commentary on the back half.
- E-commerce. A -2.2% month in nonstore is loud given how reliably that category has been the growth engine. Watch whether it was a genuine pullback or a July promotional-calendar shift.
- Autos and auto lenders. Two straight soft months in vehicle sales tends to show up later in dealer inventory, incentives, and loan volumes.
- Bond and rate-sensitive equities. Softer demand data typically pulls yields down, which is oxygen for long-duration growth names, housing-linked stocks, and anything financed with floating debt.
- Staples vs discretionary. When groceries hold flat and cars fall 2%, the defensive-versus-cyclical trade inside consumer indices starts to matter again.
What to watch
Three checkpoints. First, the August retail sales report on September 16 — Census confirmed the date in today's release. A second negative month turns "blip" into "trend." Second, revisions: the preliminary September 28 revision will tell you whether -0.6% survives contact with the full sample. Third, the September FOMC — this print is now part of the case being argued in that room, alongside CPI, PPI and payrolls.
One month of weakness in a series that has grown for most of the past year isn't a turning point. But it's the first month in a while where the consumer, the last reliably strong leg of the US economy, blinked.
As of 9:15 AM ET, Aug 14, 2026. Sources: U.S. Census Bureau — Advance Monthly Retail Trade Survey, July 2026, Bloomberg, CNBC (July CPI). For discussion and education only — not investment advice. Verify before acting.
This article is for educational and informational purposes only. It is not financial advice, investment recommendation, or a solicitation to buy or sell securities. Investing involves significant risks. I am not a SEBI-registered investment advisor. Readers should consult their own financial advisor and conduct their own research before making any investment decisions.
Comments
Join the conversation
Sign in to join the conversation.
Follow replies, add your view, and take part in the discussion.
Sign in to commentLoading comments...