

Mazagon Dock (MAZDOCK): the full file — the numbers, the owners, and what the filings actually show
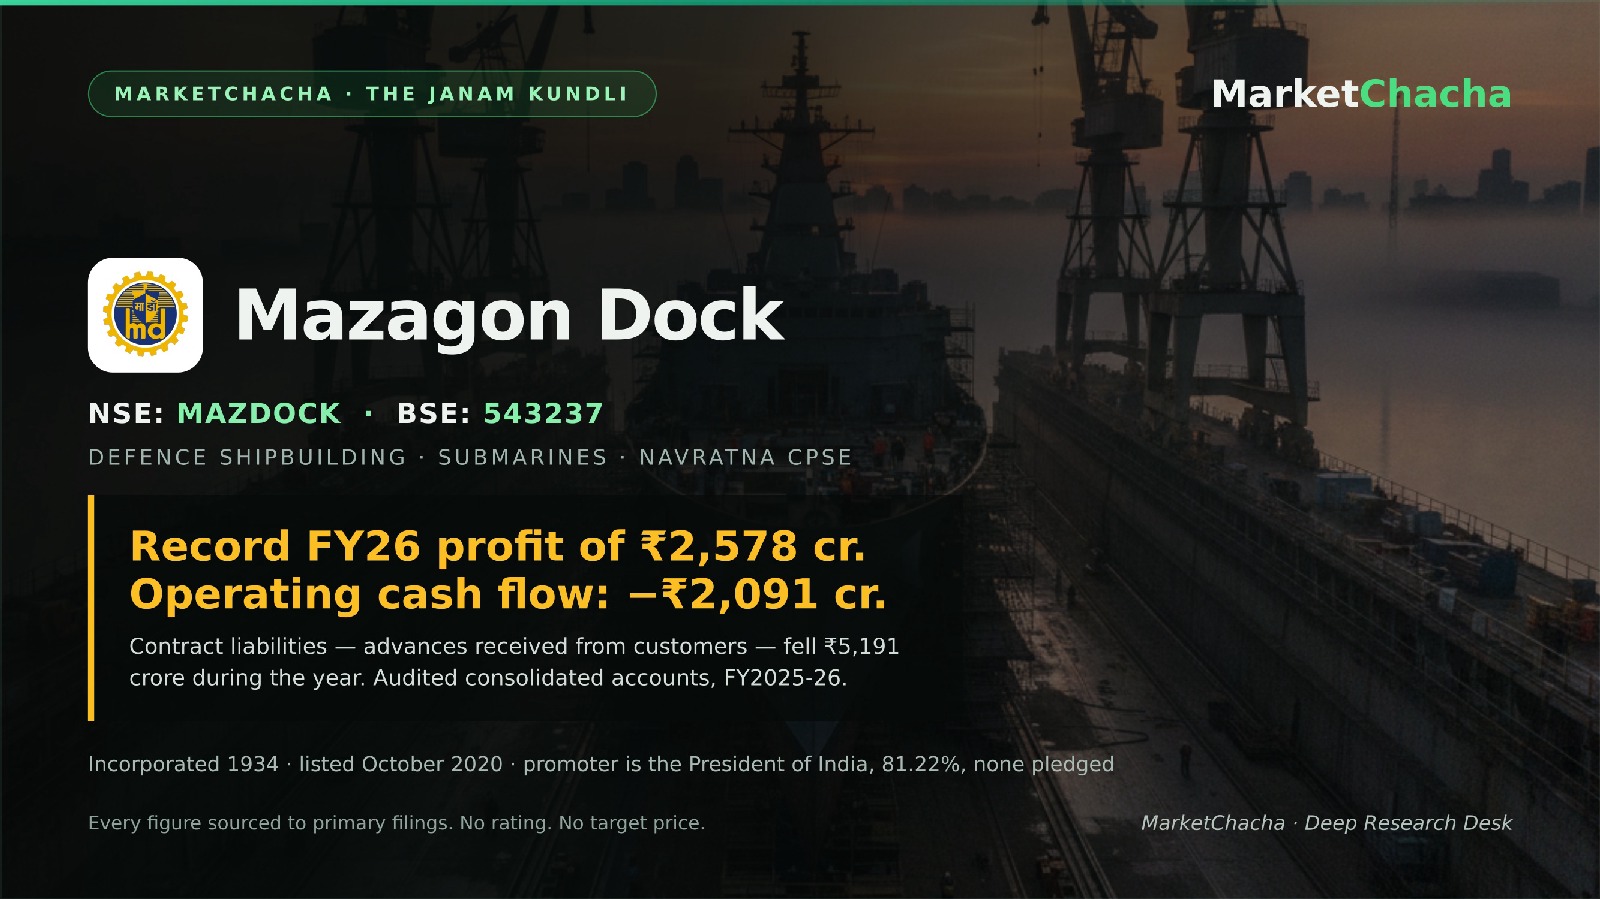
Mazagon Dock Shipbuilders builds warships and submarines for the Indian Navy on a strip of Mumbai waterfront, and repairs and refits them afterwards. It gets paid in stages against long contracts, which means it collects large advances years before it delivers anything.
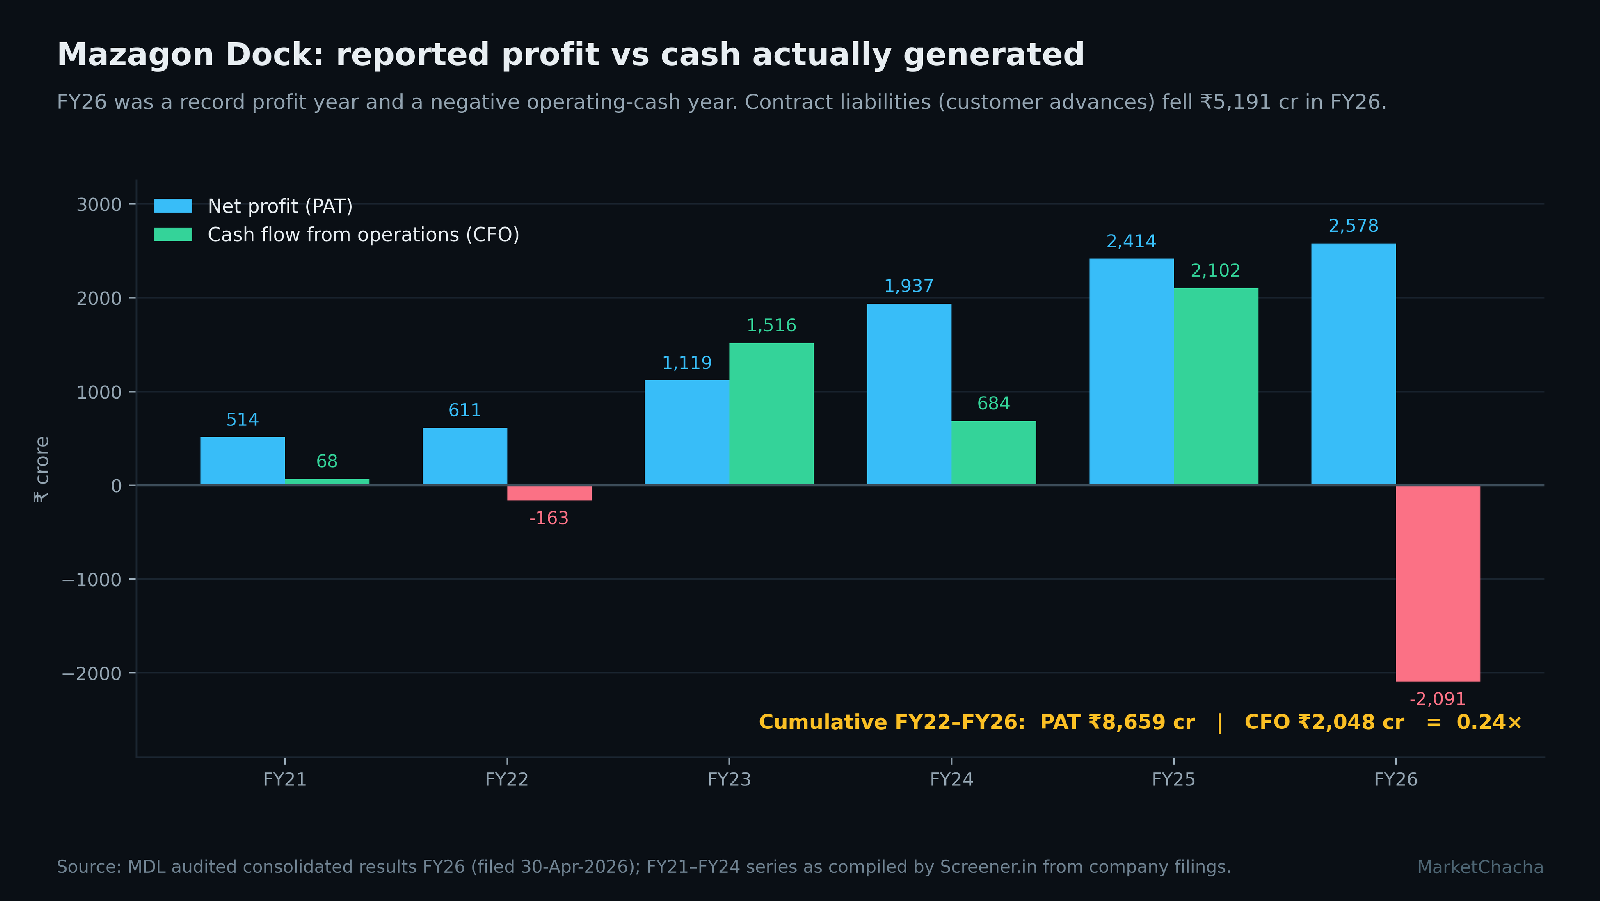
That last sentence is the whole file in miniature. In FY2025-26 the company reported its highest-ever consolidated profit, ₹2,578 crore, and its worst-ever operating cash flow, minus ₹2,091 crore. Both numbers come from the same audited statement, and the bridge between them is a single balance-sheet line that fell ₹5,191 crore. Everything below is what the filings show, with the arithmetic in the open.
Origin — the company's birth certificate
The yard traces to a dry dock established at Mazagon in 1774 and passed through a succession of British shipping companies before being registered as Mazagon Dock Limited on 26 February 1934. Its corporate identity number, L35100MH1934GOI002079, still carries that year and marks it as a union government company registered in Maharashtra. It was nationalised in 1960 and has been a defence public-sector undertaking under the Ministry of Defence ever since. The present name, Mazagon Dock Shipbuilders Limited, followed later; the company was awarded Navratna status in 2024, becoming the eighteenth CPSE to hold it.
It listed on 12 October 2020 through a pure offer for sale by the Government of India — 3.05 crore shares at ₹145, with no money coming to the company. The issue was subscribed 157.4 times and the stock opened at ₹216.25 on the BSE, a 49% premium. Adjusted for the December-2024 sub-division, that ₹145 issue price is ₹72.50; the shares were ₹2,474 on 3 September 2026.
The business — what they actually sell
Two operating divisions: shipbuilding (destroyers, stealth frigates, corvettes, patrol and coast guard vessels, offshore platforms) and submarine and heavy engineering (Scorpene-class construction, refits, and heavy fabrication). The programmes named in the Q1 FY27 investor presentation are Project 15B destroyers, Project 17A stealth frigates, Project 75 Kalvari-class submarines, Indian Coast Guard vessels, and platforms for ONGC.
The company does not publish segment financials. The results filing states it is exempted from segment reporting under notification S.O.802(E) dated 23 February 2018, which exempts defence-equipment producers. A reader therefore cannot see the margin on submarines versus surface ships, and cannot see it for any year. That is a disclosure gap created by a government notification, not by the company.
Who actually buys from them
The Ministry of Defence, overwhelmingly. The company does not publish a customer-concentration percentage, and we could not find one in any primary filing. What is disclosed is the composition of the order book: the Q1 FY27 presentation lists Project 15B, Project 17A, Project 75, Indian Coast Guard vessels, ONGC platforms and a small commercial slice including the Shipping Corporation of India. Every large line is a government or state-owned counterparty.
This produces an unusual structural fact worth stating plainly: the promoter and the principal customer are the same party — the Government of India, holding 81.22% of the equity through the President of India while the Ministry of Defence places the orders. Ind AS 24 grants government-related entities an exemption from itemised related-party disclosure, so a related-party note of the kind you would read for a private group does not exist here in comparable form.
The order book is the number to watch. As at 30 June 2026 it stood at ₹18,218 crore. Against FY26 revenue of ₹13,006 crore that is 1.40 years of work. At the end of Q4 FY24 the same figure was reported at ₹38,561 crore. The order book has therefore roughly halved in two years while revenue rose 37%. The benign reading is straightforward and is the one management has pointed to: large defence contracts are awarded in lumps, and the company has publicly described a pipeline including Project 75 add-ons and P-75I. An order book falls when you execute faster than you win, and it refills on the day a single contract is signed.
Where it is actually made — plants and supply chain
All construction is on the Mumbai waterfront. The Q1 FY27 presentation describes 3 dry docks, 3 wet basins, 3 large slipways and 6 small slipways, plus dedicated submarine and fabrication infrastructure, with stated capacity to build 11 submarines and 10 warships concurrently. Additional yards at Alcock and Nhava on the mainland handle offshore platform work.
What is not disclosed: there is no published list of key suppliers, no single-source dependency disclosure, and no import-content breakdown in the results filings we could access. For a submarine programme built under licence, the technology partner is a matter of public record, but the commercial dependency is not quantified anywhere we could verify. We flag the absence rather than fill it.
Five years of numbers
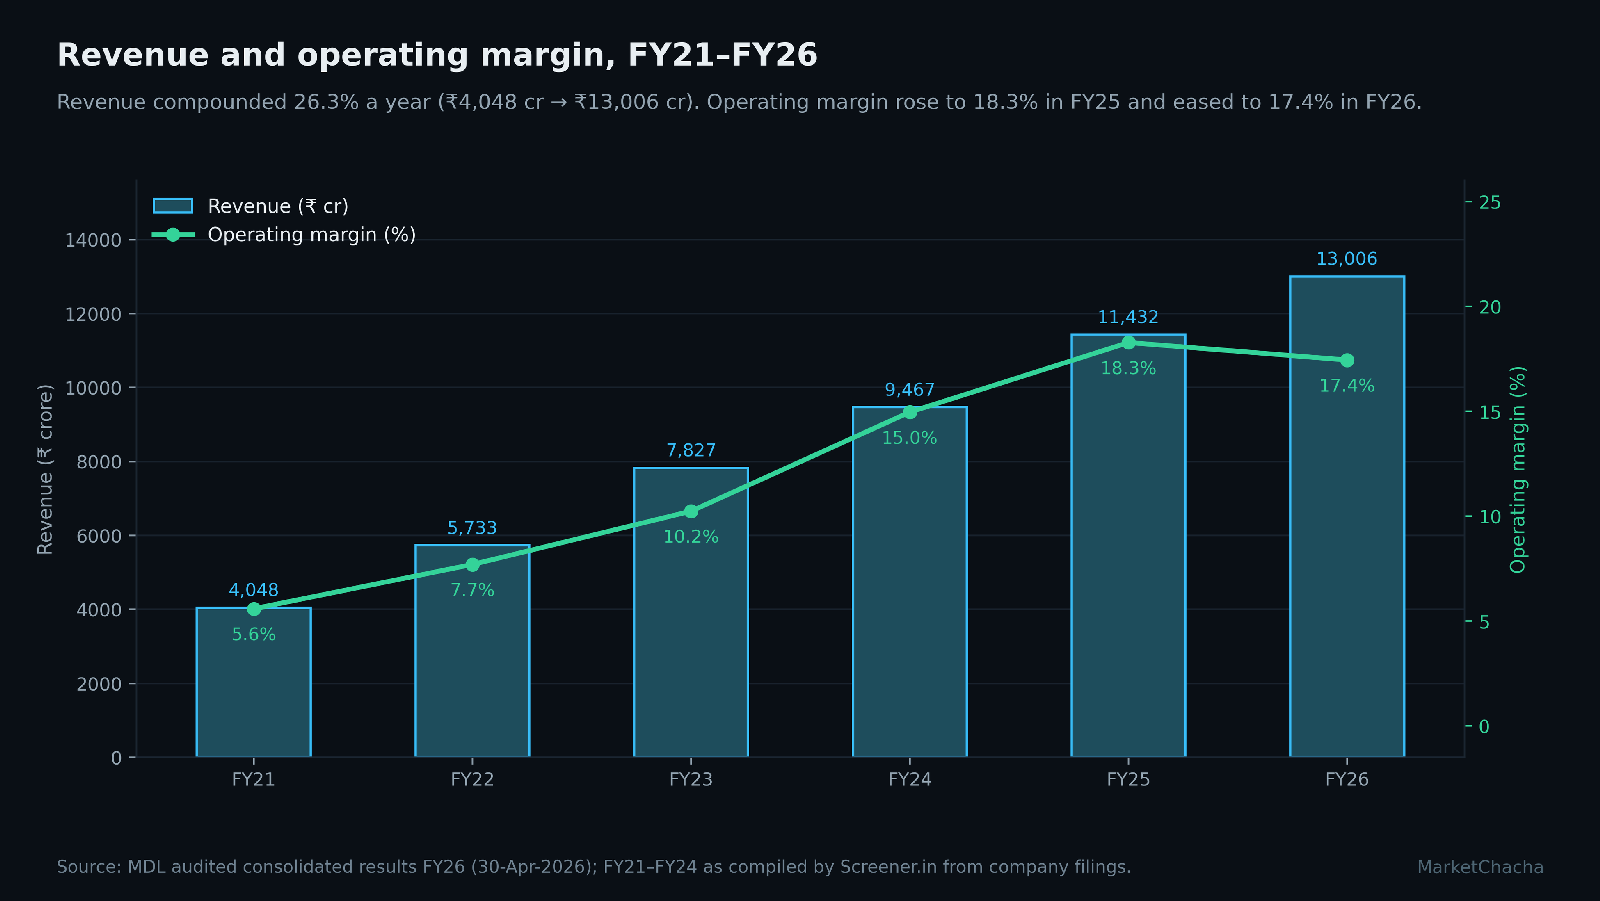
| ₹ crore | FY21 | FY22 | FY23 | FY24 | FY25 | FY26 |
|---|---|---|---|---|---|---|
| Revenue | 4,048 | 5,733 | 7,827 | 9,467 | 11,432 | 13,006 |
| Operating profit | 226 | 441 | 801 | 1,416 | 2,089 | 2,268 |
| Operating margin | 5.6% | 7.7% | 10.2% | 15.0% | 18.3% | 17.4% |
| Other income | 448 | 396 | 687 | 1,101 | 1,112 | 1,139 |
| Profit before tax | 604 | 749 | 1,403 | 2,425 | 3,062 | 3,237 |
| Net profit | 514 | 611 | 1,119 | 1,937 | 2,414 | 2,578 |
| Cash from operations | 68 | -163 | 1,516 | 684 | 2,102 | -2,091 |
The arithmetic. Revenue ₹4,048 cr → ₹13,006 cr is 3.21× in five years, a 26.3% CAGR. Net profit ₹514 cr → ₹2,578 cr is 5.02×, a 38.1% CAGR. EPS on the same split-adjusted basis went ₹12.74 → ₹64.04, 5.03×. On price, Screener.in computes a five-year CAGR of 81%; compounded that is roughly 19.4×, or about +1,840% over five years. The most recent year has run the other way: Screener puts the one-year price change at −9% as at 3 September 2026, against a 52-week range of ₹2,057–₹3,061.
Income statement — FY26 vs FY25, consolidated (from the audited results filed 30 April 2026):
| ₹ crore | FY26 | FY25 | Change | % |
|---|---|---|---|---|
| Revenue from operations | 13,008 | 11,432 | +1,576 | +13.8% |
| Cost of materials consumed | 5,700 | 4,531 | +1,170 | +25.8% |
| Purchases of stock-in-trade | 1,639 | 1,152 | +487 | +42.3% |
| Sub-contract | 1,017 | 1,321 | −304 | −23.0% |
| Employee benefits | 983 | 979 | +4 | +0.4% |
| Other expenses | 1,045 | 643 | +402 | +62.6% |
| Provisions | 356 | 717 | −361 | −50.3% |
| EBITDA (margin) | 2,268 (17.4%) | 2,089 (18.3%) | +178 | +8.5% |
| Other income | 1,139 | 1,112 | +28 | +2.5% |
| Finance costs | 72 | 24 | +48 | +197.3% |
| Depreciation & amortisation | 97 | 115 | −19 | −16.1% |
| Profit before tax | 3,237 | 3,062 | +175 | +5.7% |
| Tax | 815 | 784 | +31 | +3.9% |
| Net profit (net margin) | 2,578 (19.8%) | 2,414 (21.1%) | +165 | +6.8% |
| EPS | ₹64.04 | ₹59.83 | +₹4.21 | +7.0% |
Balance sheet — 31 March 2026 vs 31 March 2025, consolidated:
| ₹ crore | FY26 | FY25 | Change | % |
|---|---|---|---|---|
| Net worth (incl. non-controlling interest) | 9,984 | 7,940 | +2,044 | +25.7% |
| Contract liabilities (customer advances) | 10,303 | 15,494 | −5,191 | −33.5% |
| Trade payables | 4,513 | 3,738 | +774 | +20.7% |
| Long-term provisions | 1,408 | 787 | +621 | +79.0% |
| Inventories | 2,517 | 4,537 | −2,020 | −44.5% |
| Trade receivables (current) | 2,606 | 1,067 | +1,538 | +144.2% |
| Cash and bank balances | 13,096 | 16,150 | −3,053 | −18.9% |
| Property, plant & equipment | 1,395 | 774 | +621 | +80.2% |
| Total assets | 27,458 | 28,708 | −1,250 | −4.4% |
Cash flow — FY26 vs FY25, consolidated:
| ₹ crore | FY26 | FY25 | Change |
|---|---|---|---|
| Cash from operations (CFO) | −2,091 | 2,102 | −4,193 |
| Cash from investing (CFI) | 1,209 | −1,299 | +2,508 |
| Cash from financing (CFF) | −1,124 | −434 | −691 |
| Capex (PPE + CWIP) | 176 | 805 | −629 |
| Free cash flow (CFO − capex) | −2,267 | 1,297 | −3,564 |
The material variances. Five lines carry FY26. Cost of materials rose 25.8% against revenue up 13.8%, and purchases of stock-in-trade rose 42.3% — input cost grew faster than sales, and EBITDA margin fell from 18.3% to 17.4%. Against that, the provisions charge halved, from ₹717 cr to ₹356 cr, adding ₹361 cr back to profit. Strip provisions out of both years and pre-provision EBITDA fell 6.5%, from ₹2,807 cr to ₹2,624 cr, and the pre-provision margin fell from 24.6% to 20.2%. On the balance sheet, five lines moved more than 40%: contract liabilities −33.5% (the driver of the cash flow), inventories −44.5%, receivables +144.2%, cash −48.3% at the "cash and cash equivalents" level, and PPE +80.2% — the last two reflecting the consolidation of Colombo Dockyard from FY26. Long-term provisions rose 79%.
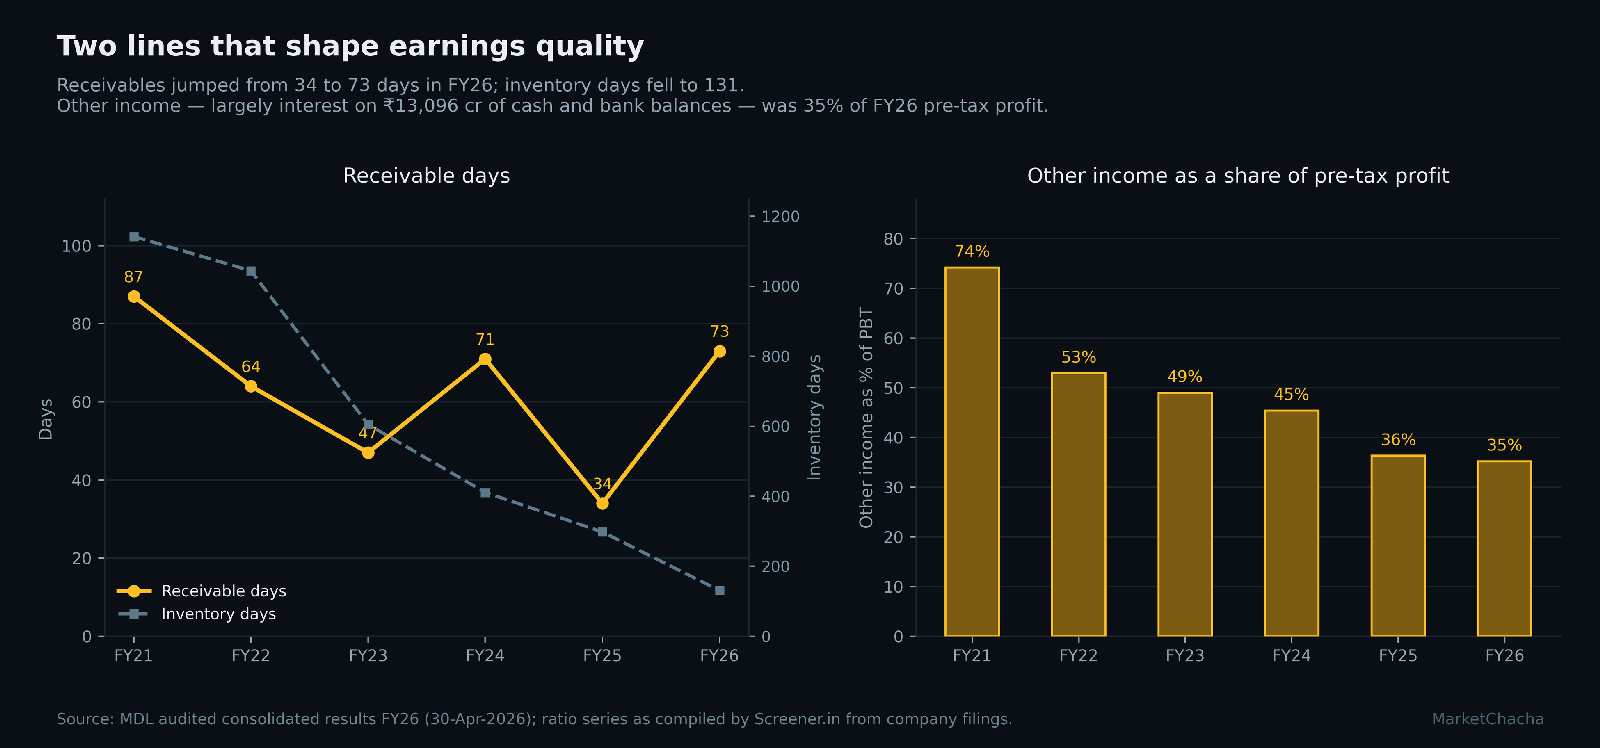
Earnings quality. PBT rose ₹175 cr. The provisions line alone moved ₹361 cr in profit's favour, and other income contributed ₹1,139 cr — 35.2% of pre-tax profit. On the numbers as filed, the increase in reported PBT is fully accounted for by the lower provision charge; the operating business before provisions produced less profit in FY26 than in FY25 on 13.8% more revenue.
The latest quarter, decoded
| ₹ crore (consolidated) | Q1 FY27 | Q4 FY26 | QoQ | Q1 FY26 | YoY |
|---|---|---|---|---|---|
| Revenue from operations | 2,943 | 3,850 | −23.6% | 2,626 | +12.1% |
| Cost of materials | 949 | 1,826 | −48.0% | 891 | +6.5% |
| Employee benefits | 289 | 213 | +35.9% | 250 | +15.7% |
| Provisions | 30 | −193 | n.m. | 540 | −94.5% |
| Finance costs | 44 | 10 | +343.0% | 35 | +25.4% |
| Other income | 313 | 283 | +10.5% | 324 | −3.2% |
| Profit before tax | 686 | 793 | −13.5% | 567 | +21.1% |
| Net profit | 550 | 674 | −18.3% | 452 | +21.7% |
| EPS | ₹13.62 | ₹16.83 | −19.1% | ₹11.21 | +21.5% |
The reported quarter looks strong: revenue +12.1% and profit +21.7% year on year. The decode is in one line. The provisions charge was ₹30 cr this quarter against ₹540 cr in the year-ago quarter — a ₹511 crore swing in profit's favour, against a total PBT increase of ₹120 crore. Removing provisions from both quarters, pre-provision EBITDA fell 43.4%, from ₹842 cr to ₹476 cr, and the pre-provision margin fell from 32.1% to 16.2%. Other income of ₹313 cr was 45.6% of pre-tax profit, up from 35.7% in the March quarter.
The benign explanation, and it is a real one: in percentage-of-completion shipbuilding, the provision line carries warranty estimates, liquidated damages and onerous-contract charges on multi-year contracts. These are re-estimated periodically and are lumpy by design, so a single quarter's provision charge is not a run-rate and a year-ago comparison of that line tells you about the timing of estimate revisions, not about the current quarter's trading. The FY24 auditor's report noted ₹915.52 crore of liquidated damages deducted from contract revenue in that year alone, which gives a sense of the scale these adjustments reach.
Who owns it — and where those owners are registered
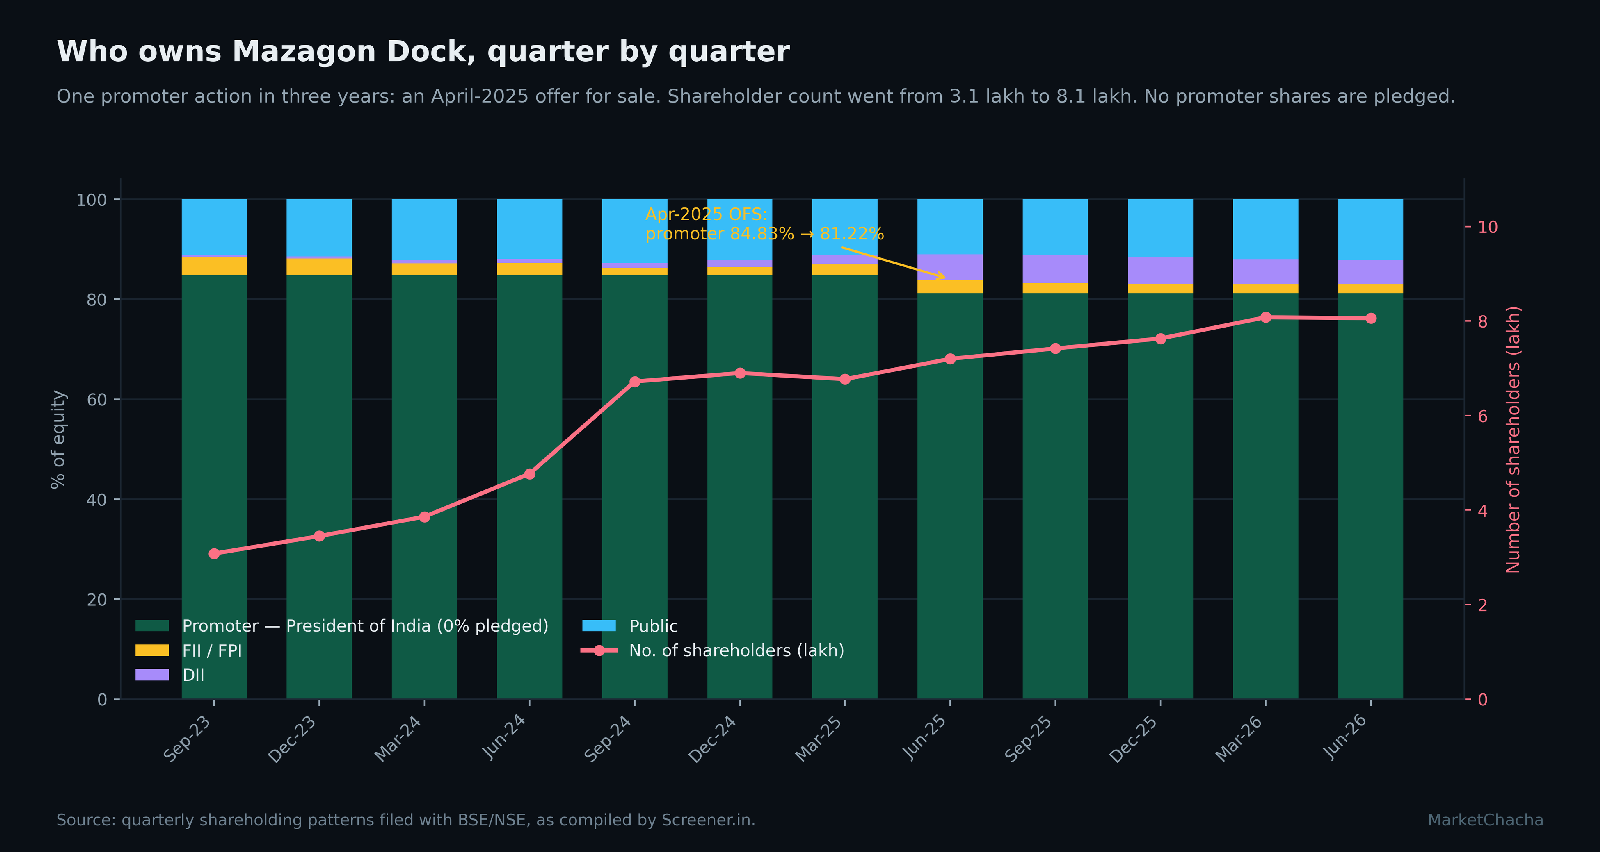
The promoter is the President of India, acting through the Ministry of Defence, at 81.22% as at 30 June 2026. No promoter shares are encumbered — there is no pledge line in the shareholding pattern, which for a sovereign promoter is what one would expect, and it removes an entire category of risk that dominates many Indian mid-caps.
One promoter action in three years. In an offer for sale on 4–7 April 2025, the government offered a base 1,14,10,366 shares (2.83%) with a green shoe of up to 80,67,600 more, a maximum 4.01% of equity, at a floor price of ₹2,525. Non-institutional demand took 1,45,62,318 shares; the retail portion drew 1,127 shares, 0.07% of the tranche offered to it. Total shares sold work out to about 3.61% of equity, matching the fall in promoter holding from 84.83% to 81.22% in that quarter. This was a secondary sale: no new shares, no dilution, no money to the company.
On the other side of the register: FII/FPI holding is 1.72% and DII holding 5.02% (June 2026). DII holding jumped from 1.69% to 5.21% in the June-2025 quarter — the quarter of the OFS. As at June 2025 the pattern showed Life Insurance Corporation of India at 3.27%, insurance companies collectively 3.56% across 19 entities, mutual funds 1.55% across 28 schemes, and FPI Category I 2.49% across 184 investors. No single foreign portfolio investor is separately disclosed above 1%, so there is no named offshore holder to trace. The number of shareholders went from 3.08 lakh in September 2023 to 8.06 lakh in June 2026, a 2.6× broadening of the register.
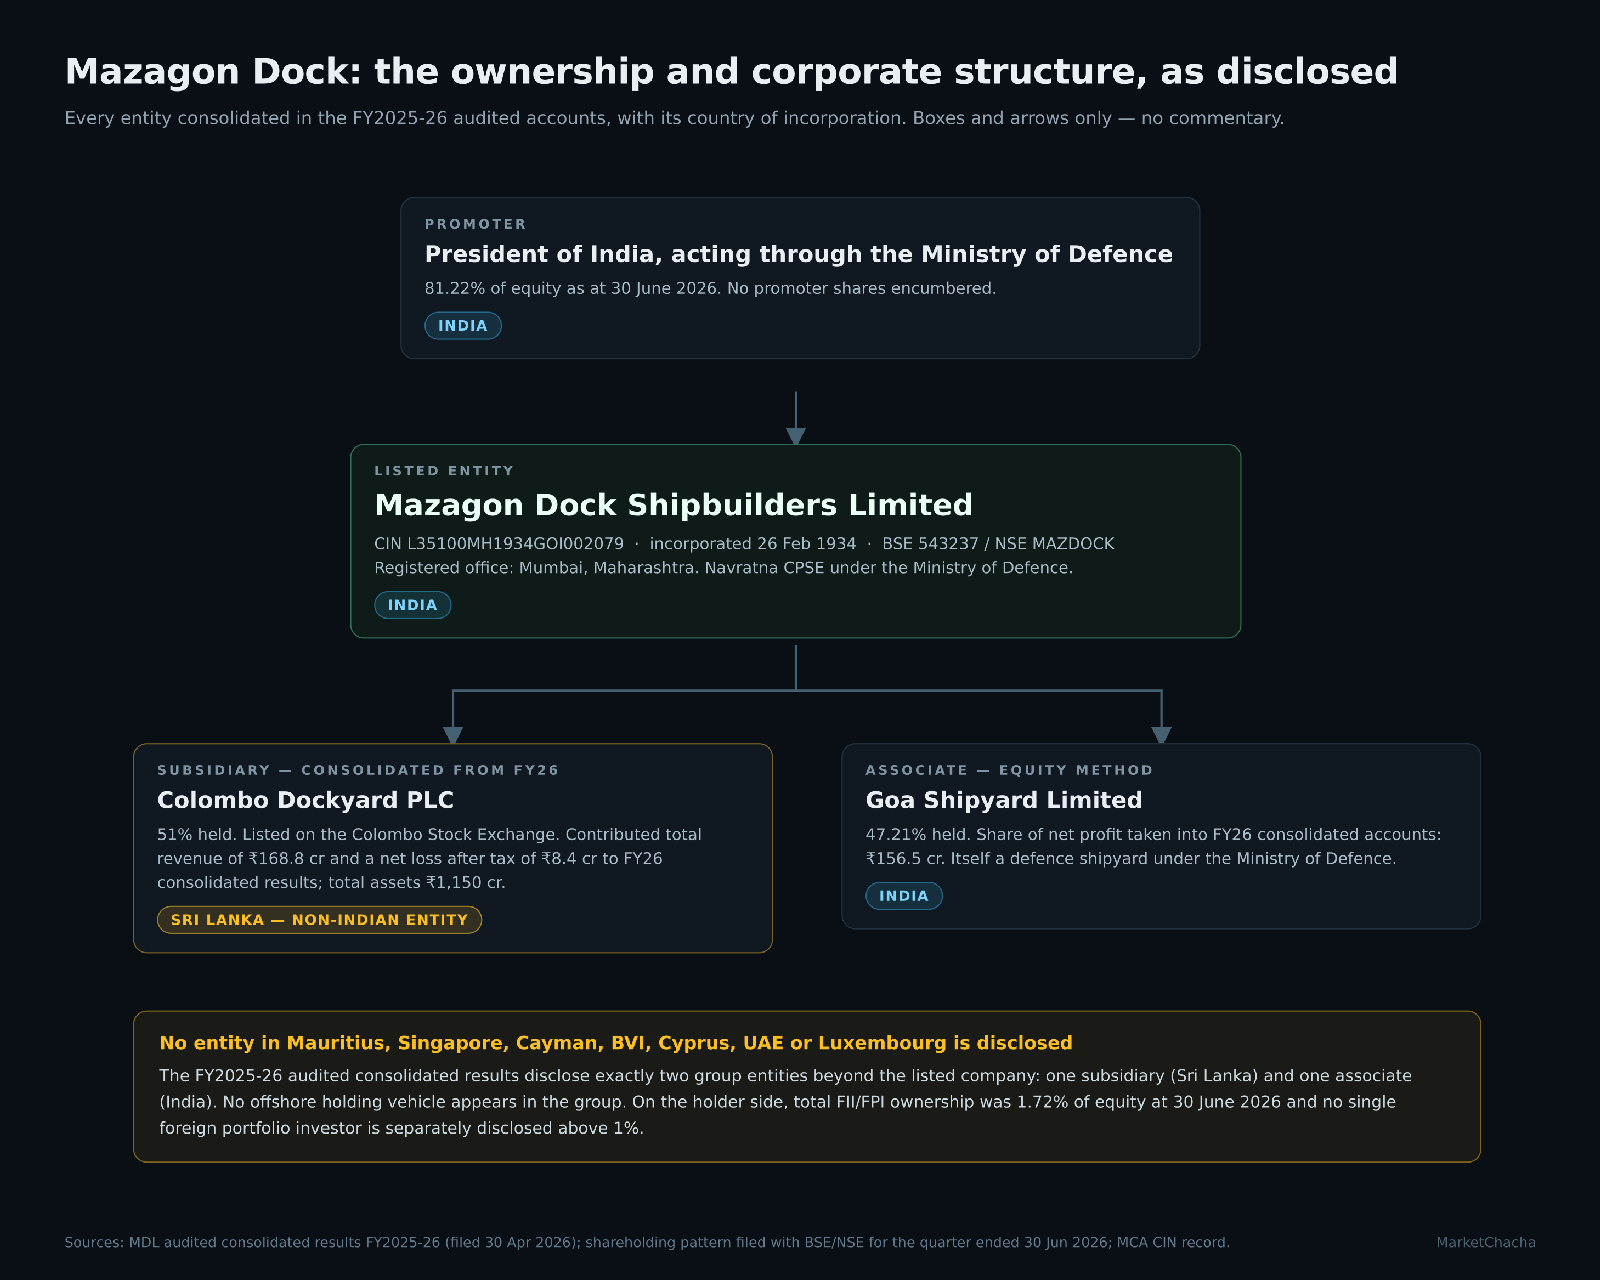
The jurisdiction chain. The FY26 consolidated accounts disclose exactly two group entities beyond the listed company. Colombo Dockyard PLC, incorporated in Sri Lanka and listed on the Colombo Stock Exchange, is a 51% subsidiary consolidated from FY26; it contributed total revenue of ₹168.8 cr, a net loss after tax of ₹8.4 cr, and total assets of ₹1,150 cr, with non-controlling interest of ₹229 cr recognised. Goa Shipyard Limited, incorporated in India, is a 47.21% associate accounted for by the equity method, contributing ₹156.5 cr of profit share. There is no entity in Mauritius, Singapore, Cayman, BVI, Cyprus, UAE or Luxembourg anywhere in the disclosed group. A clean, almost entirely domestic structure is a verified finding, not an omission, and it is worth saying so as plainly as one would say the opposite.
Capital history — every time they raised money
Short list, and the shortness is the point. IPO, October 2020: 3.05 crore shares at ₹145, entirely an offer for sale by the Government of India, no proceeds to the company; listed 12 October 2020 at ₹216.25. Sub-division, December 2024: face value ₹10 split 1:2 into ₹5, ex-date 27 December 2024, which the company said was to comply with DIPAM guidelines and improve liquidity. Offer for sale, April 2025, described above.
Everything else is absent, and the balance sheet proves it: equity share capital has been ₹201.69 crore in every year from FY21 to FY26. That arithmetic rules out any bonus issue, rights issue, QIP, preferential allotment, warrant conversion or buyback in the entire five-year window. Shares outstanding are 40.34 crore. There has been no dilution of any kind. Dividends have been paid throughout at a 28–29% payout; FY26 comprised interim dividends of ₹6.00 and ₹7.50 per share plus a recommended final of ₹4.62.
Who runs it, and the wider web
Capt. Jagmohan, IN (Retd.) has been Chairman and Managing Director since 21 April 2025. The functional board is Biju George (Operations, since October 2021), Cdr. Vasudev Puranik, IN (Retd.) (Corporate Planning & Personnel, since June 2022), Ruchir Agrawal (Finance), and Cmde S. B. Jamgaonkar (Retd.) (Technical, since September 2023). Dinesh Mahur, Additional Secretary (Defence Production), is the part-time official director, and Kedar Nath Gupta is listed as the sole part-time non-official (independent) director.
Auditor. The FY26 statutory auditor is Sarda & Pareek LLP (FRN 109262W/W100673), signing partner Niranjan Joshi, and the audit report attached to the FY26 audited results carries an unmodified opinion with no qualification, no emphasis of matter and no going-concern paragraph, on both standalone and consolidated statements. This is a change: the FY2023-24 auditor was C. R. Sagdeo & Co (FRN 108959W), whose report that year carried an unmodified opinion but four emphasis-of-matter paragraphs — pending registration and renewal of certain leasehold properties, unconfirmed vendor-advance and creditor balances, amounts due from the Indian Navy requiring reconciliation and confirmation, and ₹91,552 lakh (₹915.52 cr) of liquidated damages deducted from contract revenue. The benign and almost certainly correct explanation for the auditor change: statutory auditors of a government company are appointed and rotated by the Comptroller and Auditor General under Section 139(5) of the Companies Act, not chosen by the board or management.
The regulatory and surveillance record
An exchange notice, disclosed by the company. The board recorded at its meeting on 30 April 2026 a notice from the NSE regarding non-compliance with SEBI's Listing Obligations and Disclosure Requirements concerning an inadequate number of independent directors on the board. The company disclosed that it had written to its administrative ministry, most recently on 4 April 2026, requesting the appointment of sufficient independent directors, and remains in contact for updates. Context, and it is the standard one: for a central public-sector enterprise, independent directors are appointed by the administrative ministry, not by the company or its board, so the company cannot itself cure the shortfall. Vacancies of this kind are common across listed CPSEs and the exchanges apply a standard fine schedule; the leadership page shows one part-time non-official director against five whole-time directors, consistent with the notice.
SEBI. We found no SEBI order, settlement or show-cause notice naming Mazagon Dock Shipbuilders, its promoter or its directors. A SEBI penalty reported around the April-2025 offer for sale was levied on a broking firm, not on the company.
Exchange surveillance. MAZDOCK is available for trading in the NSE futures and options segment. We were not able to retrieve the live NSE/BSE ASM or GSM lists in this run and therefore do not assert the current surveillance status either way — readers should check the exchange lists directly.
Credit rating. India Ratings has published press releases on the company's bank facilities, but the pages did not render for us and we could not read the rating symbol, amount or date. We therefore report no rating action, and no "Issuer Not Cooperating" tag, as unverified rather than absent. Separately, MCA records as compiled by a third-party aggregator show an open charge of ₹5,000 crore in favour of SBICAP Trustee Company Limited; we could not open the underlying MCA charge document. Neutral context: a registered charge of this kind for a shipbuilder typically secures non-fund-based facilities such as performance bank guarantees, which are not borrowings and do not appear as debt.
NCLT / IBC. Nothing found. Auditor, CFO or Company Secretary resignations. Nothing found beyond the CAG-driven auditor rotation described above.
Forensic checks — what the accounts show
| Check | What we found | Source | A benign explanation |
|---|---|---|---|
| 1. 5-yr cumulative CFO ÷ PAT | FY22–FY26 CFO ₹2,048 cr ÷ PAT ₹8,659 cr = 0.24×. FY26 alone: CFO −₹2,091 cr against PAT ₹2,578 cr. | Audited FY26 results; Screener series for FY22–FY24 | Contract liabilities fell ₹5,191 cr in FY26 and "other liabilities" fell ₹8,632 cr since FY22. A shipbuilder paid in advance shows cash out when it delivers ships already funded. The cash was collected in earlier years. |
| 2. Cash pile vs interest earned | Cash and bank ₹13,096 cr (FY26) and ₹16,150 cr (FY25); interest income ₹1,026 cr. Implied yield on average balances = 7.02%. | Audited FY26 consolidated balance sheet and cash flow | A market-consistent deposit yield. This check passes cleanly — the cash earns what cash should earn. |
| 3. Implied interest rate on debt | Not computable. MDL standalone reports no borrowings. Consolidated borrowings of roughly ₹440 cr appear only from FY26, on consolidation of Colombo Dockyard. Standalone finance cost still rose from ₹24 cr to ₹59 cr. | Audited FY26 results; Screener | Ind AS charges the unwinding of discount on long-term provisions to finance cost; those provisions rose 79% in FY26. The filing does not break the line down, so we do not assert the cause. |
| 4. Receivable and inventory days | Receivable days 34 → 73 in one year (receivables +144% to ₹2,606 cr). Inventory days 1,142 → 131 over five years. | Audited FY26 balance sheet; Screener ratio series | The counterparty is the Ministry of Defence. Milestone billing on ship deliveries clusters at year-end, and the FY24 auditor separately noted Navy balances pending reconciliation — a timing and reconciliation issue rather than a collectability one, on the face of it. |
| 5. Related-party transactions | Not disclosed in comparable form. The promoter and the dominant customer are the same party. | Results filing; Ind AS 24 | Ind AS 24 exempts government-related entities from itemised related-party disclosure. The gap is created by the standard, not by the company. |
| 6. Promoter pledge / stake trend | Pledge nil. Stake 84.83% → 81.22%, entirely explained by the April-2025 OFS. | Quarterly shareholding patterns | Disinvestment policy. A sovereign promoter does not pledge. |
| 7. Auditor changes / qualifications | C. R. Sagdeo & Co (FY24, four emphasis-of-matter paragraphs) → Sarda & Pareek LLP (FY26, unmodified, none). | FY24 auditor's report; FY26 audited results | CAG appoints and rotates auditors of government companies under s.139(5). The change is not management's to make. |
| 8. Subsidiaries and jurisdictions | One subsidiary (Colombo Dockyard PLC, Sri Lanka, 51%), one associate (Goa Shipyard Limited, India, 47.21%). No offshore holding vehicle. | FY26 consolidated results, consolidation note | An operating shipyard acquired from a Japanese seller, not a holding structure. Ultimate beneficial ownership is not an open question here. |
| 9. Dilution / preferential allotments | None. Equity capital ₹201.69 cr unchanged FY21–FY26. No bonus, rights, QIP, preferential allotment, warrants or buyback. | Balance sheets FY21–FY26 | Nothing to explain. This is as clean as this check gets. |
| 10. Other income as % of PBT | 74% → 53% → 49% → 45% → 36% → 35% (FY21→FY26). Q1 FY27: 45.6%. | Five-year P&L; Q1 FY27 filing | It is interest on cash the customer advanced, so it is arguably part of the economics of the contract. The ratio has fallen every year — operating profit grew into the number rather than the number shrinking. |
| 11. Capex vs depreciation, asset turnover | Capex ₹176 cr vs D&A ₹97 cr (1.8×) in FY26; ₹805 cr vs ₹115 cr (7.0×) in FY25. Asset turnover 0.40× → 0.47×. | FY26 cash flow and balance sheet | Yard expansion is lumpy. FY25 carried a large one-off addition; FY26 normalised. |
| 12. Statement variances | See the FY and quarterly tables above. FY26 PBT +₹175 cr while the provisions line moved +₹361 cr in profit's favour; pre-provision EBITDA −6.5%. Q1 FY27 PBT +₹120 cr YoY while provisions moved +₹511 cr in profit's favour. | Audited FY26 results; Q1 FY27 results | Contract provisions in percentage-of-completion accounting are re-estimated in lumps. Neither period's provision charge is a run-rate. |
Valuation, against a named listed peer, same date and same source. On 3 September 2026 MAZDOCK traded at ₹2,474 — 35.0 times trailing earnings, 10.2 times a book value of ₹242, with ROCE 36% and ROE 29.2%. Cochin Shipyard, also a Ministry of Defence shipyard, traded at ₹1,487 — 57.6 times earnings, 6.7 times a book value of ₹223, with ROCE 16% and ROE 12.5%. We state the numbers and stop there.
What we could not verify
- The FY2025-26 annual report itself. The company's website lists a 5.7 MB PDF but every URL we probed returned the site's HTML page rather than the file. Everything in this report comes from the audited results filing, the quarterly filing, the investor presentation and the shareholding patterns — not from the annual report. That means we have not read the FY26 related-party note, the contingent-liabilities note, the CAG supplementary audit comments under s.143(6)(b), the directors' report, or the full audit report as printed in the annual report (which can carry emphasis-of-matter paragraphs that the results filing's abbreviated report does not).
- Customer concentration as a percentage. Not disclosed anywhere we could find.
- Segment financials. Exempted by government notification.
- Suppliers and single-source dependencies. Not disclosed.
- Current ASM/GSM status. Exchange lists did not render.
- Credit rating. India Ratings pages did not render.
- Colombo Dockyard consideration. Announced at US$52.96 million (reported by media in rupee terms as about ₹452 cr), but the FY26 standalone cash flow shows ₹236.95 cr paid for investment in a subsidiary and non-current investments of ₹242.95 cr at year end. The two figures are not reconciled in any filing we could read. A staged or part-deferred consideration would explain it; we do not assert that it does.
- Employee headcount. Sources we checked disagree materially. Not stated here.
- The FY26 CFO figure itself. The audited consolidated filing shows −₹2,091 cr; Screener's compiled series shows −₹2,654 cr; the audited standalone figure is −₹3,235 cr. We have used the audited consolidated figure throughout and flag the divergence.
- Directors' other directorships. We could not open MCA director records directly and have not stated any.
What would change the picture
- The next order inflow. At ₹18,218 cr the book is 1.4× revenue. A single Project 75 add-on or P-75I award would change that ratio in one announcement; a year without one would compress it further.
- The contract-liabilities line in the next balance sheet. It fell ₹5,191 cr in FY26. Whether it stabilises, keeps falling, or is refilled by advances on new orders determines whether operating cash flow returns to positive.
- Receivables. 73 days from 34. Watch whether the March-2027 balance sheet unwinds it.
- The provisions line. Two consecutive periods have been flattered by a lower charge. A quarter where it normalises will show what the operating margin does unaided.
- The FY26 annual report when it becomes downloadable — specifically the related-party note, contingent liabilities, and the CAG supplementary audit comments.
- Board composition. Whether the Ministry of Defence appoints independent directors and the NSE notice is closed out.
- Colombo Dockyard. It contributed a ₹8.4 cr loss in FY26 and a ₹2.3 cr profit in Q1 FY27. The next few quarters show whether it consolidates as a drag or a contributor.
Sources
- MDL — audited standalone and consolidated financial results for FY2025-26, with auditor's reports (filed 30 April 2026)
- MDL — unaudited financial results for the quarter ended 30 June 2026, with limited review reports
- MDL — investor presentation, Q1 FY2026-27 (30 July 2026)
- MDL — financial information / results archive
- MDL — annual reports listing page
- MDL — board and leadership
- Screener.in — MAZDOCK consolidated financials, ratios and shareholding series
- Screener.in — Cochin Shipyard (peer comparison)
- Business Standard — Mazagon Dock OFS concludes (floor price, tranches, subscription)
- Business Standard — Mazagon Dock IPO listing, 12 October 2020
- Business Today — MAZDOCK ex-date for 1:2 stock split, 27 December 2024
- TipRanks (company announcement) — MDL board addresses NSE notice on independent-director shortfall, 30 April 2026
- India Infoline — MDL auditor's report FY2023-24 (C. R. Sagdeo & Co; emphasis of matter; liquidated damages)
- The Maritime Executive — Mazagon Dock to acquire Colombo Dockyard
- Business Standard — controlling stake in Colombo Dockyard, 27 June 2025
- Prasar Bharati NewsOnAir — consideration of US$52.96 million
- ScanX — Q1 FY27 results and order book of ₹18,218 crore at 30 June 2026
- Business Standard — order book of ₹38,561 crore reported with Q4 FY24 results
- Trendlyne — MDL shareholding pattern detail (LIC, insurance, mutual funds, FPI counts)
- TheCompanyCheck — MCA record: CIN, incorporation date 26 February 1934, paid-up capital, registered charge
- NSE — MAZDOCK derivatives quote (F&O segment availability)
- Wikipedia — Mazagon Dock Shipbuilders (1774 origin, 1960 nationalisation, Navratna status; used for background only)
FAQ
How can Mazagon Dock report a record profit and negative operating cash flow in the same year? Because it is paid in advance. Contract liabilities — advances already received from customers — fell ₹5,191 crore in FY26 as ships funded in earlier years were delivered. Cash left the balance sheet in FY26 for work that was billed and collected earlier. The profit is recognised as work completes; the cash arrived before that.
Is there any promoter pledge? No. The promoter is the President of India, holding 81.22% through the Ministry of Defence, and no promoter shares are encumbered.
Does the company have offshore subsidiaries? One non-Indian entity: Colombo Dockyard PLC in Sri Lanka, a 51% operating shipyard subsidiary listed on the Colombo Stock Exchange. There is no entity in Mauritius, Singapore, Cayman, BVI, Cyprus, UAE or Luxembourg in the disclosed group.
Why did the auditor change? Statutory auditors of government companies are appointed and rotated by the Comptroller and Auditor General under Section 139(5) of the Companies Act, not chosen by the board. FY24 was audited by C. R. Sagdeo & Co, FY26 by Sarda & Pareek LLP, whose FY26 opinion is unmodified with no qualification or emphasis of matter.
What is the exchange notice about? The NSE flagged non-compliance with SEBI listing regulations on the number of independent directors. The company disclosed on 30 April 2026 that it has written to its administrative ministry — which, for a CPSE, is the body that appoints independent directors — most recently on 4 April 2026.
How big is the order book relative to revenue? ₹18,218 crore at 30 June 2026 against FY26 revenue of ₹13,006 crore, or about 1.40 years of work. The comparable figure reported with Q4 FY24 results was ₹38,561 crore.
Independent research for education and discussion only. Not investment advice, not a recommendation, and not a rating — we issue no buy/sell calls and no target prices. Every figure is sourced from the primary documents linked above; figures can be restated and we can make mistakes, so always verify against the original. Nothing here alleges wrongdoing by any company or individual: where a fact raises a question we state the fact, cite it, and give the benign explanation alongside. Offshore holding structures, pledging and preferential allotments are all legal and common — they are disclosed here as facts, not as accusations.
This article is for educational and informational purposes only. It is not financial advice, investment recommendation, or a solicitation to buy or sell securities. Investing involves significant risks. I am not a SEBI-registered investment advisor. Readers should consult their own financial advisor and conduct their own research before making any investment decisions.
Comments
Join the conversation
Sign in to join the conversation.
Follow replies, add your view, and take part in the discussion.
Sign in to commentLoading comments...