

Position Sizing Explained: How Much to Buy, the 1% Rule & the Maths of Survival (Beginner's In-Depth Guide)
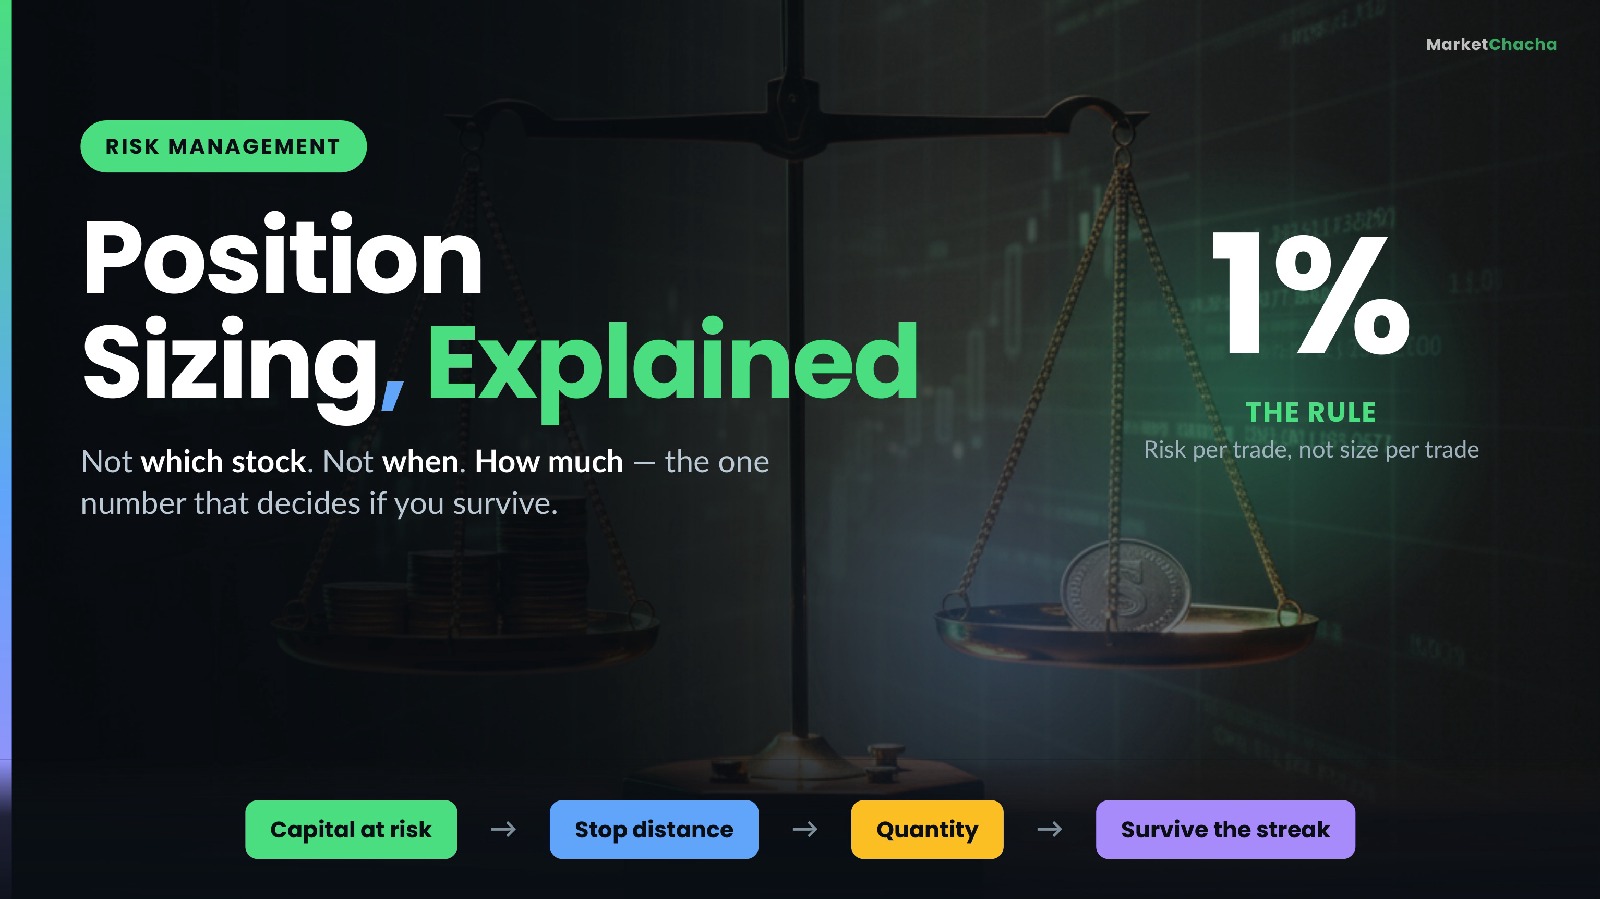
Position sizing is the decision of how much to buy — how many shares, lots or units — so that if the trade goes wrong, the loss is an amount you chose in advance and can absorb. It is not a view on the stock. It is arithmetic that sits between your idea and your order: you fix the rupees you are willing to lose, you measure how far away your stop-loss is, and the quantity falls out of those two numbers. Most beginners spend 95% of their effort on what to buy and almost none on how much — and it is the second question that decides whether they are still in the market a year later.
This guide covers the formula, a full worked example, why the 1% rule exists, what a losing streak actually does to an account, how sizing interacts with volatility and correlation, the mistakes that quietly destroy accounts, and how to apply all of it without a spreadsheet.
What position sizing actually means
Every trade has three separate decisions hidden inside it:
- Direction — which stock, and which way.
- Exit — where you admit the idea was wrong (your stop-loss).
- Size — how many shares you buy.
You cannot control the first. You can only partly control the second, because a gap-down can jump over your stop. But the third one — size — you control completely, right up to the moment you press the button. That is why experienced traders treat it as the most important decision on the list. Direction is a probability; size is a certainty.
Notice the crucial distinction: position size is not the same thing as risk. A ₹2,00,000 position with a stop 2% away risks ₹4,000. A ₹50,000 position with a stop 20% away risks ₹10,000. The smaller position is the riskier trade. Beginners size by the value of the position; a risk-managed trader sizes by the loss the position can produce.
The position sizing formula, step by step
There is one formula, and it has three inputs:
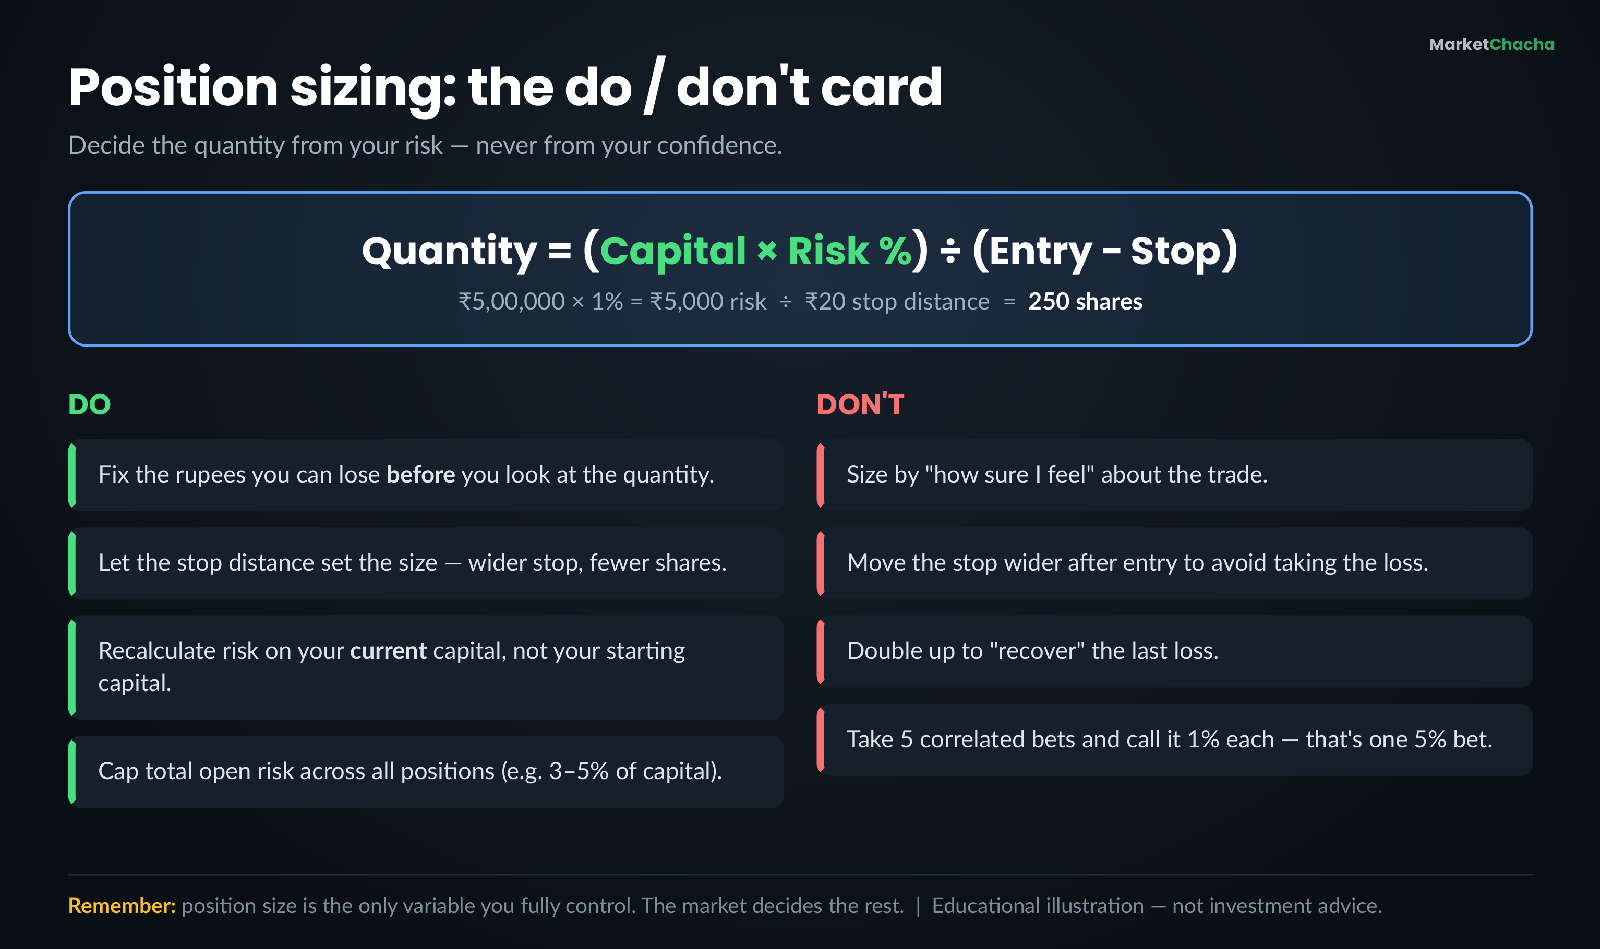
Quantity = (Capital × Risk %) ÷ (Entry price − Stop-loss price)
Reading it in plain words:
- Capital × Risk % = your rupee risk — the maximum you are willing to lose on this one trade. Decide this before you look at the chart.
- Entry − Stop = your stop distance — how many rupees per share you lose if the stop is hit. This comes from the chart, not from your wallet.
- Divide the first by the second and you get the number of shares that makes the loss come out exactly at your rupee risk.
The order matters. Risk first, chart second, quantity last. If you pick the quantity first — "I'll take 100 shares because that's a round number" — you have accidentally let the price of the stock decide your risk, which is a decision made by nobody.
A worked example (with the arithmetic shown)
Suppose your trading capital is ₹5,00,000 and you have decided that no single trade may cost you more than 1% of it.
- Step 1 — rupee risk: ₹5,00,000 × 1% = ₹5,000. That is the most this trade can lose.
- Step 2 — stop distance: You want to buy at ₹500. Below ₹480 the chart setup is broken, so your stop is ₹480. Stop distance = ₹500 − ₹480 = ₹20 per share.
- Step 3 — quantity: ₹5,000 ÷ ₹20 = 250 shares.
- Step 4 — sanity check: 250 × ₹500 = ₹1,25,000 of capital deployed, which is 25% of the account. If the stop hits: 250 × ₹20 = ₹5,000 lost — exactly 1%. Correct.
Now change one thing. Suppose the stock is volatile and a sensible stop is at ₹450 instead — a stop distance of ₹50. Then quantity = ₹5,000 ÷ ₹50 = 100 shares. Same capital, same 1% risk, but the wider stop forces a smaller position. That is the formula doing its job: the more room the trade needs, the fewer shares you may hold. Volatility does not change your risk; it changes your size.
Why the 1% rule exists — the survival maths
The famous "1% rule" says: never risk more than 1% of your capital on a single trade (many traders use 0.5%–2%; the number is less important than having one). It sounds absurdly conservative until you look at what a losing streak does.
Losing streaks are not rare. If your strategy wins 50% of the time, the probability of losing 6 trades in a row somewhere across 100 trades is high — near-certain, in fact. A good strategy does not protect you from streaks. Only your size does.
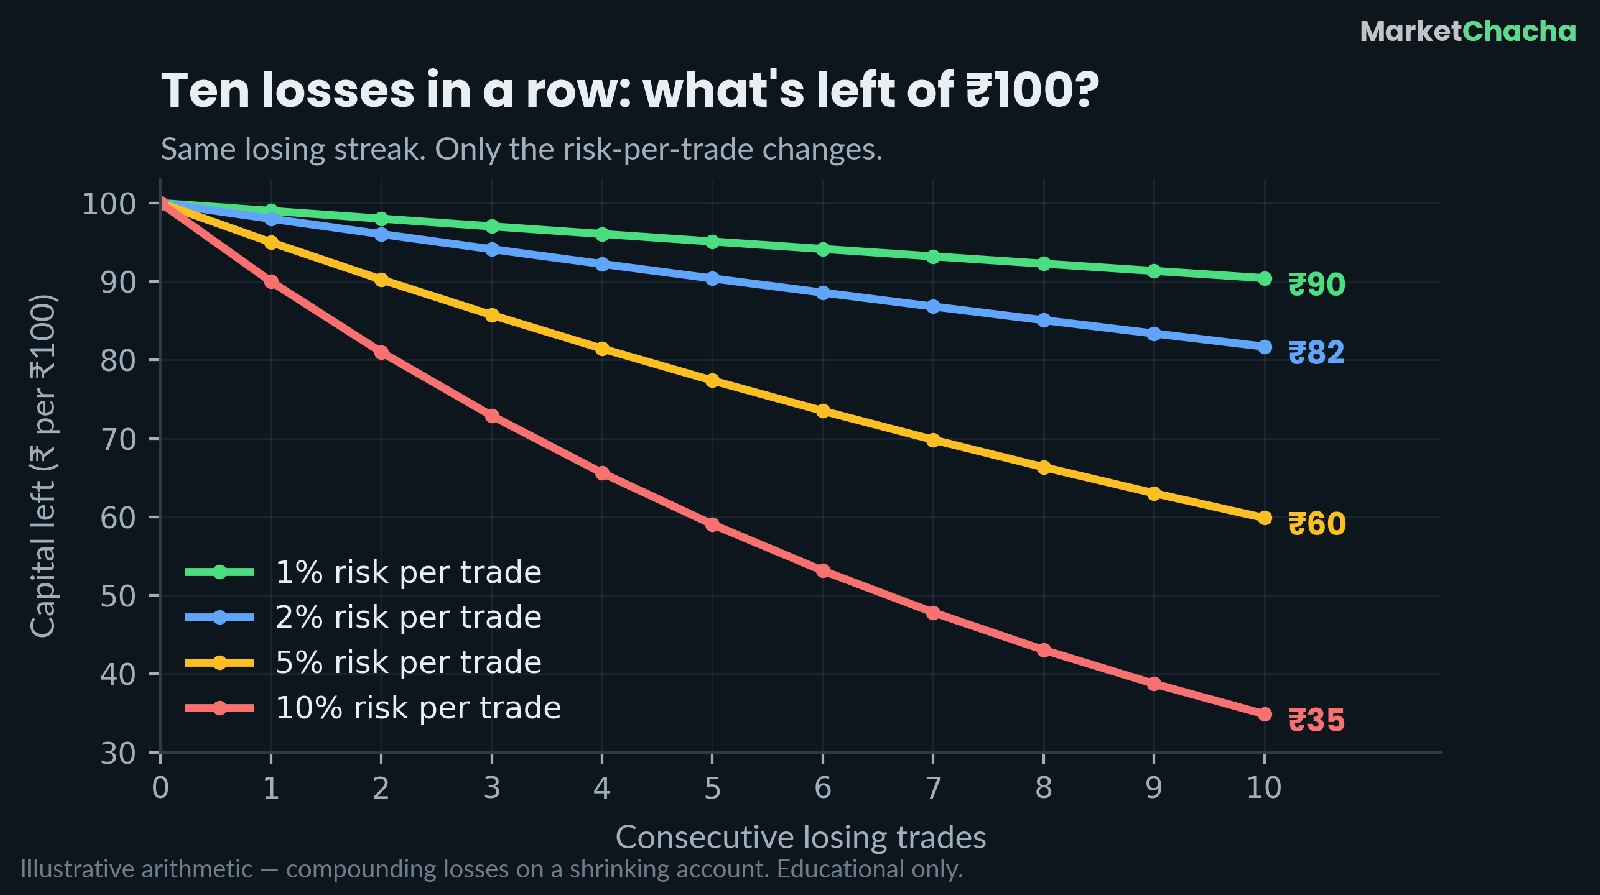
Ten losses in a row leave a 1%-risk trader with about ₹90 of every ₹100 — annoying, entirely recoverable. The same ten losses leave a 10%-risk trader with about ₹35. And that is where the second, crueller piece of maths arrives: losses and gains are not symmetric.
- Lose 10% → you need +11% to get back to even.
- Lose 35% → you need +54%.
- Lose 50% → you need +100%.
- Lose 65% → you need +186%.
(The formula is: recovery needed = 1 ÷ (1 − loss) − 1.) The 10%-risk trader is now down 65% and needs to nearly triple what is left just to be flat. The 1%-risk trader needs about 11%. Same strategy, same streak, two completely different futures. The 1% rule is not timidity — it is what keeps you at the table long enough for a positive edge to actually show up.
Risk of ruin: why big bets eventually blow up
"Risk of ruin" is the probability that a string of losses wipes out your account (or drops it below the level where you can keep trading) before your edge has time to work. It rises with three things: a lower win rate, a worse reward-to-risk ratio, and — most powerfully — a larger risk per trade.
The relationship with size is brutally non-linear. Doubling your risk per trade does far more than double your chance of ruin, because ruin requires only one bad run and bigger bets make a bad run fatal in fewer steps. A trader risking 20% per trade is only five consecutive losses away from having almost nothing left, no matter how good the strategy is. This is why professional risk managers obsess over the size of the bet rather than the quality of the idea: a great idea sized recklessly still ends at zero.
Fixed-fraction, fixed-rupee and volatility-based sizing
The 1% rule is one method. The main approaches:
- Fixed-rupee risk: "I risk ₹2,000 per trade, always." Simple and easy to follow, but it does not shrink when your account shrinks — so it slowly becomes a bigger percentage during a drawdown, exactly when it should be getting smaller.
- Fixed-fractional (percent) risk: the 1% rule. Risk is always a percentage of current capital, so it automatically scales down after losses and up after gains. This anti-martingale behaviour — bet less when losing, more when winning — is the whole point.
- Volatility-based sizing (e.g. ATR): instead of picking the stop from the chart alone, you set it a multiple of the stock's Average True Range away, then size from that distance. A jumpy small-cap automatically gets a smaller position than a steady large-cap. It formalises the idea that ₹1,00,000 in two different stocks is not the same amount of risk.
- Kelly criterion: a mathematically "optimal growth" bet size derived from your edge. In practice, full Kelly produces stomach-churning drawdowns and it assumes you know your true win rate and payoff — you don't. Traders who use it typically use a half- or quarter-Kelly fraction, which usually lands back in the same 1–2% neighbourhood anyway.
Portfolio risk: the trap of "1% each"
Sizing each trade at 1% is not enough if the trades are the same trade wearing different tickers. Buy five PSU banks at 1% risk each and a single bad day for the banking sector can hit all five stops at once — that is a 5% loss, i.e. one 5% bet dressed up as five small ones. Correlation quietly aggregates risk.
Two guardrails fix this:
- Total open risk cap: the sum of the risk on all open positions stays below a limit (many traders use 3–6% of capital). If you are already at the cap, the next idea waits — however good it looks.
- Sector/theme cap: limit how much of your open risk can sit in one sector or one macro theme (rate cuts, crude, AI capex).
Also worth adding: a drawdown circuit-breaker — e.g. if the account is down 6% in a month, halve position sizes until it recovers. The percent-of-current-capital method does some of this automatically, but an explicit rule stops you from revenge-trading your way back down.
Common mistakes beginners make
- Sizing by conviction. "I'm very confident here, so I'll take 3x." Confidence is not information. Your best-feeling trades are not statistically your best trades — often the opposite, because certainty means the story is already priced in.
- Choosing the stop to fit the size. You wanted 500 shares, the risk maths allowed 200, so you moved the stop closer to make 500 "work." Now you have a tight stop in the noise zone and you will be stopped out for no reason. The stop belongs to the chart; the size belongs to the maths.
- Moving the stop after entry. Widening a stop because price is approaching it converts a planned 1% loss into an unplanned 5% one. Your position size was calculated on a promise; breaking the promise voids the arithmetic.
- Averaging down without re-sizing. Adding to a losing position increases risk on exactly the trade that is already proving you wrong.
- Ignoring gap risk. Your stop is a plan, not a guarantee. Overnight news can open the stock below your stop, and your "1% risk" becomes 3%. Size a little smaller when you hold through results or major events — or don't hold through them.
- Using leverage as if it were free. Margin and F&O don't change the formula, but they make the stop distance far more punishing relative to the capital you posted. If anything, leverage demands smaller risk percentages, not larger.
- Forgetting costs. Brokerage, STT, stamp duty and slippage all come out of the same account. A "1% risk" trade that is really 1.2% after costs is fine; a strategy that trades 20 times a day at 1% risk is not.
How to actually apply this
You do not need software. Before every trade, write four lines in a notebook or a note on your phone:
- Capital today: ₹______ (current, not the amount you started with)
- Risk % and rupee risk: ____% = ₹______
- Entry and stop, so stop distance: ₹______ per share
- Quantity = rupee risk ÷ stop distance = ______ shares (round down)
Then check one more thing: does the position value exceed a sensible chunk of your account? Even at 1% risk, a very tight stop can produce a huge position — 250 shares at a ₹2 stop distance would be a ₹5,000 risk but possibly a very large exposure to a single gap. Cap the position value too (say, no single position above 20–25% of capital), so a gap cannot do more damage than you planned.
The limits of position sizing
Be honest about what sizing does and does not do. It cannot turn a losing strategy into a winning one — it only changes how slowly you lose. It cannot prevent gaps, circuit filters, or illiquid stocks where your exit is theoretical. And it will feel frustratingly small on the trades that work, which is precisely when most people abandon it.
What it does do is keep the size of any single mistake small enough that you get to make the next decision. In a game where outcomes are noisy and edges are thin, staying in the game is most of the edge.
FAQ
What is position sizing in simple words? It is deciding how many shares to buy so that, if your stop-loss is hit, you lose only a pre-decided amount — typically a small percentage of your total capital.
How do I calculate position size with a stop-loss? Quantity = (Capital × Risk %) ÷ (Entry price − Stop price). For example, ₹5,00,000 capital at 1% risk = ₹5,000; with a ₹20 stop distance, that is ₹5,000 ÷ ₹20 = 250 shares.
What is the 1% rule in trading? It means never risking more than 1% of your account on a single trade. It does not mean investing only 1% of your capital — you might deploy 25% of your money while risking only 1% of it, because the stop limits the loss.
How much of my capital should I put in one stock? Two separate caps are useful: a risk cap (e.g. 1% of capital lost if the stop hits) and an exposure cap (e.g. no single position larger than 20–25% of capital, so an overnight gap can't do outsized damage).
Why do small losses hurt less than big ones — isn't it just symmetric? No. Recovery is non-linear: a 10% loss needs an 11% gain to get back to even, but a 50% loss needs 100%. Larger risk per trade makes every drawdown exponentially harder to climb out of.
Does position sizing work for long-term investing too? Yes, in a different form — there it usually means capping how much of your portfolio any one stock or sector can occupy, rather than sizing from a stop-loss. The principle is the same: no single holding should be able to decide your outcome.
Educational content only — not investment advice, not a buy/sell recommendation. No guaranteed returns. All figures are illustrative arithmetic, not results anyone should expect. Always do your own research.
This article is for educational and informational purposes only. It is not financial advice, investment recommendation, or a solicitation to buy or sell securities. Investing involves significant risks. I am not a SEBI-registered investment advisor. Readers should consult their own financial advisor and conduct their own research before making any investment decisions.
Comments
Join the conversation
Sign in to join the conversation.
Follow replies, add your view, and take part in the discussion.
Sign in to commentLoading comments...