

What is EPS — and what's the difference between basic and diluted earnings per share? (Beginner's In-Depth Guide)

Earnings per share (EPS) is a company's profit divided by the number of shares it has — the slice of the year's earnings that sits behind one single share. If a company earns $50 million for its ordinary shareholders and has 20 million shares, EPS is $2.50. That is the whole idea. What makes EPS worth a long article is not the top of the fraction but the bottom: the share count moves, it is a weighted average rather than a snapshot, and companies report two versions of it — basic and diluted. Get the denominator wrong and every conclusion you draw from EPS, including the P/E ratio, is wrong too.
This guide walks through what EPS is, the exact arithmetic with a worked example, why basic and diluted differ, how the treasury stock method converts employee options into extra shares, how profit can grow while EPS shrinks, and how the same rules work in India.
What is EPS, exactly?
EPS answers a simple ownership question: for every one share I hold, how much profit did the business earn this year? It converts a company-level number (total profit) into a per-share number you can actually compare to a share price.
The formula for basic EPS is:
- Basic EPS = Profit available to ordinary shareholders ÷ Weighted-average ordinary shares outstanding
Two details matter in that sentence. First, the numerator is not simply "net profit". It is profit available to ordinary shareholders — so if the company has preference (preferred) shares, the dividends owed on them come off the top first, because that money was never the ordinary shareholder's. Second, the denominator is a weighted average across the period, not the share count on the last day of the year.
Under US GAAP this is governed by ASC 260, and under Indian accounting standards by Ind AS 33. Both require a company to show basic and diluted EPS on the face of the income statement, with equal prominence, for every period presented — including loss-making periods.
A worked example: EPS in six lines of arithmetic
Take an illustrative company, Meridian Tools (invented, so we can see every moving part):
- Profit after tax for the year: $52.0 million
- Preference dividends declared: $2.0 million
- So profit available to ordinary shareholders: $52.0m − $2.0m = $50.0 million
- Shares outstanding on 1 January: 18.0 million
- On 1 July, Meridian issues 4.0 million new shares to fund a factory, ending the year on 22.0 million
Now the denominator. The 18.0 million original shares existed for the full year. The 4.0 million new shares existed for only half of it, so they count as half:
- Weighted-average shares = 18.0m × (12/12) + 4.0m × (6/12) = 18.0m + 2.0m = 20.0 million
- Basic EPS = $50.0m ÷ 20.0m = $2.50 per share
The bit almost every beginner gets wrong: it is a weighted average
Look at what happens if you skip the weighting. Using the year-end count of 22.0 million shares gives $50.0m ÷ 22.0m = $2.27. Using the opening count of 18.0 million gives $50.0m ÷ 18.0m = $2.78. The correct answer, $2.50, sits between them — and the gap between the sloppy versions is 22%. On a stock trading at 20 times earnings, that is the difference between calling it expensive and calling it cheap.
The logic behind weighting is fairness, not accounting fussiness. Money raised on 1 July only had six months to do any work. Charging the full year's profit against shares that existed for half a year would understate what the business actually earned per share. This is also why a company that raises equity late in the financial year barely dents that year's EPS — and then dents the next year's badly, when those shares count for all twelve months.
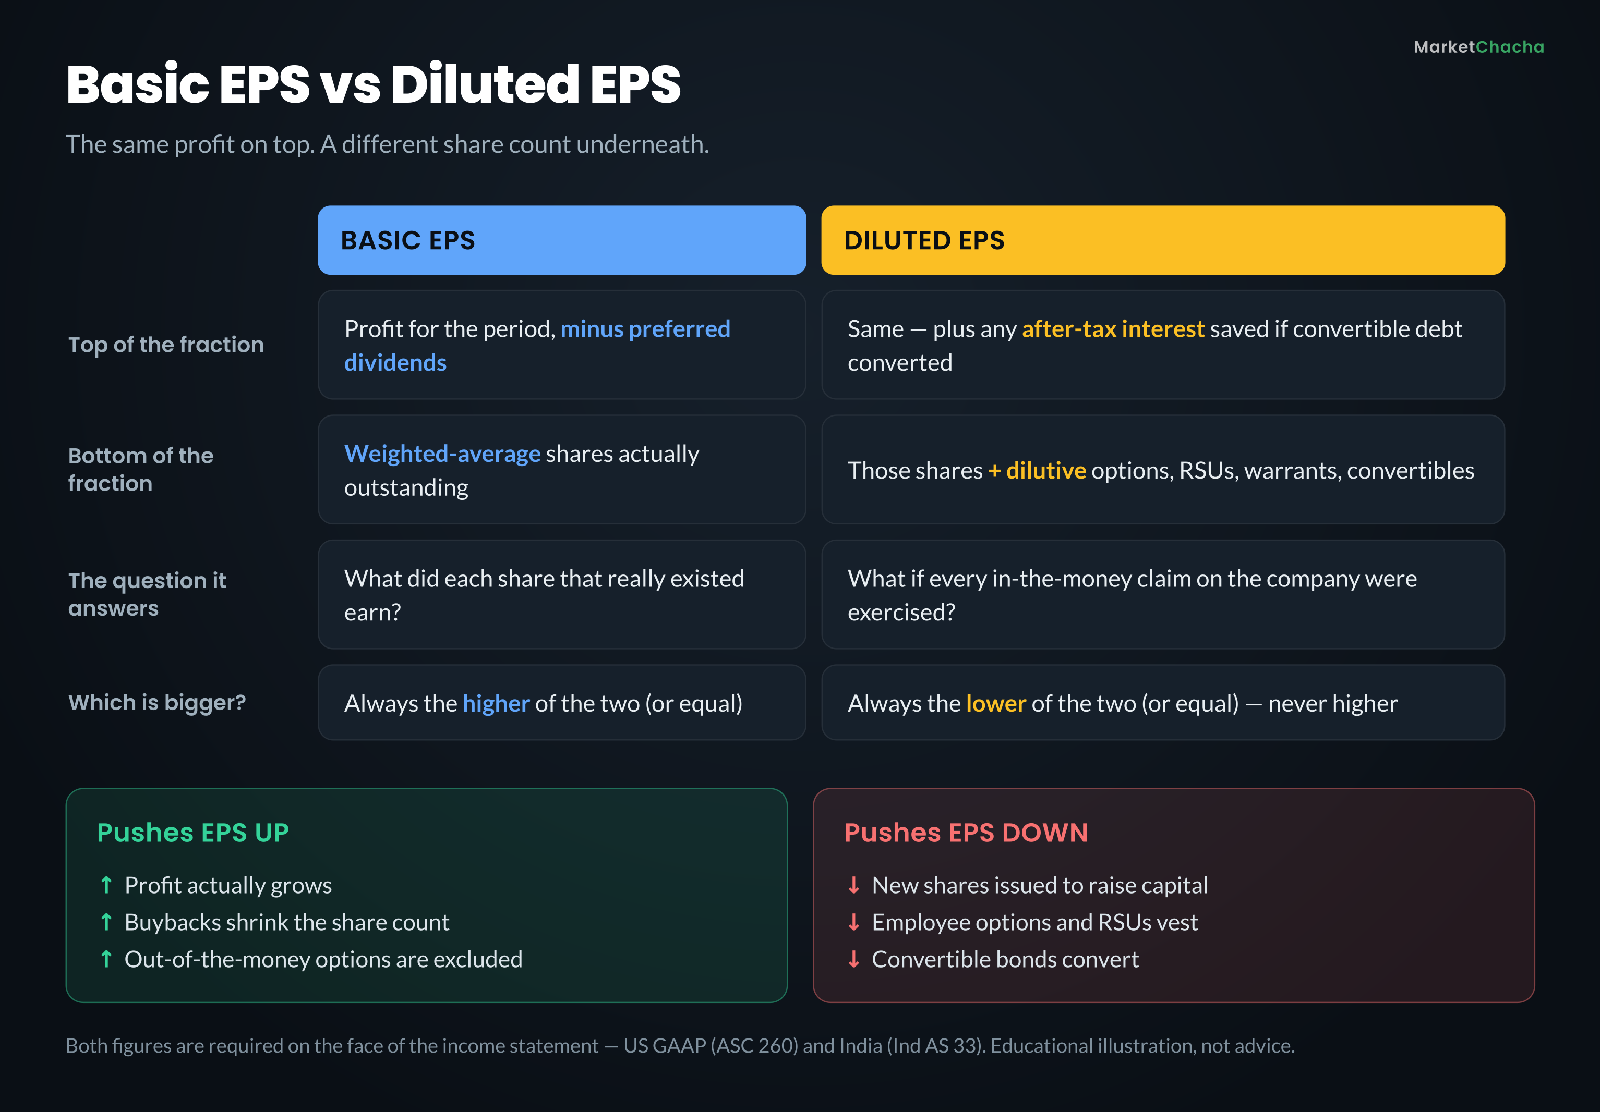
Basic EPS vs diluted EPS: what "dilution" actually means
Dilution is the risk that shares which do not exist yet will exist soon, and will share the same pot of profit. Employee stock options, restricted stock units (RSUs), warrants and convertible bonds are all claims on future shares. None of them are counted in basic EPS, because basic EPS only counts shares that genuinely existed. Diluted EPS asks the pessimistic question instead: what would EPS have been if every one of those claims had already been converted into real shares?
The rules for turning claims into share-counts depend on the instrument:
- Options, warrants and share-based awards use the treasury stock method (explained below).
- Convertible bonds and convertible preference shares use the if-converted method: you add the shares they would convert into to the denominator, and you add back to the numerator the interest or dividend the company would no longer have paid, net of tax.
- Anti-dilutive instruments are thrown out. This is the rule beginners miss. If including an instrument would raise EPS rather than lower it, it is excluded from the calculation entirely. That is why diluted EPS is always less than or equal to basic EPS, and never above it.
The anti-dilution rule has a striking consequence: when a company makes a loss, adding more shares would make the loss per share look smaller, which is anti-dilutive. So for loss-making companies, diluted loss per share usually equals basic loss per share, and the dilution risk is invisible in the EPS line. You have to read the EPS note in the accounts to see it.
The treasury stock method, with the arithmetic
The treasury stock method is cleverer than "just add all the option shares". It assumes employees pay their exercise price in cash, and that the company immediately uses that cash to buy its own shares back at the market price. Only the net new shares are dilutive.
Back to Meridian Tools. Suppose it has 1.5 million employee options with a $20 exercise price, and the average market price of the share during the year was $50:
- Cash the company would receive: 1.5m × $20 = $30.0 million
- Shares it could buy back with that cash: $30.0m ÷ $50 = 0.6 million
- Net new (incremental) shares: 1.5m − 0.6m = 0.9 million
- Diluted share count: 20.0m + 0.9m = 20.9 million
- Diluted EPS = $50.0m ÷ 20.9m = $2.39 per share
So Meridian reports basic EPS of $2.50 and diluted EPS of $2.39. Same profit, but the reported per-share figure is 4.4% thinner ($2.50 → $2.39) once the option overhang is counted.
Now suppose Meridian also has 0.4 million options with a $60 exercise price. Those are out of the money against a $50 average price: the $24.0 million of proceeds would buy back 0.48 million shares, more than the 0.4 million issued. Including them would raise EPS, so they are anti-dilutive and excluded. They still appear in the notes as securities excluded from the calculation — which is exactly where you should look, because if the share price climbs above $60 next year, they stop being harmless.
One simplification to flag: in real filings, the assumed proceeds under the treasury stock method also include the average unrecognised compensation cost still to be expensed on share-based awards, not just the exercise price. The example above assumes that cost is already fully recognised, so the arithmetic stays readable.
Why profit can rise 10% while EPS falls
Because EPS is a fraction, it moves on two independent levers. Growing the numerator is the honest way. Shrinking the denominator works just as well arithmetically — and tells you nothing about whether the business got better.
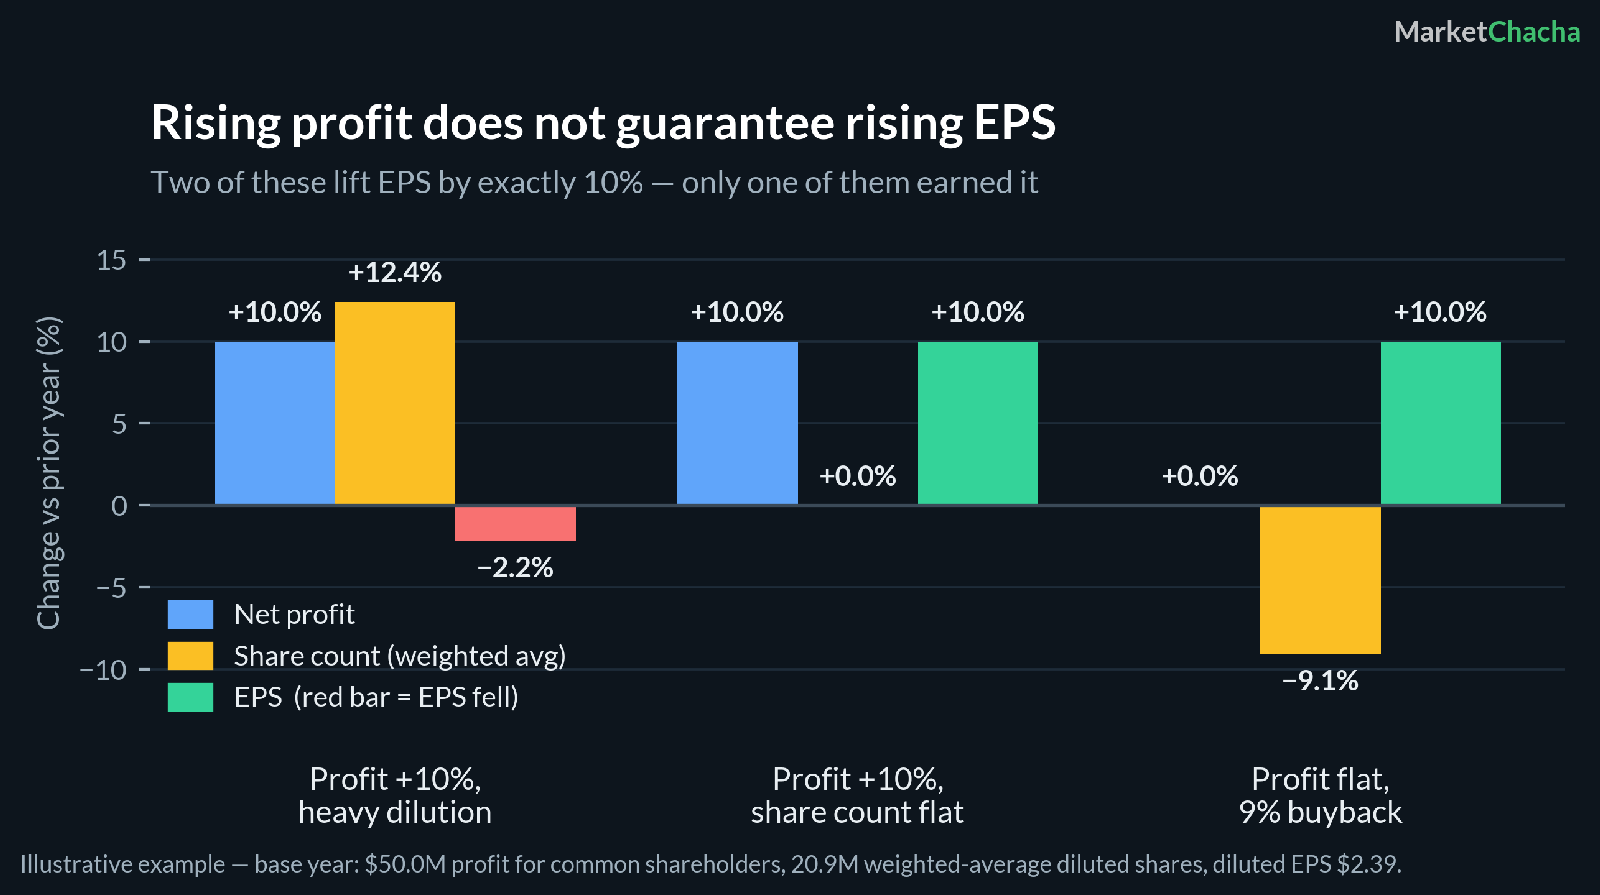
Starting from Meridian's diluted EPS of $2.39 on 20.9 million shares:
- Heavy dilution: profit grows 10% to $55.0m, but a big share issue and vesting RSUs push diluted shares up 12.4% to 23.5m. EPS = $55.0m ÷ 23.5m = $2.34 — down about 2%, despite a genuinely better year.
- Clean growth: profit grows 10% to $55.0m with the share count flat at 20.9m. EPS = $2.63, up 10.0%.
- Buyback, flat profit: profit is unchanged at $50.0m, but a buyback retires 9.1% of the shares, leaving 19.0m. EPS = $50.0m ÷ 19.0m = $2.63, also up 10.0%.
The last two produce identical EPS growth from completely different realities. One company earned more money. The other earned exactly the same money and spent cash to divide it among fewer people. Neither is automatically good or bad — a buyback funded by surplus cash when the shares are cheap is a reasonable use of capital; one funded by debt to hit an EPS-linked bonus target is not. But EPS alone cannot tell you which you are looking at.
Reported EPS vs "adjusted" EPS
Companies frequently headline an adjusted, underlying or non-GAAP EPS that strips out items management considers one-off: restructuring charges, impairments, acquisition costs, and very often share-based compensation. That last one deserves suspicion. Share-based pay is a real cost — it is precisely the thing creating the dilution in the diluted share count — so adding it back while still quoting a diluted share count flatters the number twice over.
Adjusted EPS is not inherently dishonest; genuinely non-recurring items can obscure the underlying trend. But it is a number the company chooses the definition of, and the definition can quietly change between years. In the US, SEC rules (Regulation G) require a company presenting a non-GAAP measure to also show the most directly comparable GAAP figure and reconcile the two — so the reconciliation table is always available. Read it. If "adjusted" EPS is persistently double the reported figure, the adjustments are the story.
How to actually use EPS
EPS is an input, not a verdict. A few practical habits:
- Use diluted, always. It is the conservative figure and the one that flows into most published P/E ratios. Comparing one company's basic EPS to another's diluted EPS is meaningless.
- Track EPS growth against profit growth. If profit is compounding faster than EPS, the company is issuing shares — find out what it bought with them. If EPS is compounding faster than profit, buybacks are doing the work.
- Check the share count trend over five years, not one. A single year hides the pattern; five years of a steadily rising diluted count is a structural transfer from shareholders to employees.
- Remember EPS is an accounting number. It can be inflated by one-off asset sales and deflated by non-cash write-downs. Read it alongside operating cash flow and free cash flow, which are harder to dress up.
- Never compare EPS across companies in absolute terms. A ₹5 EPS and a $5 EPS say nothing about relative quality; share counts are arbitrary. Only EPS relative to price (the P/E ratio) or EPS growth is comparable.
Common mistakes beginners make
- Using the year-end share count. The weighted average is almost always different, and always the correct denominator.
- Assuming a higher EPS means a better company. A company with 1 million shares will show a far higher EPS than an identical company with 100 million shares. It is the same business.
- Ignoring the anti-dilutive footnote. Out-of-the-money options are excluded today and dilutive tomorrow if the share price runs.
- Reading a loss-maker's diluted EPS as evidence of low dilution. When there is a loss, dilution is suppressed by the anti-dilution rule, not absent.
- Treating a stock split as EPS destruction. Splits and bonus issues are restated backwards across every period shown, so the historical comparison stays valid — no real change has occurred.
- Comparing a trailing EPS to a forward P/E or otherwise mixing periods. Match like with like.
How this works in India
The framework is essentially the same. Ind AS 33 — Earnings per Share requires listed and other covered Indian companies to present basic and diluted EPS with equal prominence on the face of the statement of profit and loss, for every period presented, including when the figure is negative. Companies not on Ind AS follow the older AS 20, which is built on the same principles. SEBI's prescribed format for quarterly and annual results under Regulation 33 of the LODR Regulations goes further than the accounting standard: it requires listed companies to report EPS every quarter, split into (a) Basic and (b) Diluted, so you can watch dilution build quarter by quarter instead of waiting for the annual report. One trap in that format is worth knowing — quarterly EPS is expressly marked "not annualised", so a quarterly figure of ₹4 is a single quarter's earnings, not a run rate. Never compare it directly to a full-year EPS or use it in a P/E without multiplying up.
The mechanics translate directly: profit attributable to equity shareholders sits on top (after preference dividends), the weighted-average number of equity shares sits underneath, and potential equity shares — ESOPs, convertible debentures, warrants issued to promoters — are added for the diluted figure only when they actually reduce EPS. ESOP-heavy Indian technology and new-age listed companies are where the basic-versus-diluted gap tends to be widest, and where reading the EPS note in the annual report pays off most.
The one distinctly Indian habit worth knowing is the frequency of bonus issues and stock splits. Both increase the share count without bringing in any new money, so Ind AS 33 requires EPS to be restated retrospectively for all periods presented — and if the bonus or split happens after the balance sheet date but before the accounts are approved, the new share count is still applied to every period shown. This is why a company's reported EPS for an old year can look different in a later annual report than it did at the time. Nothing has been restated dishonestly; the share base has simply been put on a comparable footing. If you keep your own spreadsheet of a company's EPS history, you must apply the same adjustment, or a 1:1 bonus issue will look like earnings halving overnight.
FAQ
What is a good EPS? There is no universally good number, because EPS depends entirely on how many shares a company happens to have. A ₹2 EPS and a ₹200 EPS can describe equally good businesses. What is meaningful is EPS growth over several years, and EPS compared with the share price through the P/E ratio.
Should I use basic EPS or diluted EPS? Use diluted EPS. It is the more conservative figure, it accounts for options and convertibles that will likely become real shares, and it is what most published P/E ratios are built on. Basic EPS is useful mainly as a comparison — the gap between the two tells you how much dilution is hanging over the stock.
Why is diluted EPS always lower than basic EPS? Because accounting rules exclude any instrument whose inclusion would raise EPS. Only dilutive instruments are counted, so by construction diluted EPS can only be equal to or lower than basic EPS — never higher.
Can EPS go up without the company making more money? Yes. If a company buys back its own shares, the profit is divided among fewer shares and EPS rises even with flat earnings. In the worked example above, a 9.1% buyback with zero profit growth lifted EPS by exactly 10% — the same lift as genuine 10% profit growth.
What does dilution mean for me as a shareholder? It means your ownership percentage, and your claim on each rupee or dollar of profit, gets smaller when new shares are created. Dilution is not automatically bad — shares issued to fund a project that earns more than it cost can leave you better off — but it is always a cost, and it should buy something.
Why did a company's past EPS change in a later annual report? Almost always a bonus issue or a stock split. Accounting standards require EPS for all earlier periods shown to be restated using the new share count, so the history stays comparable. No profit figure has changed.
Educational content only — not investment, tax or insurance advice, and not a recommendation of any product or security. All company figures in this article are clearly labelled illustrative examples, not real financial data. Accounting standards and disclosure rules change — always check the current standard and a company's own filings. [Sources: PwC Viewpoint — Financial statement presentation guide, Ch. 7 Earnings per share (ASC 260), GAAP Dynamics — Calculating Diluted EPS under ASC 260, ClearTax — Indian Accounting Standard (Ind AS) 33, Earnings per Share, SEBI Circular CIR/CFD/CMD/15/2015 — prescribed formats for financial results under LODR Reg. 33] Always do your own research.
This article is for educational and informational purposes only. It is not financial advice, investment recommendation, or a solicitation to buy or sell securities. Investing involves significant risks. I am not a SEBI-registered investment advisor. Readers should consult their own financial advisor and conduct their own research before making any investment decisions.
Comments
Join the conversation
Sign in to join the conversation.
Follow replies, add your view, and take part in the discussion.
Sign in to commentLoading comments...