
learning Hub

Learning Hub

c/learninghub

A beginner-friendly community to learn about investing, the stock market, personal finance, and more.

publicgeneralStarted Jun 202651 posts26 members
Log in to join

Join to post, ask questions, and follow the conversations that fit your market style.

Why join c/learninghub?

Real conversations

Ask what you are missing and compare notes.

Focused and relevant

One community, one cleaner thread of discussion.

Learn and grow

Read first, then post when you have a view.

ranjeet_singh
1 month ago

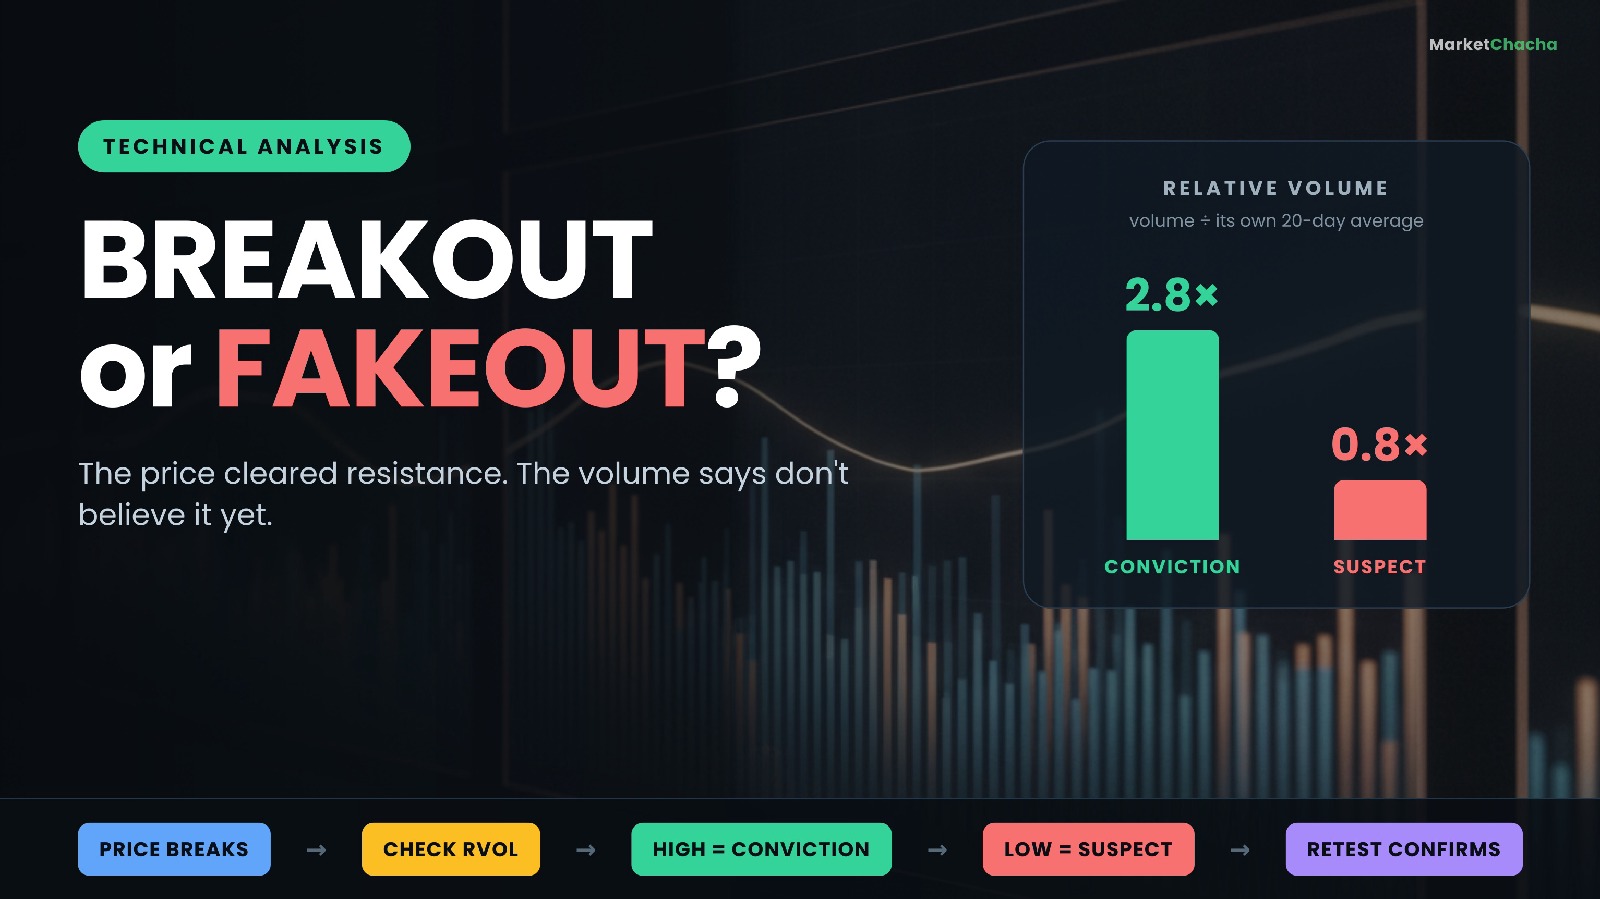
What is volume in stocks — and how do you tell a real breakout from a fakeout?

Volume is simply the number of shares that changed hands in a given period — a day, an hour, a single candle. On its own it tells you nothing about direction. What it tells you is how many people were involved in the price move you are looking at, and that is why traders use it as a lie-detector: a price breaking above resistance on huge volume is a very different event from the same break on a quiet afternoon, even though the chart line looks identical. This guide covers what volume actually measures, how to turn a raw number into the ratio that matters, how a real breakout differs from a fakeout, when a volume spike means nothing at all, an…
What is volume in stocks — and how do you tell a real breakout from a fakeout?+2 more
0
ranjeet_singh
1 month ago

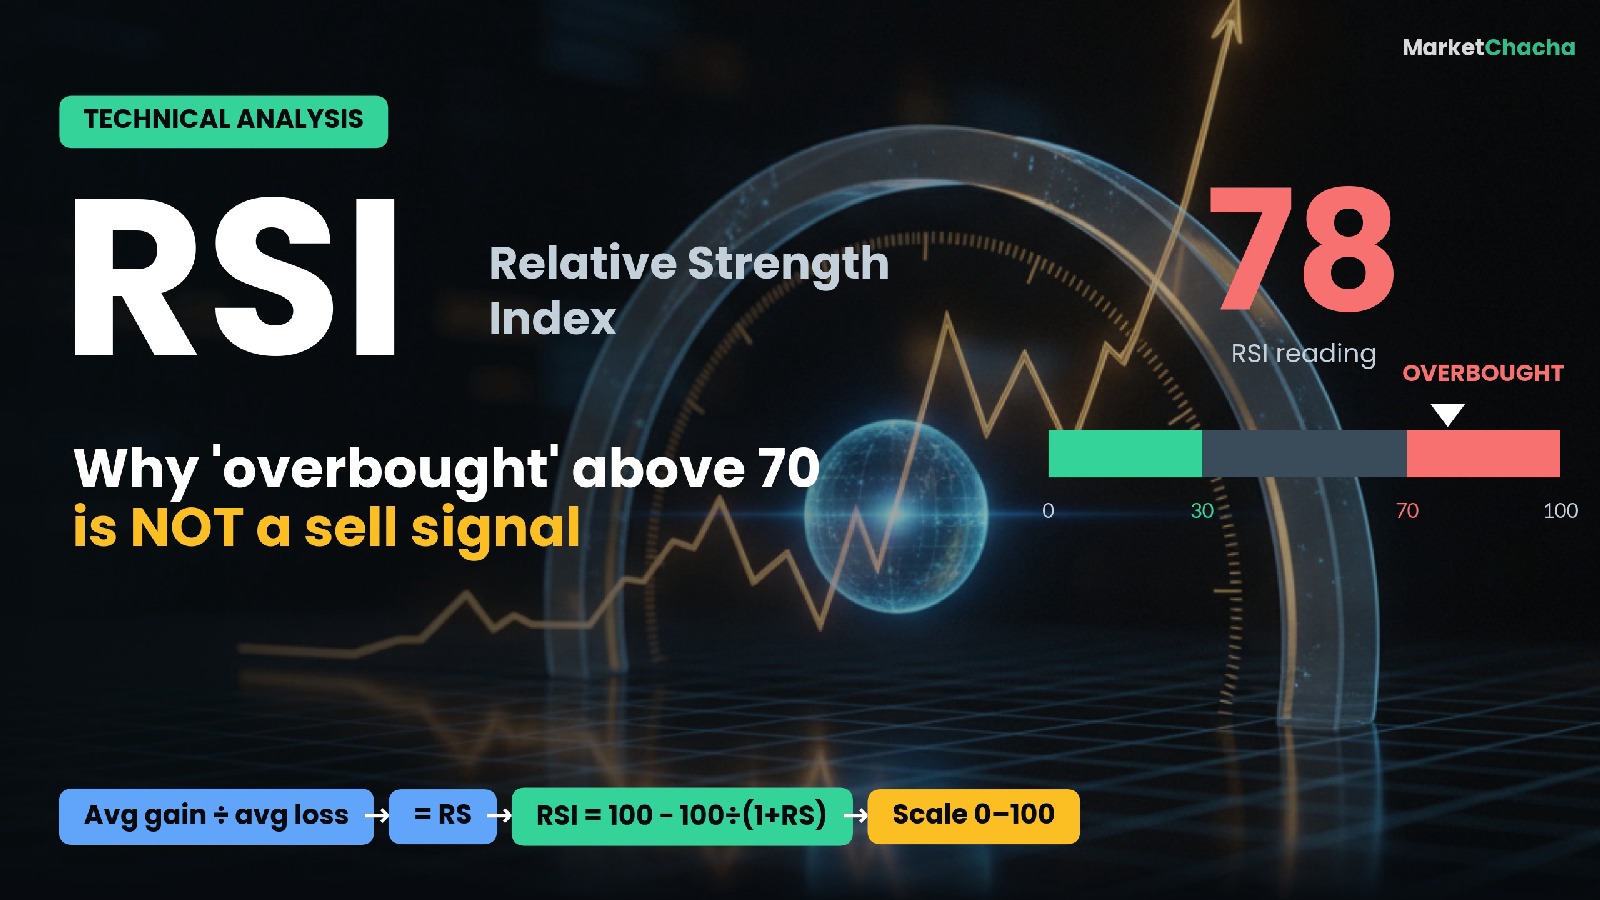
What is RSI (Relative Strength Index) — and why is an RSI above 70 not a sell signal?

The Relative Strength Index (RSI) is a momentum indicator that measures how fast and how far a stock's price has moved recently, and squeezes that into a single number between 0 and 100. It compares the size of recent up-moves to recent down-moves: a high RSI means gains have dominated, a low RSI means losses have. Traders use it to gauge whether momentum is strong, weak, stretched (often called "overbought") or exhausted (often called "oversold"). It was created by J. Welles Wilder Jr. in his 1978 book New Concepts in Technical Trading Systems , and it is still one of the most widely used indicators on any charting platform.…

What is RSI (Relative Strength Index) — and why is an RSI above 70 not a sell signal?+2 more
0
ranjeet_singh
1 month ago

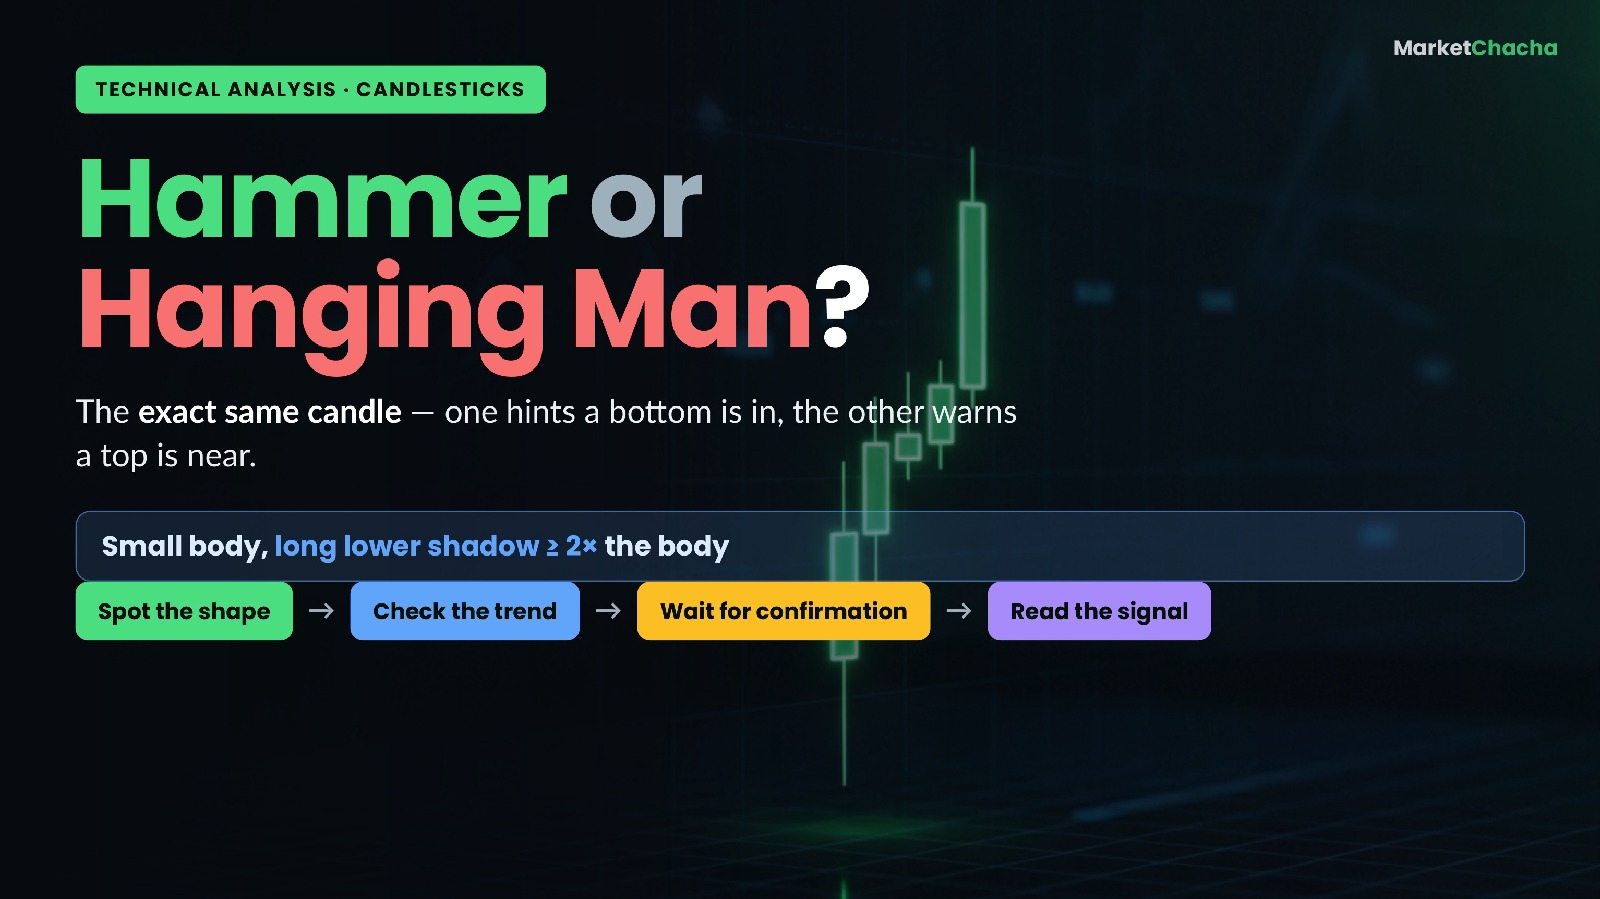
What is a hammer candlestick — and how is it different from a hanging man?

A hammer is a single candlestick with a small body sitting near the top of its range and a long lower shadow (wick) hanging beneath it — and when it appears at the bottom of a downtrend, it is one of the most-watched hints that sellers are losing control and a bottom may be forming. The twist that trips up almost every beginner: the exact same candle, shape for shape, is called a hanging man when it shows up at the top of an uptrend, and there it is a warning that a top may be near. Same picture, opposite message. This guide explains the anatomy of the candle, walks through the arithmetic that tells you whether a candle really qualifies, show…

What is a hammer candlestick — and how is it different from a hanging man?+2 more
0
ranjeet_singh
1 month ago

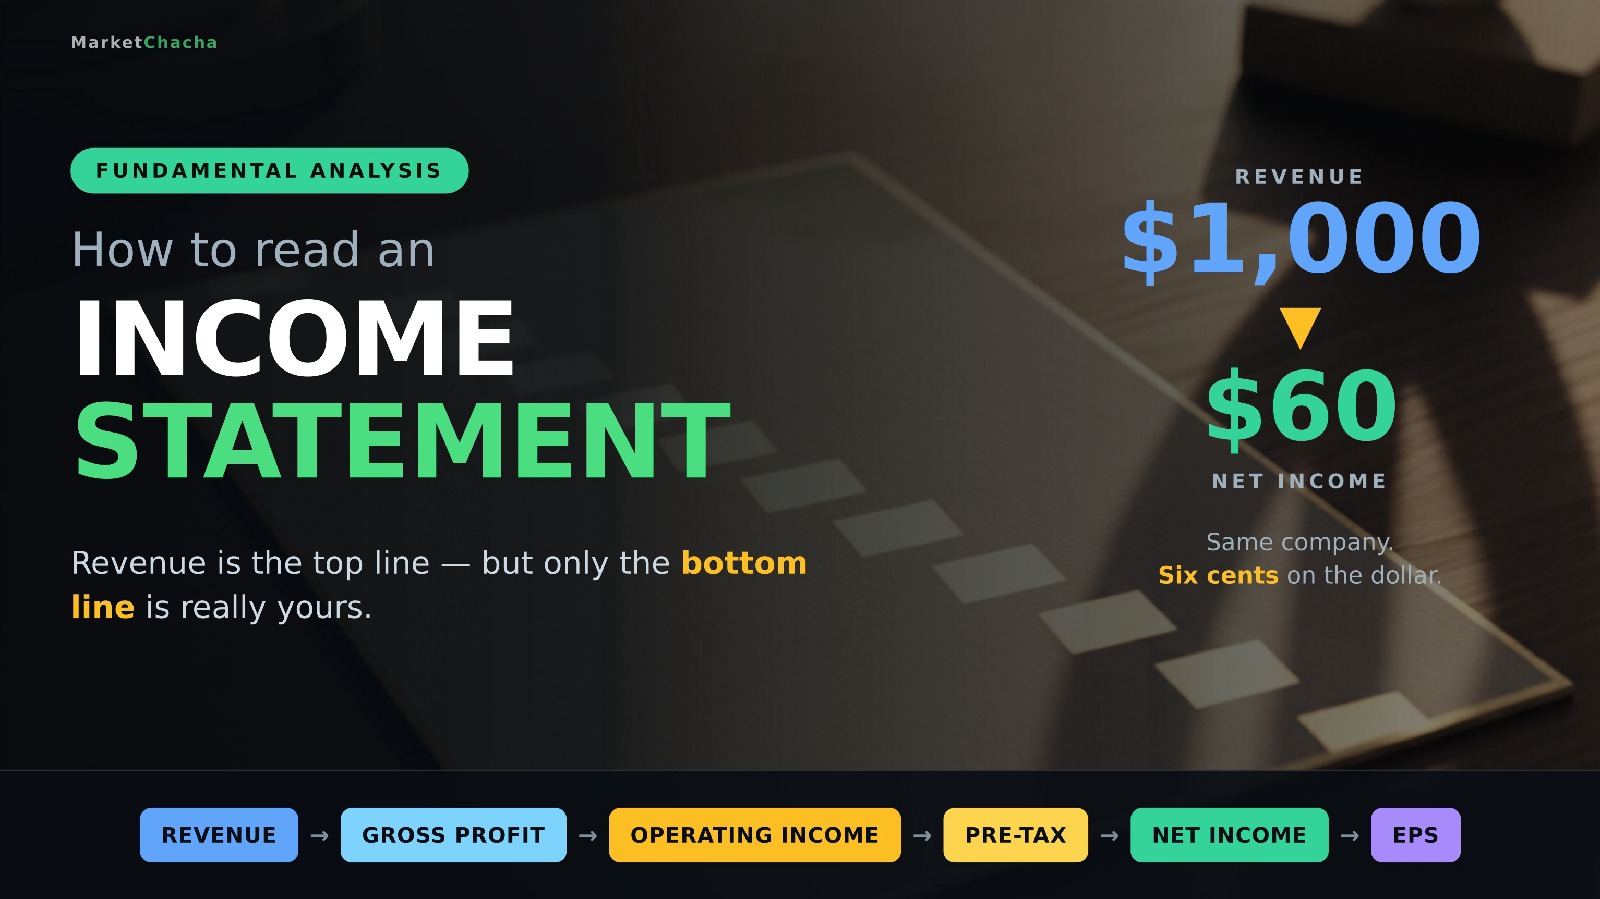
How do you read an income statement? Revenue, gross profit, operating income and net profit explained (Beginner's In-Depth Guide)

An income statement (also called the profit and loss statement, or P&L) is the financial statement that shows how much money a company brought in over a period — a quarter or a year — and what was left after every cost was subtracted. It is built like a staircase: you start at the top with revenue , walk down through cost of sales, operating expenses, interest and tax, and arrive at the bottom line , net income. The US Securities and Exchange Commission's own beginners' guide describes it exactly that way — "a set of stairs" that you descend one deduction at a time. This guide walks the whole staircase with a worked example you can fo…

How do you read an income statement? Revenue, gross profit, operating income and net profit explained (Beginner's In-Depth Guide)+2 more
0
ranjeet_singh
2 months ago

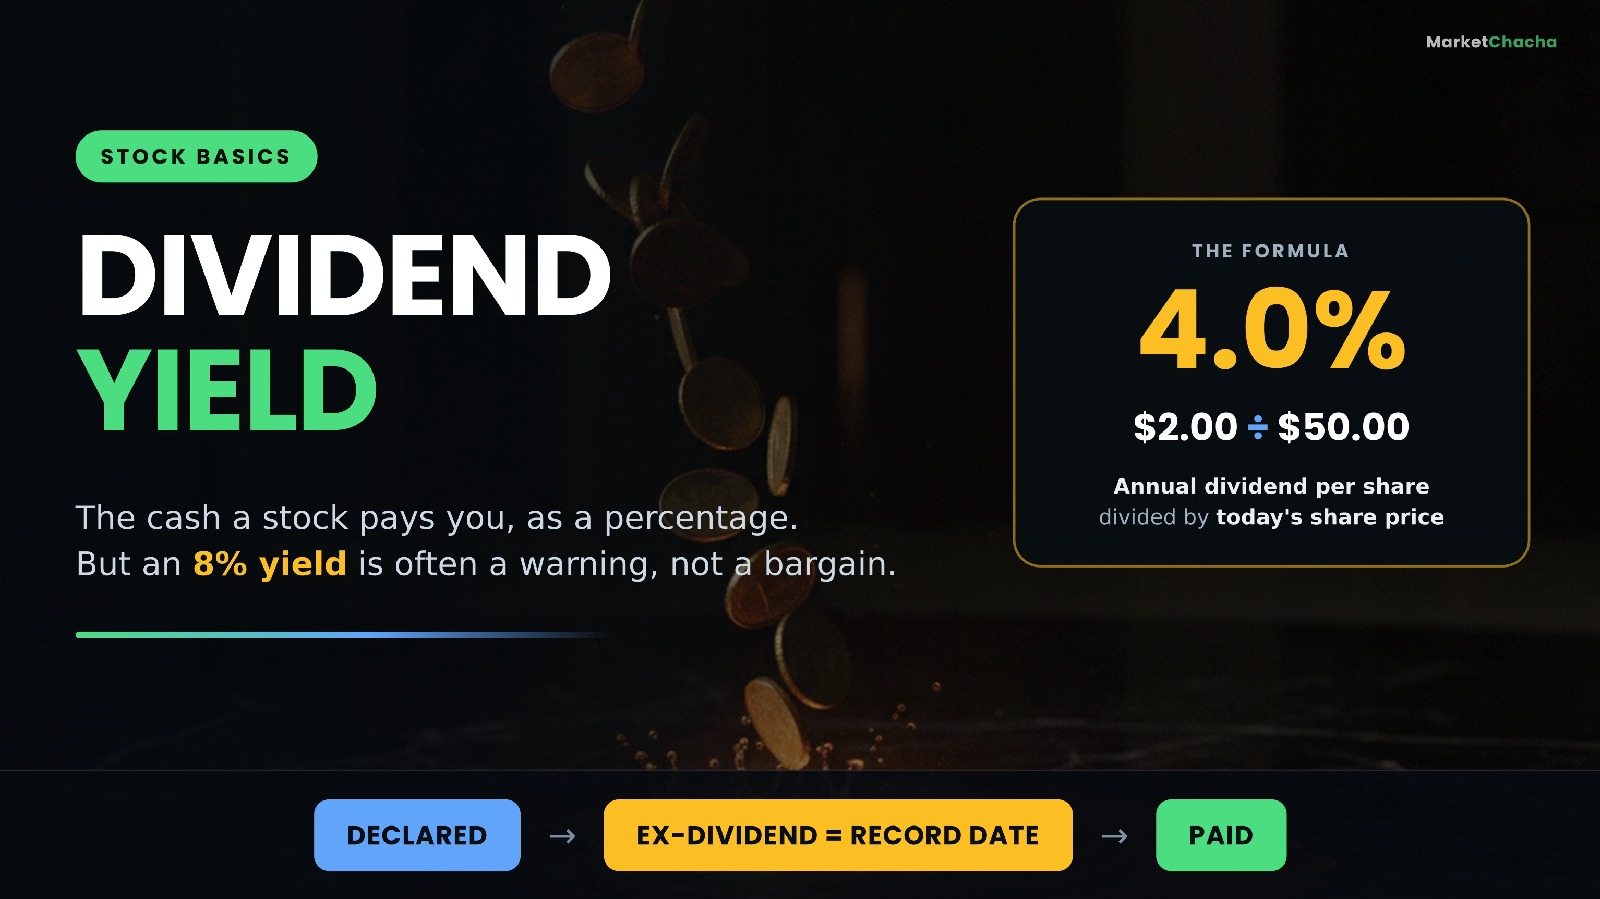
What is dividend yield — and what does the payout ratio actually tell you? (Beginner's In-Depth Guide)

Dividend yield is simply the cash a company pays you per share over a year, divided by what one share costs today. If a stock trades at $50.00 and pays $2.00 a year in dividends, the yield is $2.00 ÷ $50.00 = 4.0% . The payout ratio is the companion number: it tells you what slice of the company's earnings that dividend is eating. Yield tells you what you get; the payout ratio tells you whether the company can keep giving it. This guide walks through both numbers with the arithmetic spelled out — how to calculate them, why a yield can rise without the company doing anything, the "yield trap" that catches beginners, the four dates that…

What is dividend yield — and what does the payout ratio actually tell you? (Beginner's In-Depth Guide)+2 more
0
ranjeet_singh
2 months ago

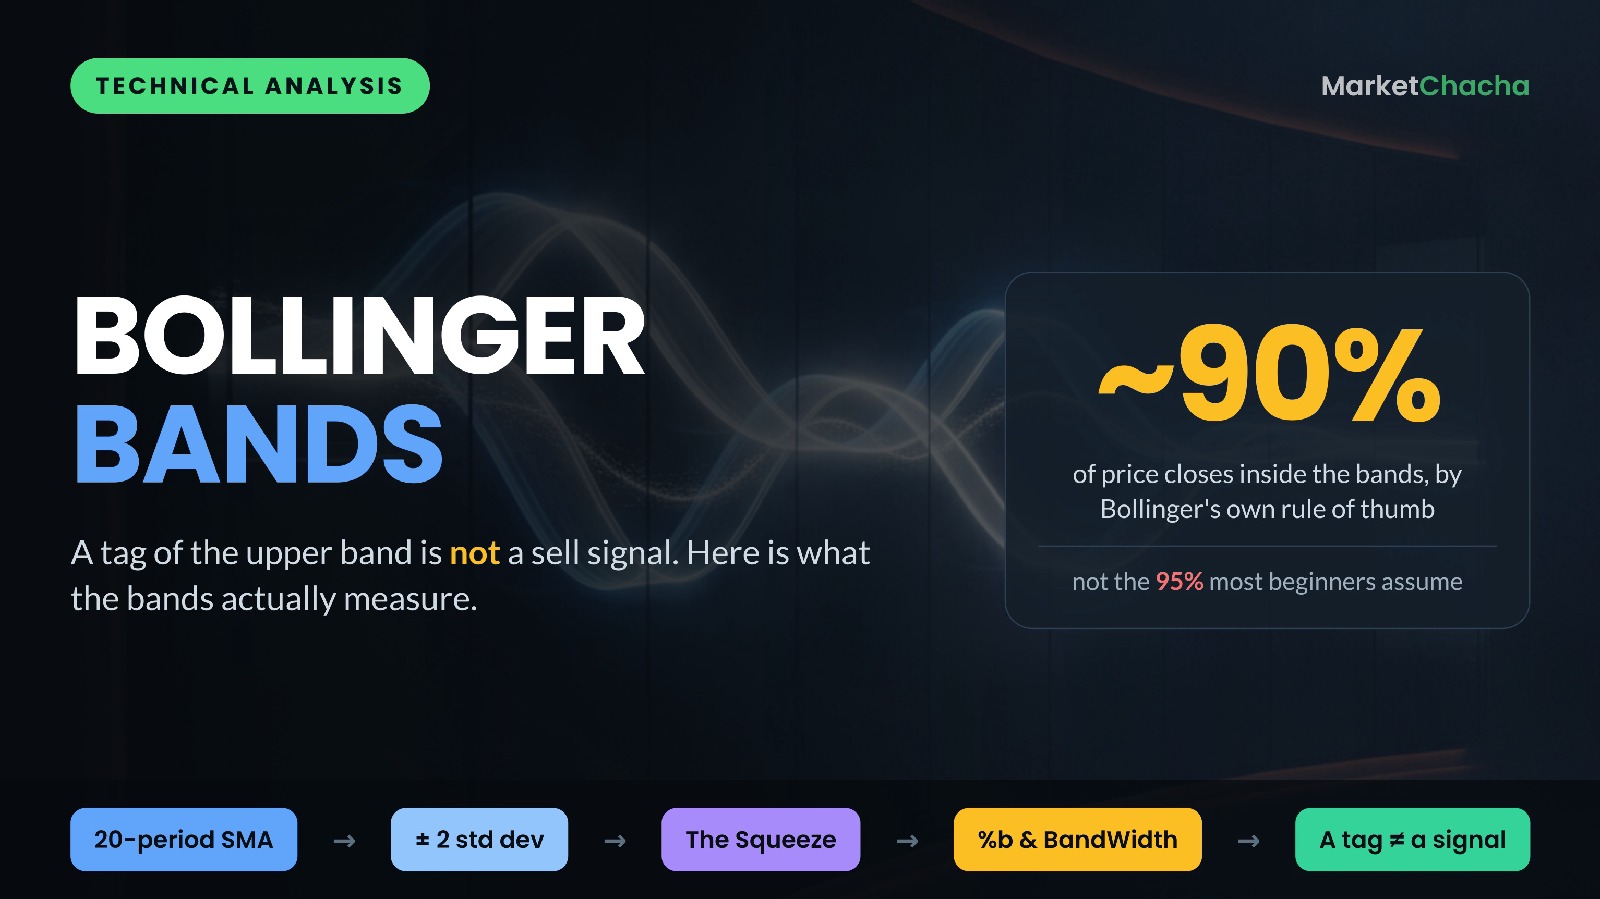
What are Bollinger Bands — and why is touching the upper band not a sell signal? (Beginner's In-Depth Guide)

Bollinger Bands are a volatility indicator. They draw three lines on a price chart: a middle line that is a moving average of the closing price (20 periods by default), and an upper and a lower line placed a set number of standard deviations away from that average (two, by default). Because standard deviation is a measure of how much prices have been jumping around, the bands automatically widen when the market gets noisy and squeeze together when it goes quiet. That is the whole idea: the bands do not predict direction — they describe how volatile the recent past has been, and they put today's price into that context. Below we build the band…

What are Bollinger Bands — and why is touching the upper band not a sell signal? (Beginner's In-Depth Guide)+2 more
0
ranjeet_singh
2 months ago

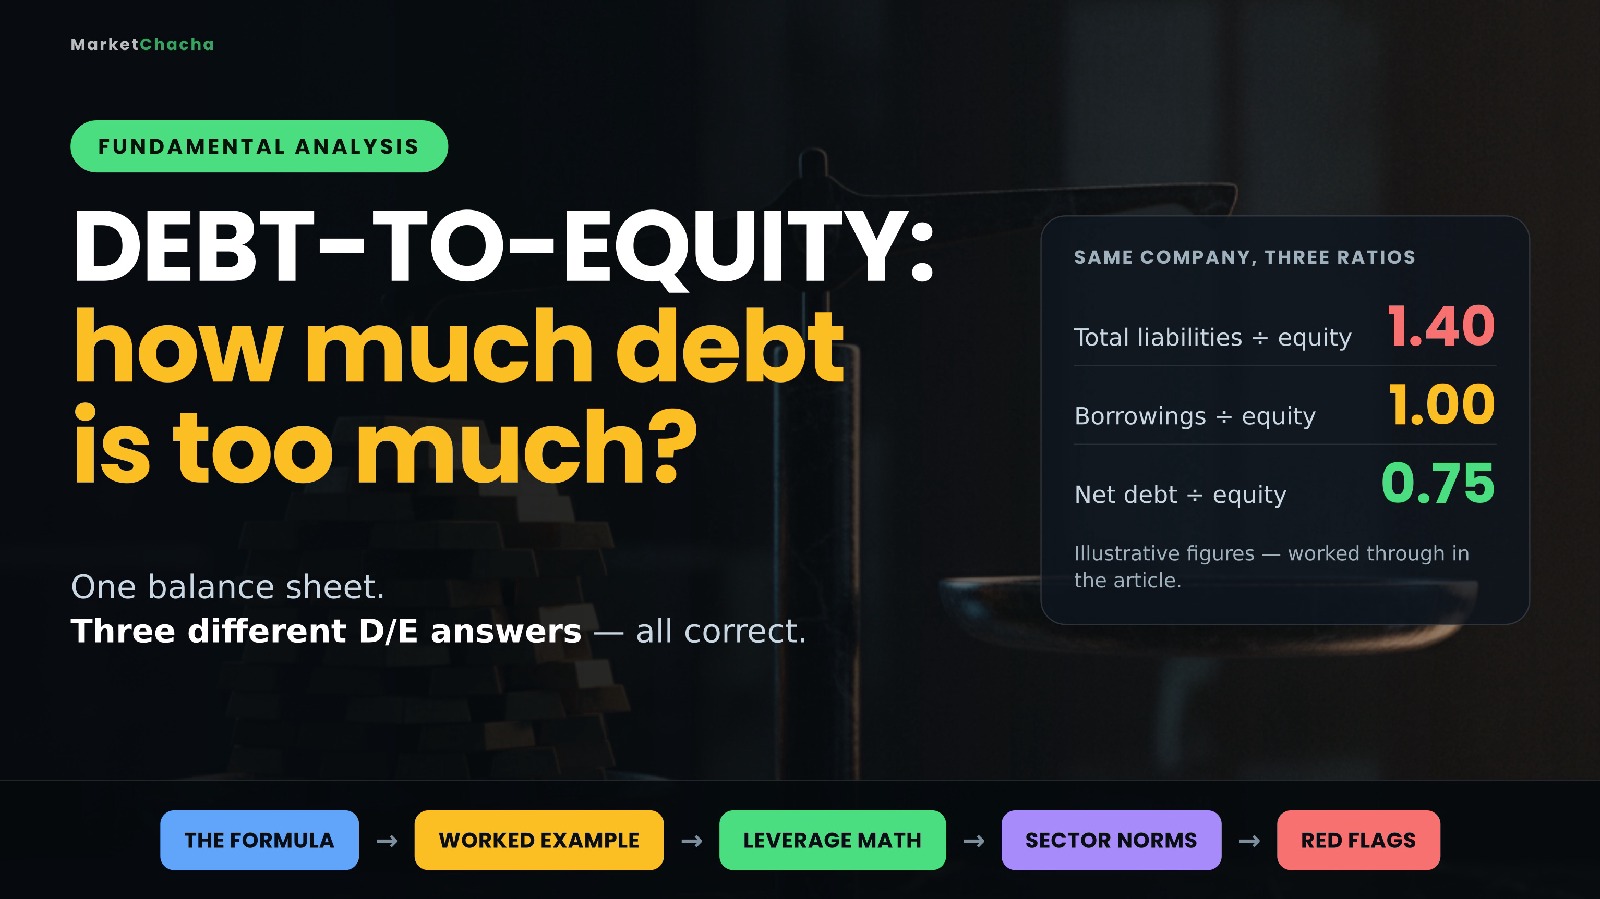
What is the debt-to-equity ratio — and how much debt is too much? (Beginner's In-Depth Guide)

The debt-to-equity ratio (D/E) tells you how much of a business is funded by borrowed money versus money the shareholders own. It is one division: what the company owes, divided by shareholders' equity. A D/E of 1.0 means lenders and shareholders have put in roughly the same amount; 0.3 means the company is mostly owner-funded; 3.0 means there is three times as much debt as equity behind the business. Debt is not automatically bad — it is the cheapest way to grow when things go well, and the fastest way to fail when they don't. This guide covers the formula and why two websites can give you two different D/E figures for the same company, a fu…

What is the debt-to-equity ratio — and how much debt is too much? (Beginner's In-Depth Guide)+2 more
0
ranjeet_singh
2 months ago

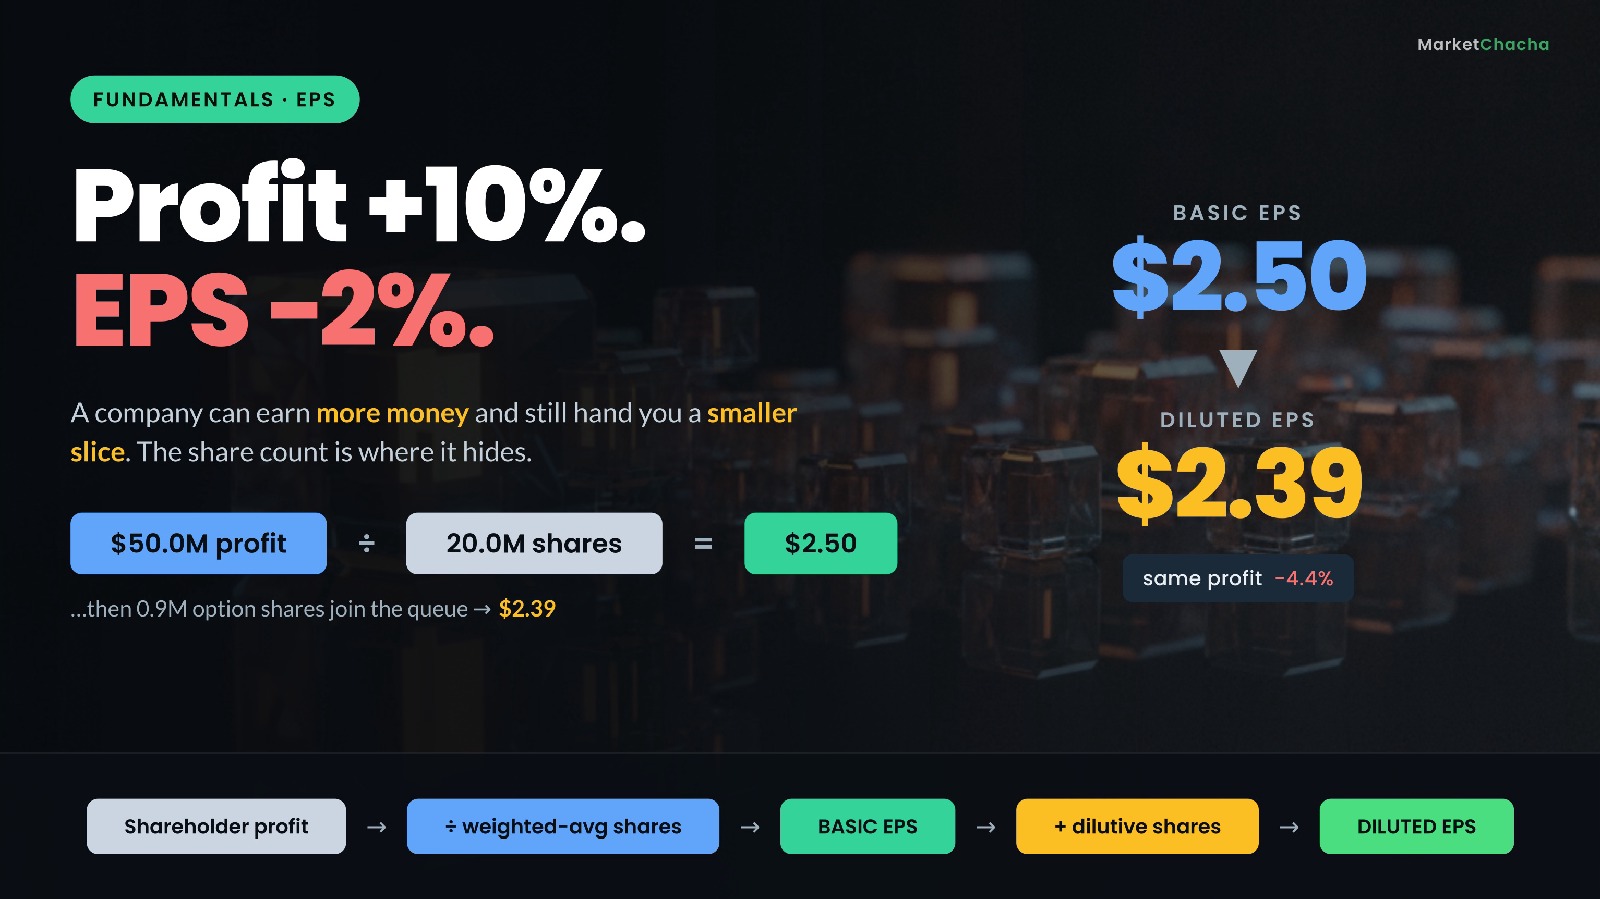
What is EPS — and what's the difference between basic and diluted earnings per share? (Beginner's In-Depth Guide)

Earnings per share (EPS) is a company's profit divided by the number of shares it has — the slice of the year's earnings that sits behind one single share. If a company earns $50 million for its ordinary shareholders and has 20 million shares, EPS is $2.50. That is the whole idea. What makes EPS worth a long article is not the top of the fraction but the bottom : the share count moves, it is a weighted average rather than a snapshot, and companies report two versions of it — basic and diluted . Get the denominator wrong and every conclusion you draw from EPS, including the P/E ratio, is wrong too. This guide walks through what EPS is, the exa…

What is EPS — and what's the difference between basic and diluted earnings per share? (Beginner's In-Depth Guide)+2 more
0
ranjeet_singh
2 months ago

How do you read a balance sheet? Assets, liabilities and equity explained (Beginner's In-Depth Guide)

A balance sheet is a snapshot of everything a company owns and everything it owes on one single day. It has two sides, and they must be equal: Assets = Liabilities + Equity . The left side lists what the business controls; the right side says who has a claim on it — lenders and suppliers first, shareholders last. Unlike the income statement, which covers a period ("the year ended…"), the balance sheet is frozen at one date, like a photograph rather than a film. This guide walks through both sides line by line, works through a real example using Apple's audited FY2025 balance sheet, shows you five checks you can run in five minutes, an…

How do you read a balance sheet? Assets, liabilities and equity explained (Beginner's In-Depth Guide)+2 more
0
ranjeet_singh
2 months ago

What is the P/E ratio — and how do you actually read it? (Trailing vs forward, PEG & earnings yield explained)

The price-to-earnings (P/E) ratio is the single most-quoted number in investing, and it answers one simple question: how much are you paying for every ₹1 (or $1) of a company's annual profit? You calculate it by dividing the share price by the earnings per share (EPS). A stock trading at $50 with EPS of $2.50 has a P/E of 20 — meaning investors are paying $20 for each $1 the company earns in a year. This guide breaks down exactly what the P/E ratio is, how to calculate it, the difference between trailing and forward P/E, the earnings yield and PEG ratio, when the number is misleading, and how to actually use it without getting fooled. What th…

What is the P/E ratio — and how do you actually read it? (Trailing vs forward, PEG & earnings yield explained)+2 more
0
ranjeet_singh
2 months ago

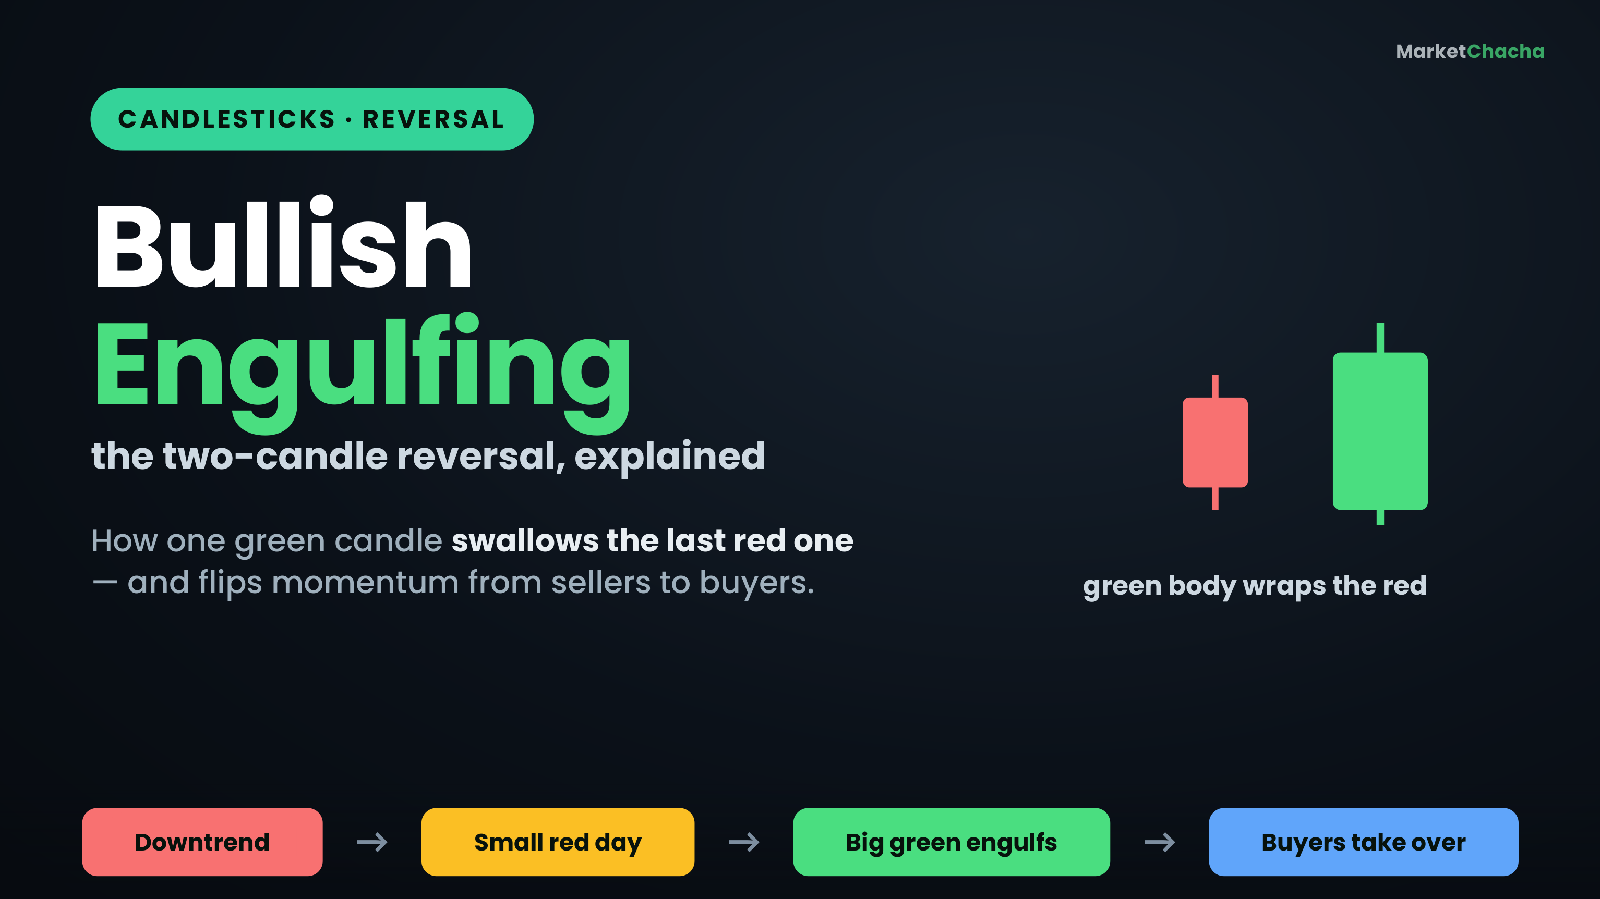
What is a Bullish (and Bearish) Engulfing Candlestick Pattern? The Two-Candle Reversal Explained (Beginner's In-Depth Guide)

A bullish engulfing is a two-candle reversal pattern in which a small down (red) candle is followed by a larger up (green) candle whose real body completely covers — "engulfs" — the body of the candle before it . It signals that after a slide lower, buyers have suddenly overwhelmed sellers. Its mirror twin, the bearish engulfing , is a large red candle that swallows a prior small green one after a rise, hinting that sellers have seized control. This in-depth guide explains exactly how each pattern is built, walks through the numbers with a worked example, unpacks the crowd psychology that makes them tick, and shows what separates a re…

What is a Bullish (and Bearish) Engulfing Candlestick Pattern? The Two-Candle Reversal Explained (Beginner's In-Depth Guide)+2 more
0
ranjeet_singh
2 months ago

What are support and resistance levels — and how do you actually use them?

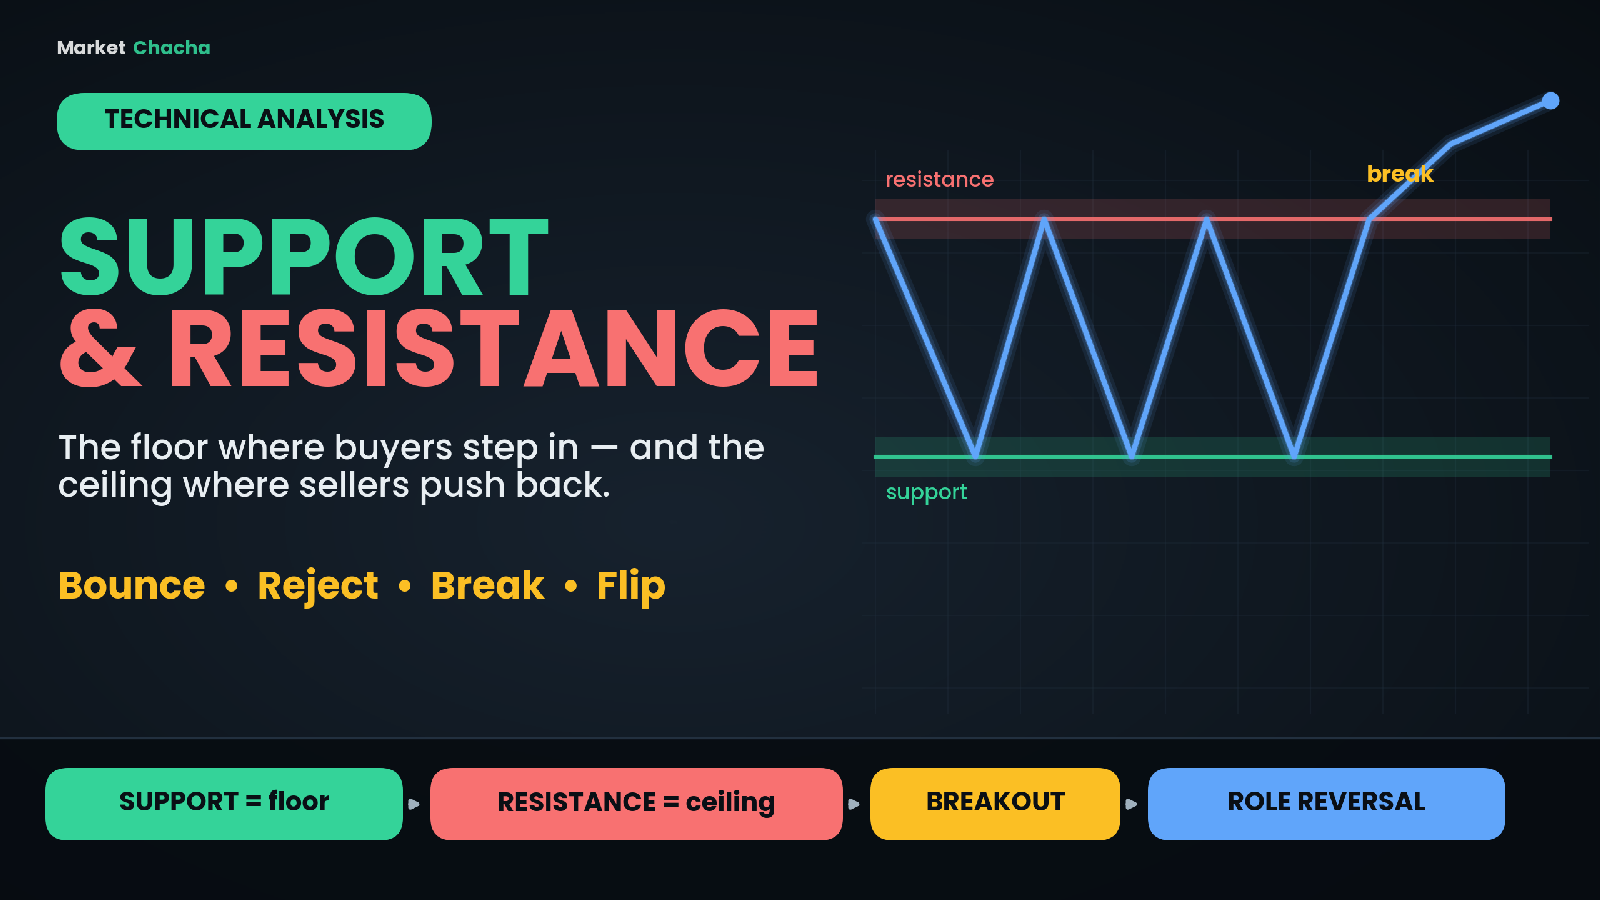
Support is a price zone where a falling market tends to stop and turn back up, because buyers step in faster than sellers can push the price down. Resistance is the opposite: a price zone where a rising market tends to stall and turn back down, because sellers take over from buyers. Put simply, support is the floor of a price range and resistance is the ceiling — and almost every other tool in technical analysis, from trendlines to breakouts, is built on top of these two ideas. This guide explains what support and resistance really are, why they form, how to read them with a worked example, the powerful "role reversal" idea, how to te…

What are support and resistance levels — and how do you actually use them?+2 more
0
ranjeet_singh
3 months ago

What is MACD? The 12/26/9 crossover, signal line & histogram explained (Beginner's In-Depth Guide)

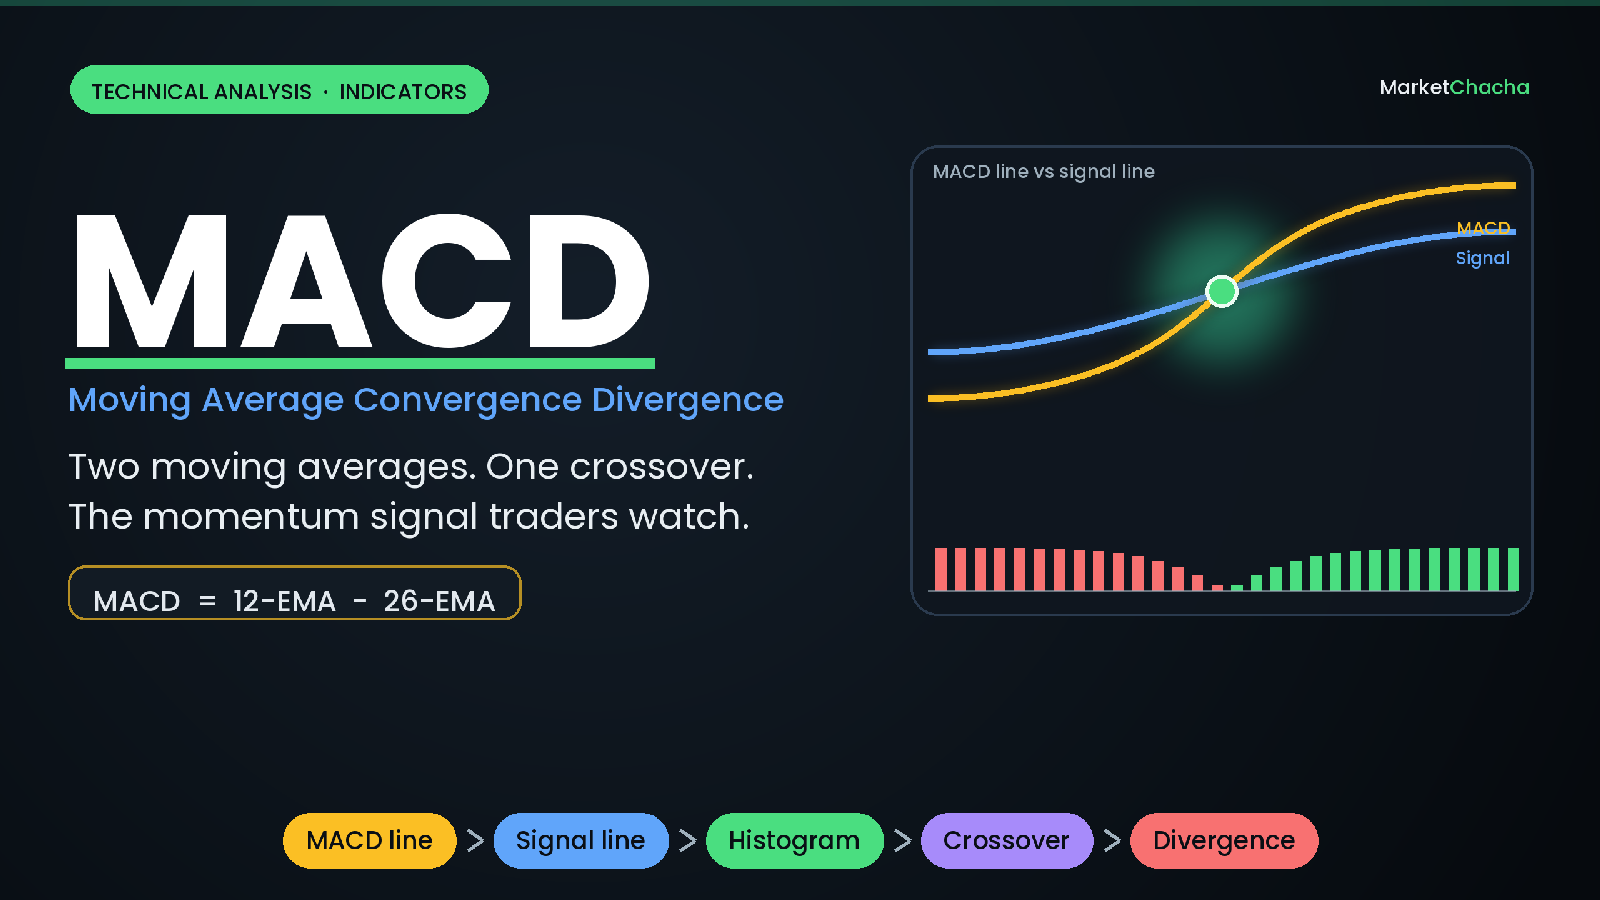
MACD (Moving Average Convergence Divergence) is a momentum indicator that measures the gap between two moving averages of a stock's price — a fast 12-period average and a slow 26-period one. When the fast average pulls away from the slow one, momentum is strengthening; when they drift back together, momentum is fading. MACD packages that idea into three things you read straight off a chart: the MACD line , a signal line , and a histogram . It was developed by Gerald Appel in the late 1970s (the histogram was added later, by Thomas Aspray in 1986), and it is one of the most widely used tools in technical analysis because it shows trend and mom…

What is MACD? The 12/26/9 crossover, signal line & histogram explained (Beginner's In-Depth Guide)+2 more
1
ranjeet_singh
3 months ago

What is the Head and Shoulders Pattern? The Neckline, the Break & the Measured Target (Beginner's In-Depth Guide)

A head and shoulders pattern is a chart shape that warns an existing trend may be about to reverse. In its classic "top" form it appears after a rally as three peaks in a row — a smaller peak (the left shoulder ), a taller peak (the head ), and another smaller peak (the right shoulder ) — all sitting on a shared support line called the neckline . When price finally closes below that neckline, the uptrend is considered broken and traders expect a move lower. This guide walks through every part of the pattern, shows the exact arithmetic used to estimate a price target, explains the role of volume, covers the bullish mirror image (the in…

What is the Head and Shoulders Pattern? The Neckline, the Break & the Measured Target (Beginner's In-Depth Guide)+2 more
0
ranjeet_singh
3 months ago

What is RSI (Relative Strength Index)? Overbought, oversold & divergence explained (Beginner's In-Depth Guide)

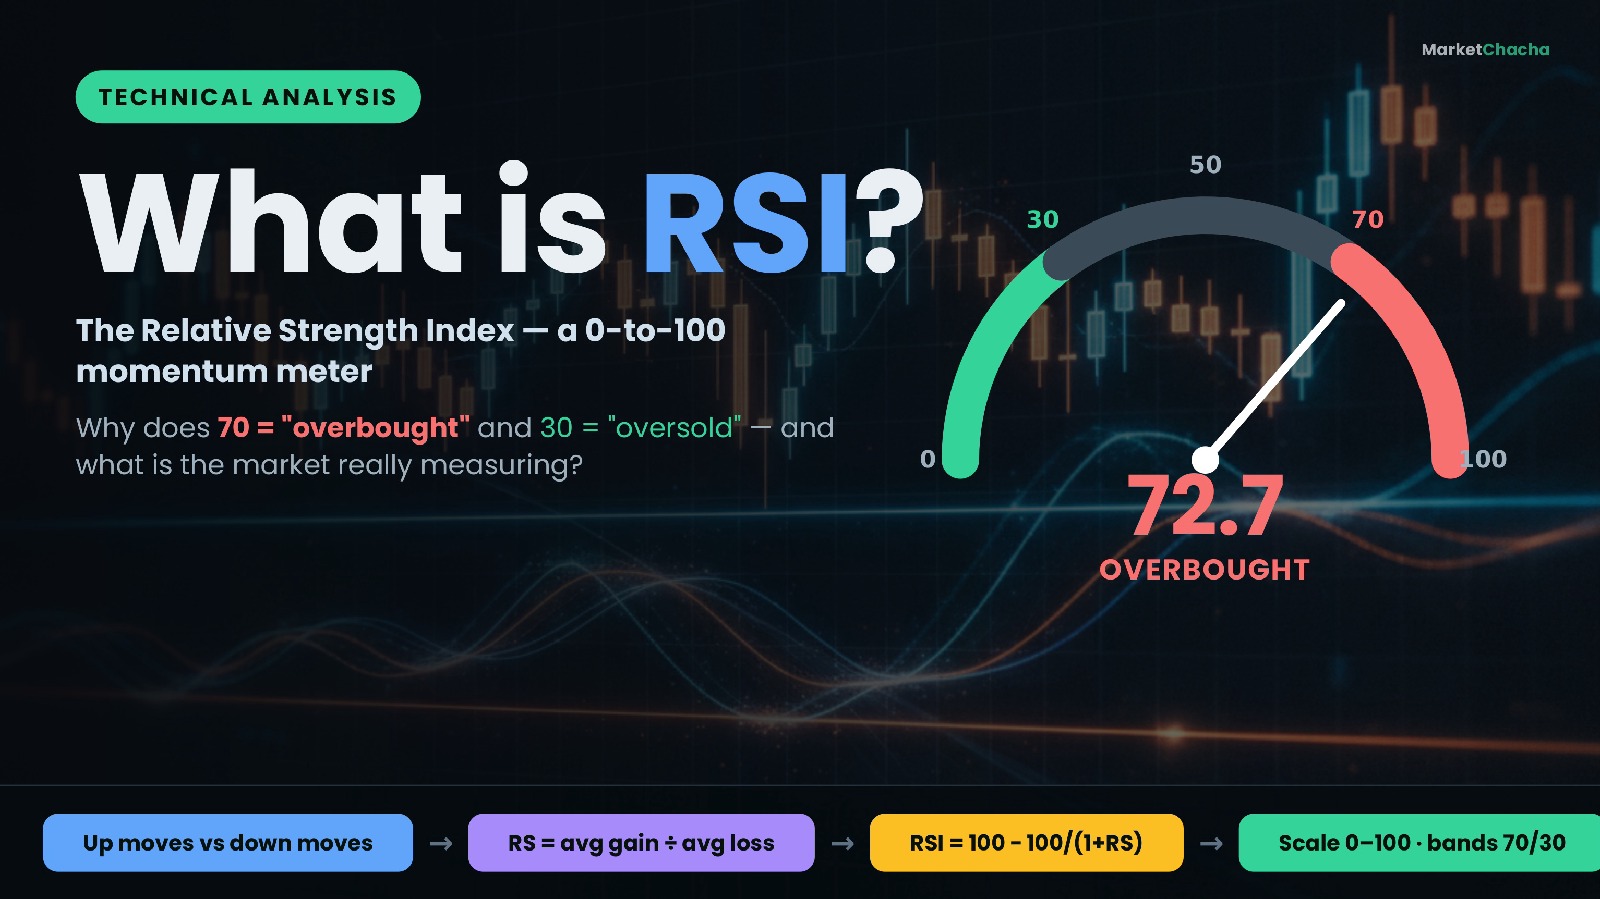
The Relative Strength Index (RSI) is a momentum indicator that measures how strong a stock's recent up-moves have been compared with its recent down-moves, and squeezes that comparison into a single number between 0 and 100. A reading above 70 is traditionally called "overbought" and a reading below 30 "oversold". RSI was created by engineer-turned-trader J. Welles Wilder Jr. and published in his 1978 book New Concepts in Technical Trading Systems . This guide explains what RSI is really measuring, the exact formula, a worked example you can follow by hand, what the 70/30 lines do and don't mean, divergence, and the mistakes b…

What is RSI (Relative Strength Index)? Overbought, oversold & divergence explained (Beginner's In-Depth Guide)+2 more
0
ranjeet_singh
3 months ago

Moving Averages Explained: SMA vs EMA, the Golden Cross & the Death Cross (Beginner's In-Depth Guide)

A moving average is simply the average price of a stock or index over a set number of recent days, recalculated every day so it "moves" forward with the market. It smooths out the daily zig-zag of prices so you can see the underlying trend. When a shorter average crosses a longer one, traders get two of the most famous signals in charting: the golden cross (a shorter average rising above a longer one — widely read as bullish) and the death cross (the shorter average falling below — widely read as bearish). This guide explains what a moving average is, how it is calculated (with the actual arithmetic), the difference between the two ma…

Moving Averages Explained: SMA vs EMA, the Golden Cross & the Death Cross (Beginner's In-Depth Guide)+2 more
0
ranjeet_singh
3 months ago

Flag and Pennant Patterns Explained: The Flagpole, the Breakout & the Measured-Move Target (Beginner's In-Depth Guide)

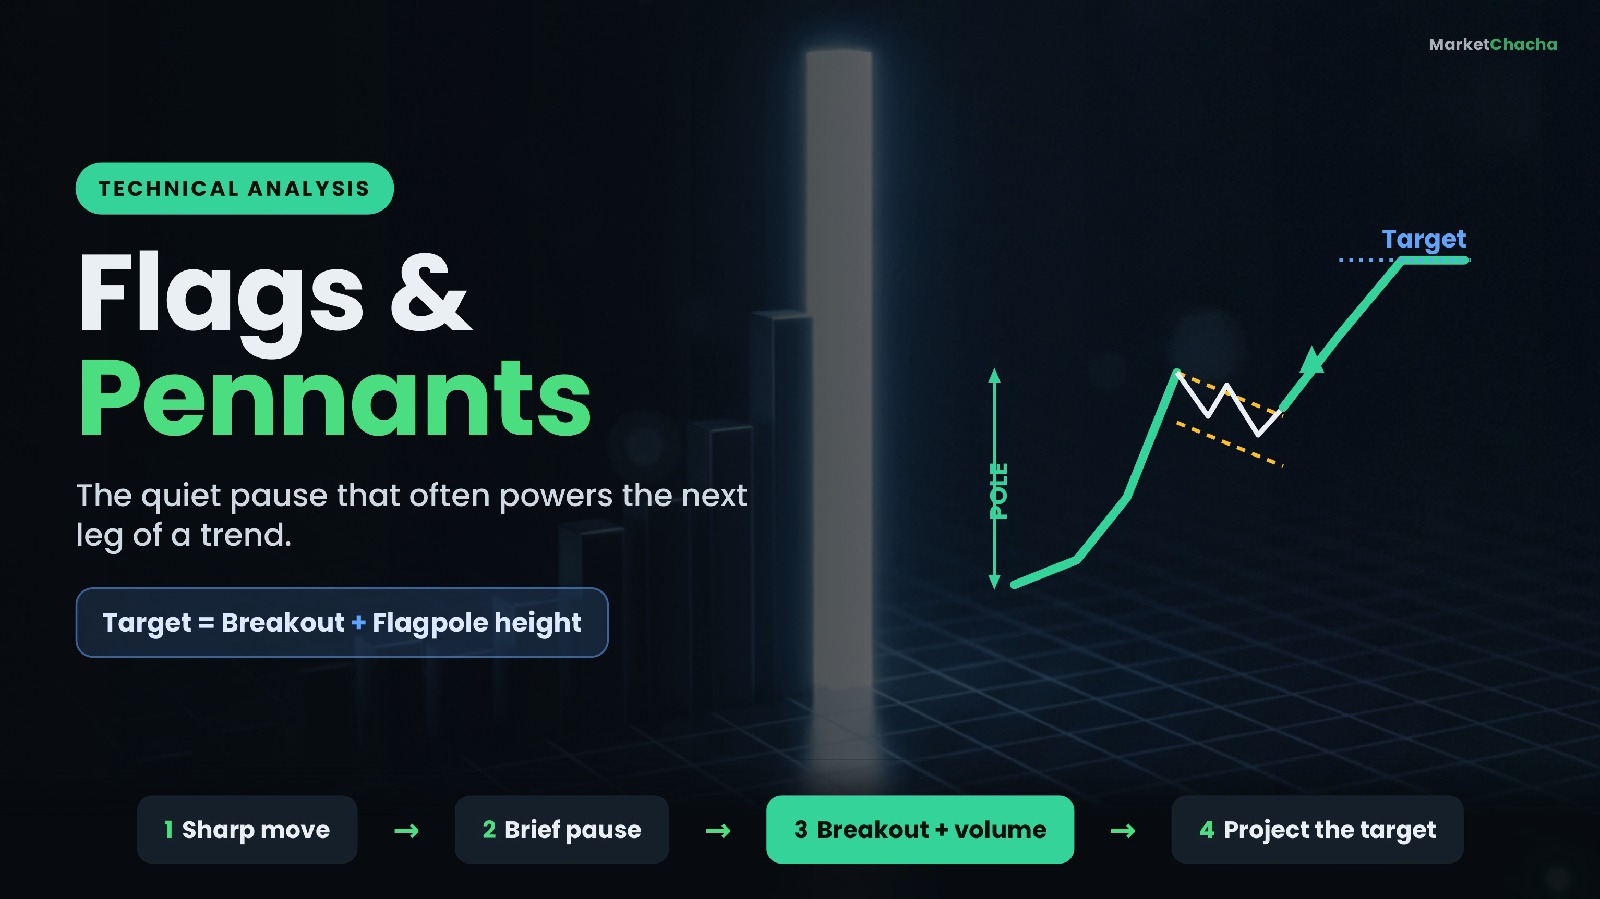
A flag and a pennant are short-term "continuation" chart patterns: after a stock makes a sharp move in one direction, it pauses and drifts sideways for a few days to about three weeks, and then — more often than not — it breaks out and continues in the same direction as that first sharp move. Think of it as the market catching its breath before the next leg. The sharp move is the flagpole ; the tidy little consolidation that follows is the flag (a small tilted rectangle) or the pennant (a small triangle). This guide explains exactly what forms these patterns, how to tell a flag from a pennant, how traders estimate a price target from…

Flag and Pennant Patterns Explained: The Flagpole, the Breakout & the Measured-Move Target (Beginner's In-Depth Guide)+2 more
0
ranjeet_singh
3 months ago

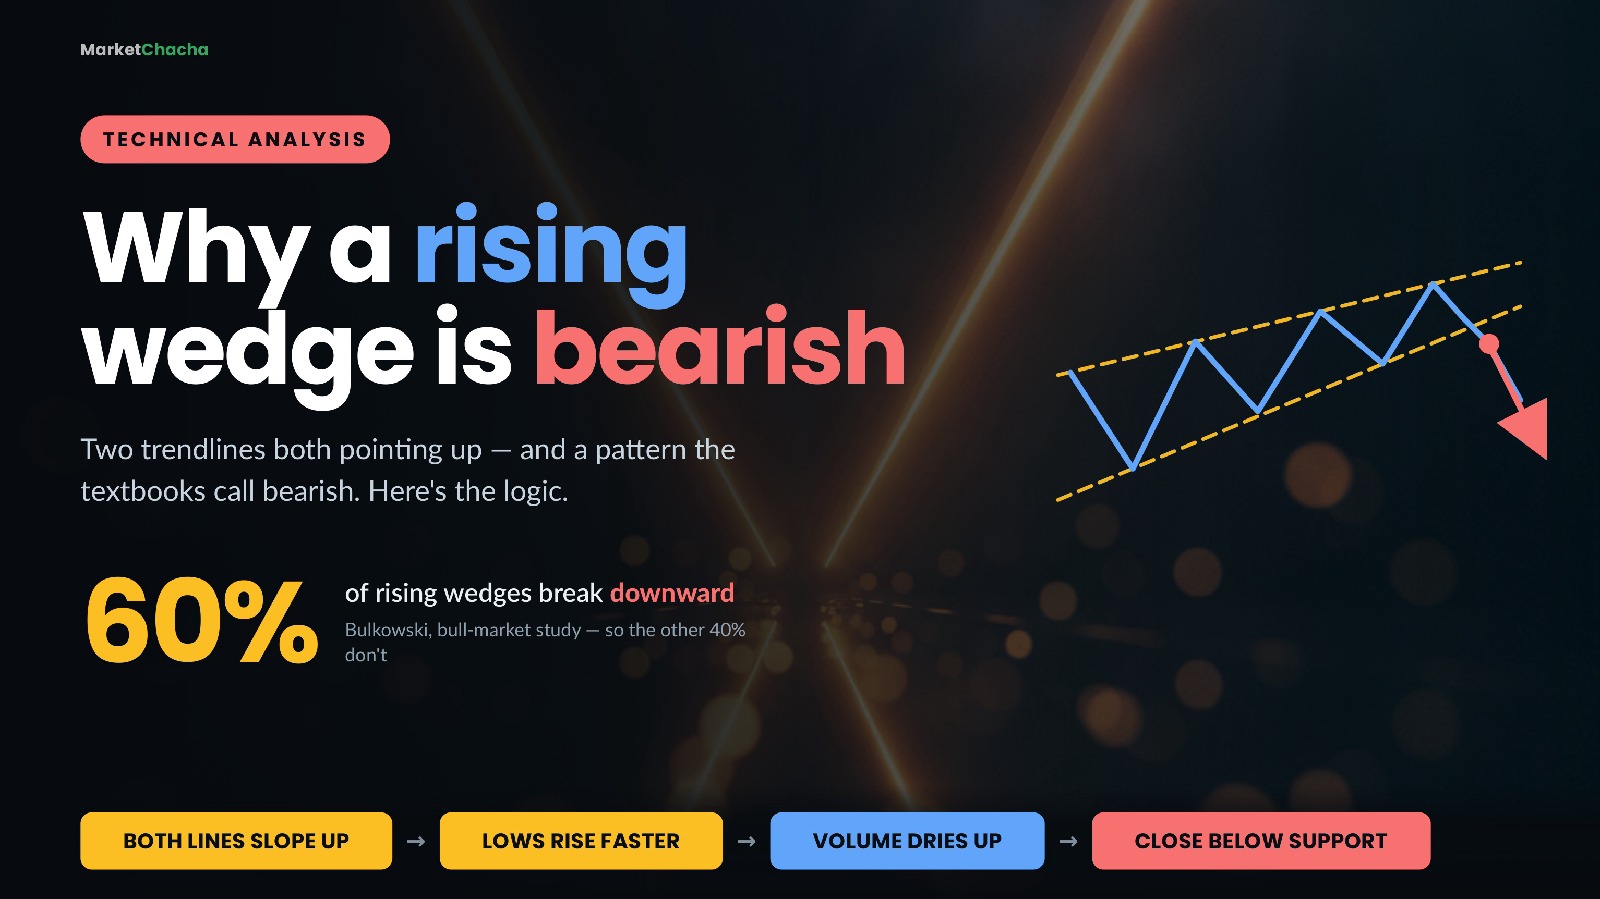
Rising Wedge vs Falling Wedge Explained: Why an Upward-Sloping Pattern Is Bearish (Beginner's In-Depth Guide)

A wedge is a chart pattern in which price gets squeezed between two trendlines that slope in the same direction and gradually converge. A rising wedge slopes upward and is read as bearish . A falling wedge slopes downward and is read as bullish . That sounds backwards — an upward-sloping pattern that predicts a fall — and understanding exactly why it isn't backwards is the entire lesson. This guide covers how to identify a wedge properly, why the slope of each trendline matters more than the slope of the pattern, a fully worked example with the measure rule arithmetic, what decades of measured research actually say about how often wedges work…

Rising Wedge vs Falling Wedge Explained: Why an Upward-Sloping Pattern Is Bearish (Beginner's In-Depth Guide)+2 more
0
ranjeet_singh
3 months ago

What is F&O? Futures and Options explained simply for beginners (with examples)

F&O stands for Futures and Options. In one line: it's a way to make a deal on a price now and settle it later, without buying the actual thing — you're trading a contract that copies the price of a stock, an index, gold or a currency. If that already sounds like a foreign language, relax. By the end of this guide you'll understand futures, options, calls, puts, margin and premium the way you understand a movie ticket or a phone pre-booking — because those are exactly the everyday ideas hiding behind the jargon. We'll go slow, use real examples with real numbers, and be honest about why most people lose money at this. (A separate guide covers…

What is F&O? Futures and Options explained simply for beginners (with examples)+2 more
0
ranjeet_singh
3 months ago

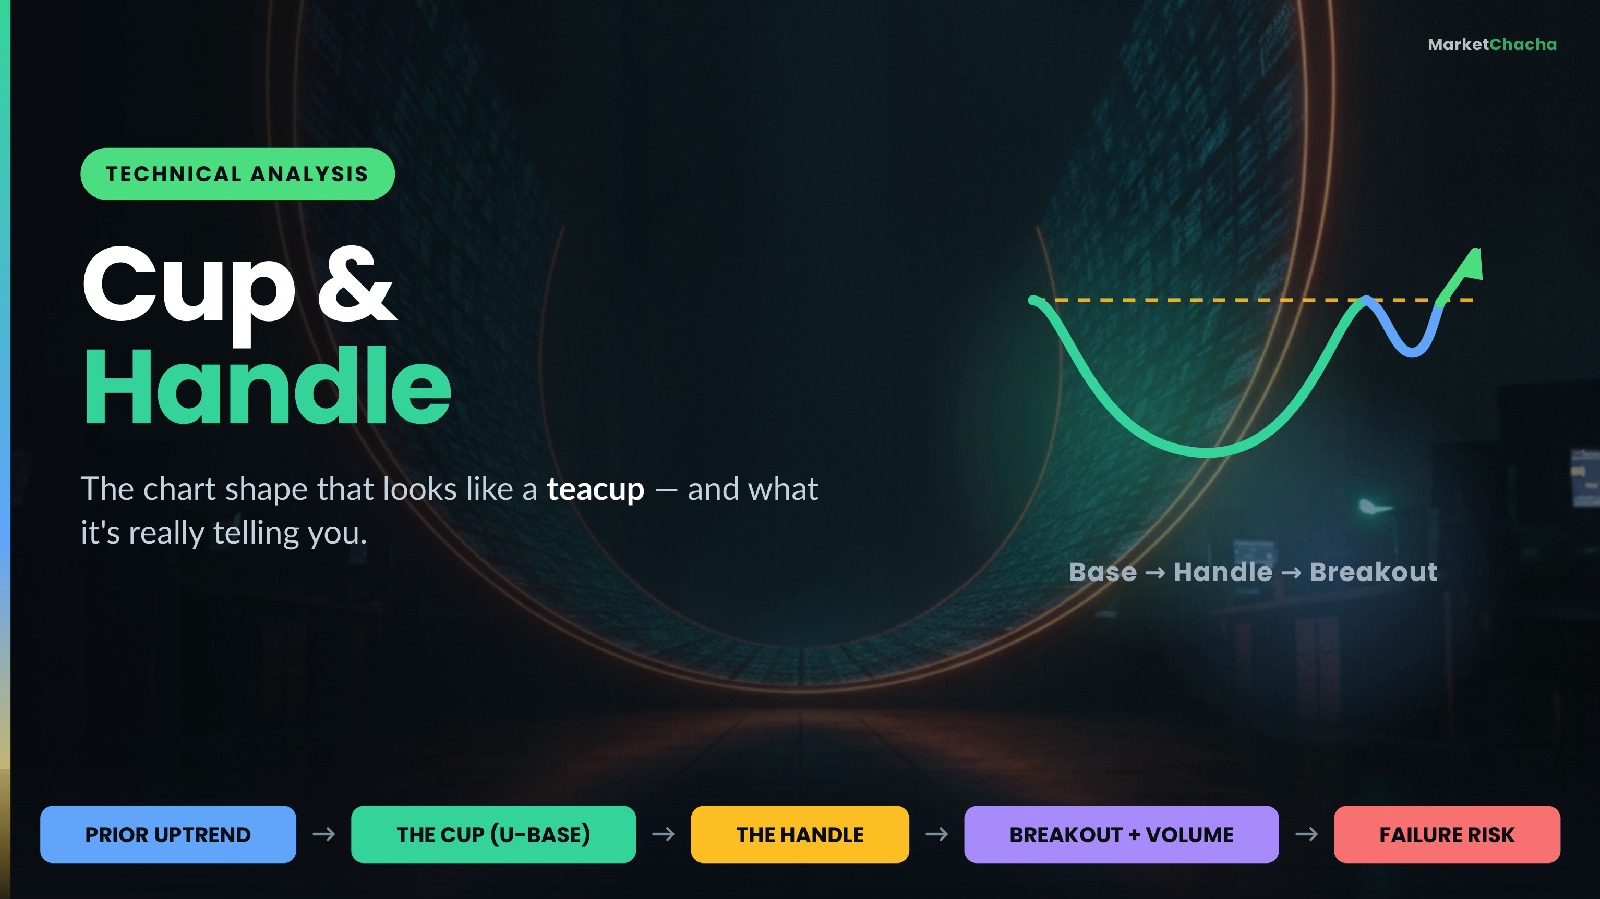
Cup and Handle Pattern Explained: The Base, the Handle & the Breakout (Beginner's In-Depth Guide)

A cup and handle is a chart pattern in which a stock's price forms a rounded, U-shaped base (the "cup"), then drifts sideways-to-lower in a small, shallow pullback near the top of that base (the "handle"), before attempting to break out above the level where the cup began. It is classified as a bullish continuation pattern — a pause inside an existing uptrend rather than a reversal of a downtrend. It was popularised by William O'Neil, who described it in How to Make Money in Stocks as one of the classic bases that leading stocks form before a new advance. This guide walks through what each part of the shape actually represents…

Cup and Handle Pattern Explained: The Base, the Handle & the Breakout (Beginner's In-Depth Guide)+2 more
0