

Rising Wedge vs Falling Wedge Explained: Why an Upward-Sloping Pattern Is Bearish (Beginner's In-Depth Guide)
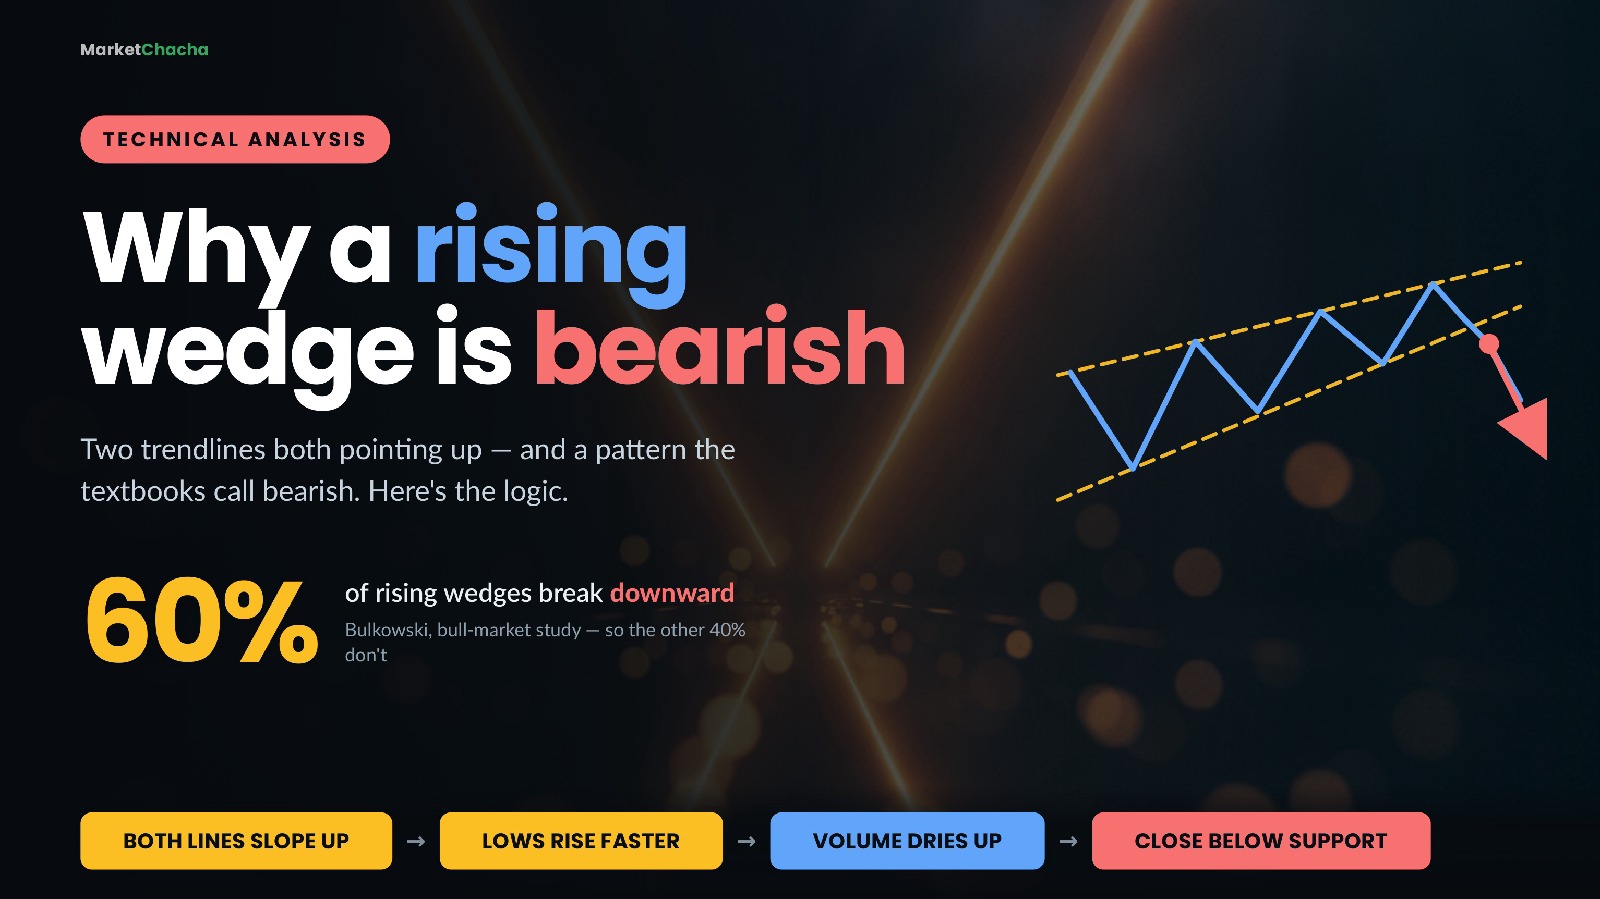
A wedge is a chart pattern in which price gets squeezed between two trendlines that slope in the same direction and gradually converge. A rising wedge slopes upward and is read as bearish. A falling wedge slopes downward and is read as bullish. That sounds backwards — an upward-sloping pattern that predicts a fall — and understanding exactly why it isn't backwards is the entire lesson.
This guide covers how to identify a wedge properly, why the slope of each trendline matters more than the slope of the pattern, a fully worked example with the measure rule arithmetic, what decades of measured research actually say about how often wedges work, and the mistakes that catch out most beginners.
What makes a wedge a wedge (and not a triangle)
Beginners constantly mix up wedges and triangles because both are "narrowing" patterns. The difference is the slope of the two boundary lines.
- Triangle. An ascending triangle has a flat top; a descending triangle has a flat bottom; a symmetrical triangle has one line up and one line down, so the pattern as a whole has no directional tilt.
- Wedge. Both lines slope the same way — both up, or both down — and they converge as the pattern matures.
Two more identification rules matter, both from Thomas Bulkowski's pattern research:
- Duration. A wedge needs a minimum of about three weeks. A narrowing squeeze that resolves in a few days is a pennant, which is a different pattern with different behaviour.
- Touches. Price should touch the trendlines at least five times in total — three touches on one line and two on the other. Two touches is not a trendline; it is a line drawn through two random points.
StockCharts notes that rising wedges typically take three to six months to form on a daily chart, which tells you something important: this is a swing- or position-timeframe pattern, not something you spot in an hour of intraday data.
The rising wedge: an uptrend running out of buyers
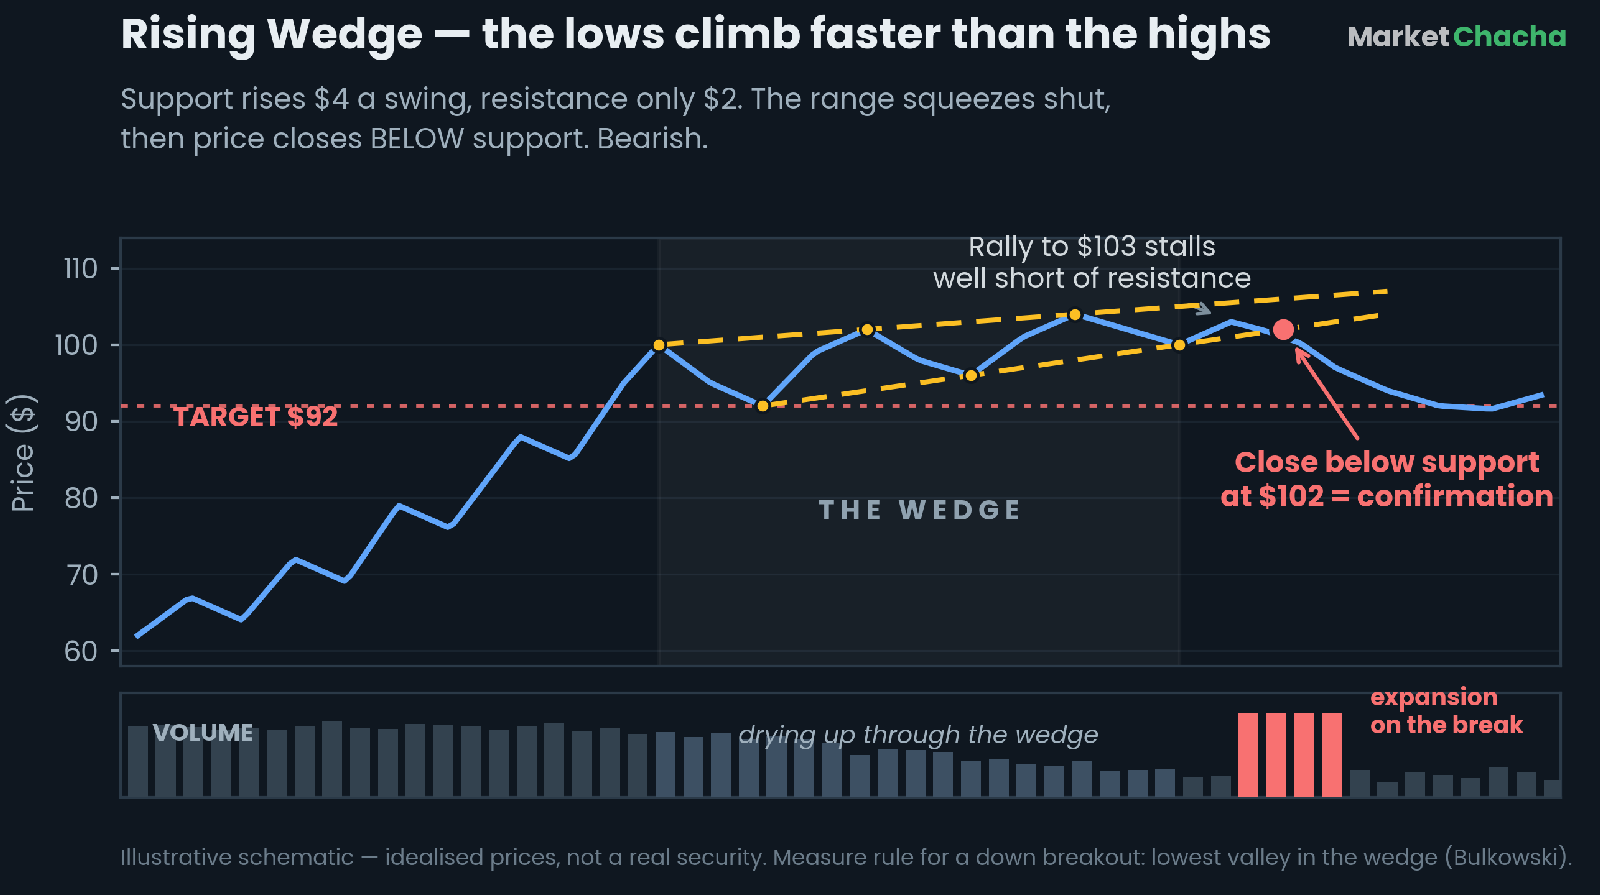
Look at the diagram above. Price is making higher highs and higher lows — textbook uptrend behaviour. So why is this bearish?
Because of the rates. The highs advance by $2 each swing: $100, $102, $104. The lows advance by $4 each swing: $92, $96, $100. The floor is rising twice as fast as the ceiling, so the vertical gap between the two lines collapses from about $9 to about $5.
Translate that into behaviour. Buyers are still stepping in earlier and earlier on every dip — that is what the fast-rising lows mean, and it looks like strength. But each rally dies sooner than the last. The buying is getting more urgent while the reward for it is shrinking. StockCharts describes this as a supply overhang: sellers are willing to meet every advance, and the advances become, in their words, "unconvincing."
The crucial point, and the one most beginners get wrong: the rising wedge is bearish regardless of where it appears. Whether it forms at the top of an uptrend (a reversal) or as a rally inside an existing downtrend (a continuation), the bias is the same. The shape carries the message, not the context.
The falling wedge: a downtrend running out of sellers
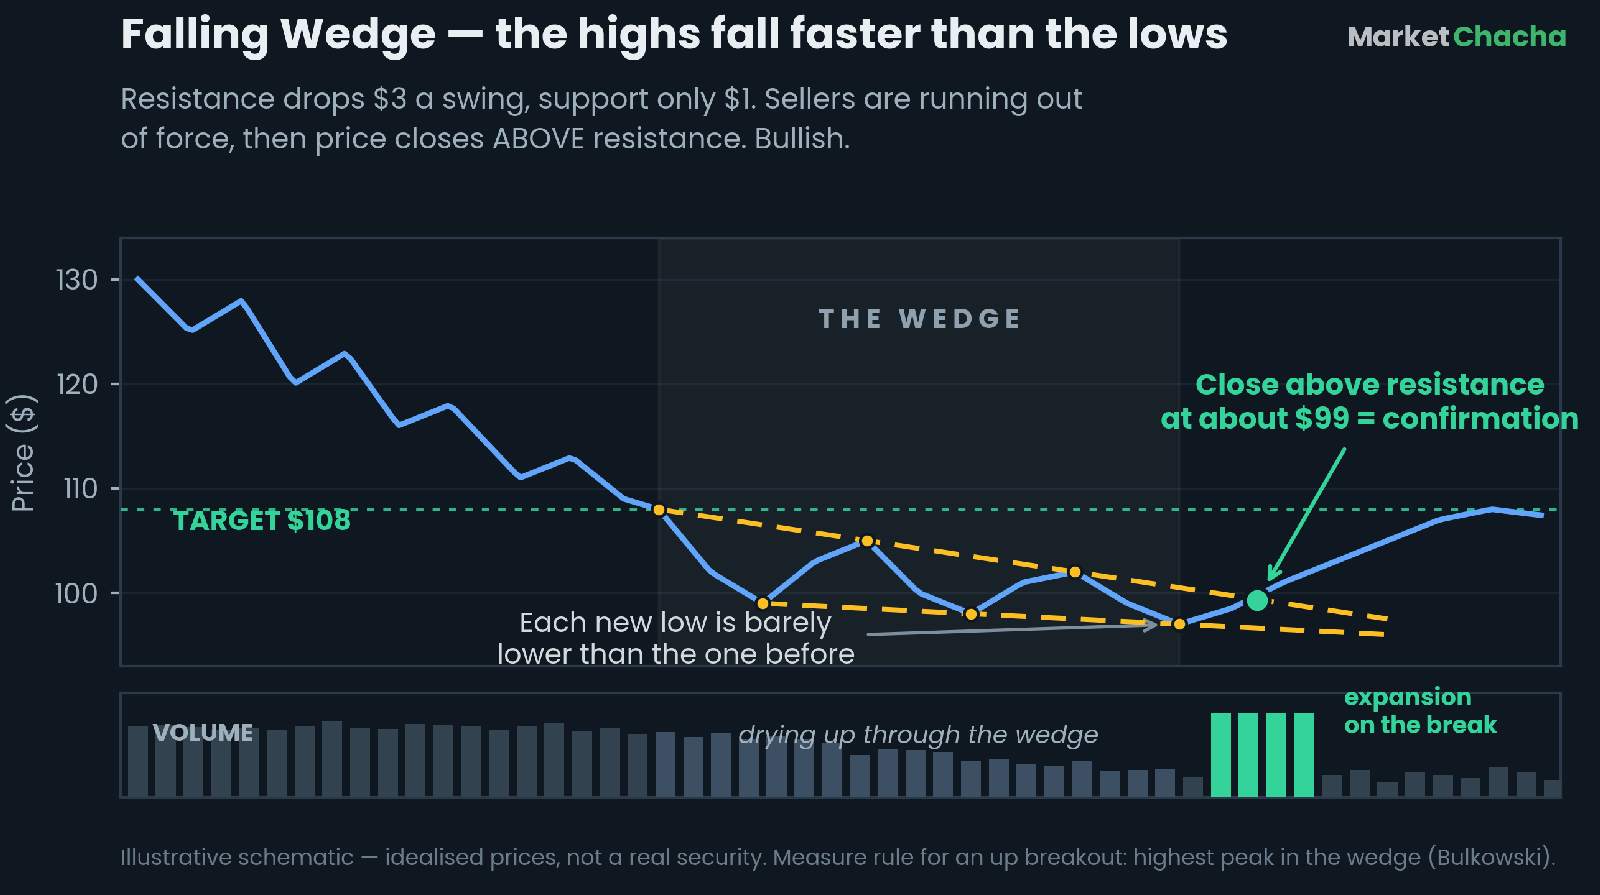
The falling wedge is the mirror image. Price makes lower highs and lower lows, but the ceiling is dropping much faster than the floor: highs fall $3 a swing ($108, $105, $102) while lows fall only $1 ($99, $98, $97).
Sellers can still cap every bounce, but they can no longer force meaningful new lows. Selling pressure is exhausting itself against a floor that refuses to give way — so the pattern is read as bullish, whether it appears at the end of a downtrend (reversal) or as a pullback inside an uptrend (continuation).
The worked example: how the measure rule actually works
Take the rising wedge from the diagram and walk through it step by step.
- The pattern. Highs at $100, $102, $104 on the resistance line. Lows at $92, $96, $100 on the support line. Highest peak in the wedge: $104. Lowest valley: $92. So the pattern height is $12.
- The failed rally. After the $100 low, price bounces to only $103 — well short of the resistance line, which by then sits above $105. That failure is the warning.
- Confirmation. Price then closes at $102, below the rising support line. A close outside a trendline is what converts a drawing into a confirmed pattern. Until that close happens, there is no pattern — only a shape.
- The target, method one. Bulkowski's measure rule for a downward breakout is simply the lowest valley inside the wedge: $92. From the $102 breakout that is a $10 fall, or about 9.8%.
- The target, method two. A more conservative version multiplies the pattern height by how often the target is actually reached. Rising wedges hit their downside target only 32% of the time, so: $12 × 0.32 = $3.84, subtracted from $102, giving $98.16.
For the falling wedge, the rule flips: the target is the highest peak inside the wedge, $108. From a breakout at roughly $99 that is a $9 rise, about 9.1%. The haircut version: $11 height × 62% = $6.82, added to $99, giving $105.82.
Worth knowing that these targets are contested. StockCharts states plainly that for the rising wedge "there are no measuring techniques to estimate the decline" and recommends using other tools to set targets. Treat any wedge target as a rough expectation, not a forecast.
Volume: the tell that makes a wedge credible
Volume should shrink as the wedge forms. In Bulkowski's data, volume trends downward through the pattern 79% of the time in rising wedges and 72–75% of the time in falling wedges. That fading participation is what the narrowing range looks like in a second dimension: fewer and fewer traders are willing to act inside a range that keeps getting tighter.
Then, on the break, volume should expand. StockCharts treats a volume expansion on the support break as bearish confirmation for a rising wedge, and heavy breakout-day volume is associated with better performance in falling wedges. A break on quiet volume is the classic setup for a fakeout.
One caveat worth internalising: shrinking volume inside the wedge is context, not a signal. It does not tell you which way price will break. Only the close outside a trendline does that.
What the research actually says — and why wedges disappoint
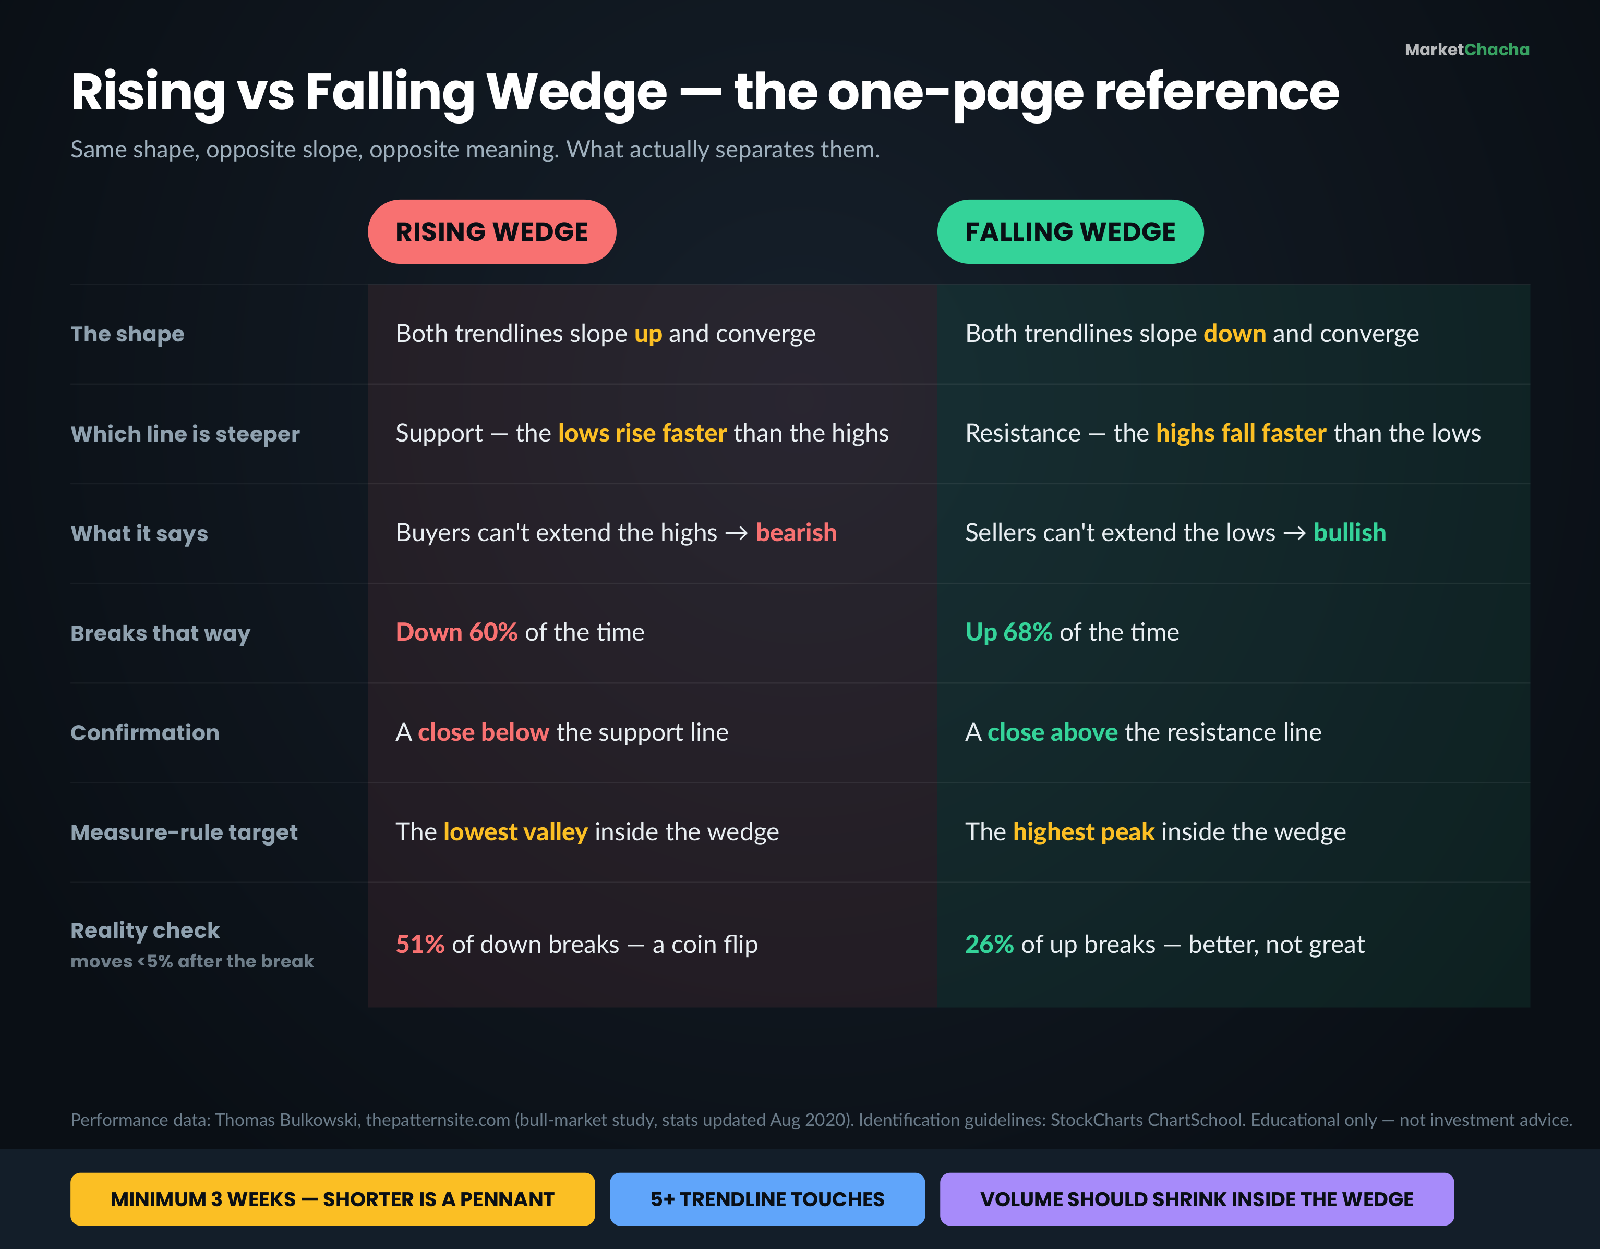
Most articles about wedges quote success rates of 70–80%. Bulkowski's bull-market study, built on more than 1,400 rising-wedge trades and over 800 falling-wedge trades in US stocks, tells a far more sober story.
First, the useful definition. His break-even failure rate measures how often a pattern fails to move at least 5% in the breakout direction — roughly, how often the trade never covers its own costs.
- Rising wedge. Breaks downward 60% of the time. But 51% of those downward breaks fail to fall even 5%, and the average decline is only 9%. It reaches its measured target just 32% of the time. Bulkowski ranks it last — 36th out of 36 bearish patterns for downward breakouts.
- Falling wedge. Better, but not good. Breaks upward 68% of the time, with a 26% break-even failure rate, a 38% average rise, and a 62% target-hit rate — ranked 31st out of 39 bullish patterns.
Two more numbers explain a lot of beginner frustration. Roughly 72% of rising wedges, and 62% of falling wedges that break upward, see price come straight back to the breakout level within 30 days. If you enter on the break and place a tight stop just inside the pattern, the odds are you get stopped out on the retest before the move you predicted ever happens.
And a fairness caveat: all of these figures are based on "perfect trades" — flawless entry at the breakout and a flawless exit at the eventual high or low, on US stocks, in bull-market conditions. Real-world results are worse, not better. Bulkowski's own comment on one of his falling-wedge examples is blunt: it is "a good example of why I avoid wedges."
None of this means the pattern is useless. It means the wedge is best treated as a warning that momentum is fading — a reason to pay closer attention, tighten risk, or look for confirmation elsewhere — rather than as a standalone trade signal.
Common mistakes beginners make
- Drawing the wedge on two touches. Any two points make a line. You need five touches across both lines before the shape means anything.
- Calling a three-day squeeze a wedge. Under three weeks it is a pennant, and pennant behaviour is different.
- Trading the shape instead of the break. A wedge is not confirmed until price closes outside a trendline. Anticipating the break is the single most common way to lose money on this pattern.
- Reading the slope as the direction. The rising wedge slopes up and breaks down. If you take the slope as your signal you will be wrong most of the time — this is the whole point of the pattern.
- Expecting a large move. A 9% average decline on a rising wedge is modest, and half of them do not even manage 5%.
- Getting shaken out by the retest. Price returns to the breakout level most of the time. A stop placed a few cents inside the pattern will be hit.
- Confusing it with a symmetrical triangle. If one line slopes up and the other slopes down, it is a triangle, and it carries no directional bias.
How to read a wedge on a chart, step by step
- 1. Find two converging trendlines that slope the same way. Both up, or both down. If not, it is not a wedge.
- 2. Count the touches. Five or more across the two lines, ideally three on one and two on the other.
- 3. Check the duration. At least three weeks; often several months.
- 4. Identify the steeper line. Support steeper than resistance means a rising wedge (bearish). Resistance steeper than support means a falling wedge (bullish).
- 5. Check the volume trend. It should be fading as the pattern matures.
- 6. Wait for a close outside a trendline. Ideally on expanded volume. No close, no pattern.
- 7. Mark the pattern's extreme. The lowest valley (rising wedge) or highest peak (falling wedge) as a rough target — and plan for a retest of the breakout level before anything else happens.
FAQ
Why is a rising wedge bearish when the price is going up? Because the lows are rising faster than the highs. Buyers are working harder on each dip while each rally advances less, so the range squeezes shut. The pattern measures fading momentum, not the direction of the current move.
What is the difference between a wedge and a triangle? In a wedge both trendlines slope in the same direction and converge. In a triangle one line is flat (ascending or descending) or the two lines slope in opposite directions (symmetrical). Wedges carry a directional bias; a symmetrical triangle does not.
How reliable is the falling wedge pattern? Moderately, at best. In Bulkowski's bull-market study it broke upward 68% of the time, but 26% of those breakouts failed to rise even 5%, and it ranked 31st out of 39 bullish chart patterns. It is more reliable than the rising wedge, which ranked last among bearish patterns.
How do you calculate a price target from a wedge? The common measure rule uses the pattern's own extreme: for a downward break from a rising wedge, the lowest valley inside the wedge; for an upward break from a falling wedge, the highest peak. A more conservative approach multiplies the wedge's height by the historical target-hit rate before adding or subtracting it. Note that StockCharts considers the rising wedge to have no reliable measuring technique at all.
How long does a wedge take to form? At least three weeks — anything shorter is classified as a pennant. Rising wedges on daily charts commonly develop over three to six months.
What confirms a wedge breakout? A close outside one of the two trendlines, ideally accompanied by an expansion in volume. Intraday pokes through a line that close back inside do not count. Expect price to return to the breakout level within 30 days in most cases.
Educational content only — not investment advice, and not a recommendation to buy or sell any security. Chart pattern statistics are historical, based on US stocks in bull-market conditions, and do not predict future results. [Sources: StockCharts ChartSchool — Rising Wedge, Bulkowski on Rising Wedges, Bulkowski on Falling Wedges, ThePatternSite glossary.] Always do your own research.
This article is for educational and informational purposes only. It is not financial advice, investment recommendation, or a solicitation to buy or sell securities. Investing involves significant risks. I am not a SEBI-registered investment advisor. Readers should consult their own financial advisor and conduct their own research before making any investment decisions.
Comments
Join the conversation
Sign in to join the conversation.
Follow replies, add your view, and take part in the discussion.
Sign in to commentLoading comments...