

What is a hammer candlestick — and how is it different from a hanging man?
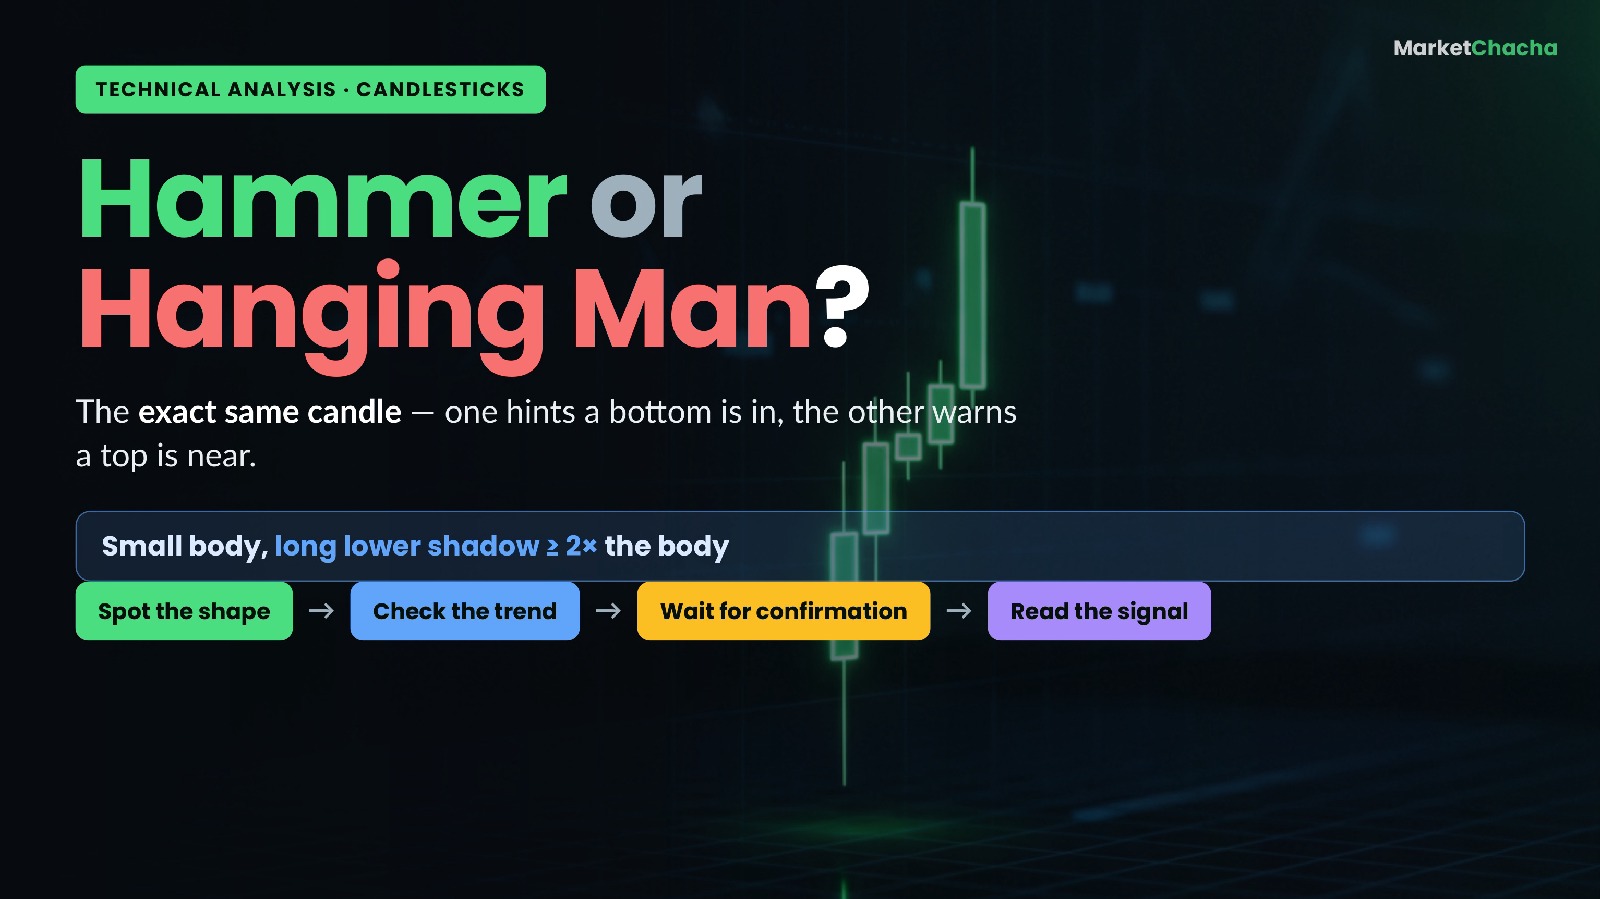
A hammer is a single candlestick with a small body sitting near the top of its range and a long lower shadow (wick) hanging beneath it — and when it appears at the bottom of a downtrend, it is one of the most-watched hints that sellers are losing control and a bottom may be forming. The twist that trips up almost every beginner: the exact same candle, shape for shape, is called a hanging man when it shows up at the top of an uptrend, and there it is a warning that a top may be near. Same picture, opposite message. This guide explains the anatomy of the candle, walks through the arithmetic that tells you whether a candle really qualifies, shows why location flips the meaning, and covers confirmation, volume, the look-alike patterns, and the mistakes that catch new traders.
What a hammer actually is: the anatomy of the candle
Every candlestick has three parts: the real body (the thick block between the open and close), the lower shadow (the thin line down to the session's low), and the upper shadow (the line up to the high). A hammer has a very specific set of proportions:
- A small real body near the top of the candle's range.
- A long lower shadow — the classic rule of thumb is that it should be at least twice the height of the real body, and often much more.
- Little or no upper shadow.
What that shape is really telling you is a story about one trading session. Price opened, sellers dragged it sharply lower during the day (that is the long lower wick), and then buyers stepped in with enough force to push it all the way back up to close near where it started. The long tail is the visual fingerprint of a failed sell-off. After a sustained decline, that failed sell-off is exactly what a would-be bottom looks like.
A worked example: measuring the shadow-to-body ratio
The "at least twice the body" rule sounds vague until you put numbers on it, so let's measure one candle. Suppose a stock has been sliding for two weeks. On the next session it (all figures illustrative):
- Opens at $50.20
- Sells off intraday to a low of $47.00
- Recovers and closes at $50.40
- With a high of $50.50
Now do the arithmetic. The real body is the distance between open and close: |$50.40 − $50.20| = $0.20. The lower shadow is the lower of the open/close minus the low: $50.20 − $47.00 = $3.20. The upper shadow is the high minus the higher of open/close: $50.50 − $50.40 = $0.10. So the lower shadow is $3.20 versus a body of $0.20 — a ratio of 16 to 1, far beyond the 2× minimum, with a tiny upper shadow. That is a textbook hammer. Running this measurement is the difference between spotting a real hammer and talking yourself into one that isn't there.
Hammer vs hanging man: why the same candle means opposite things
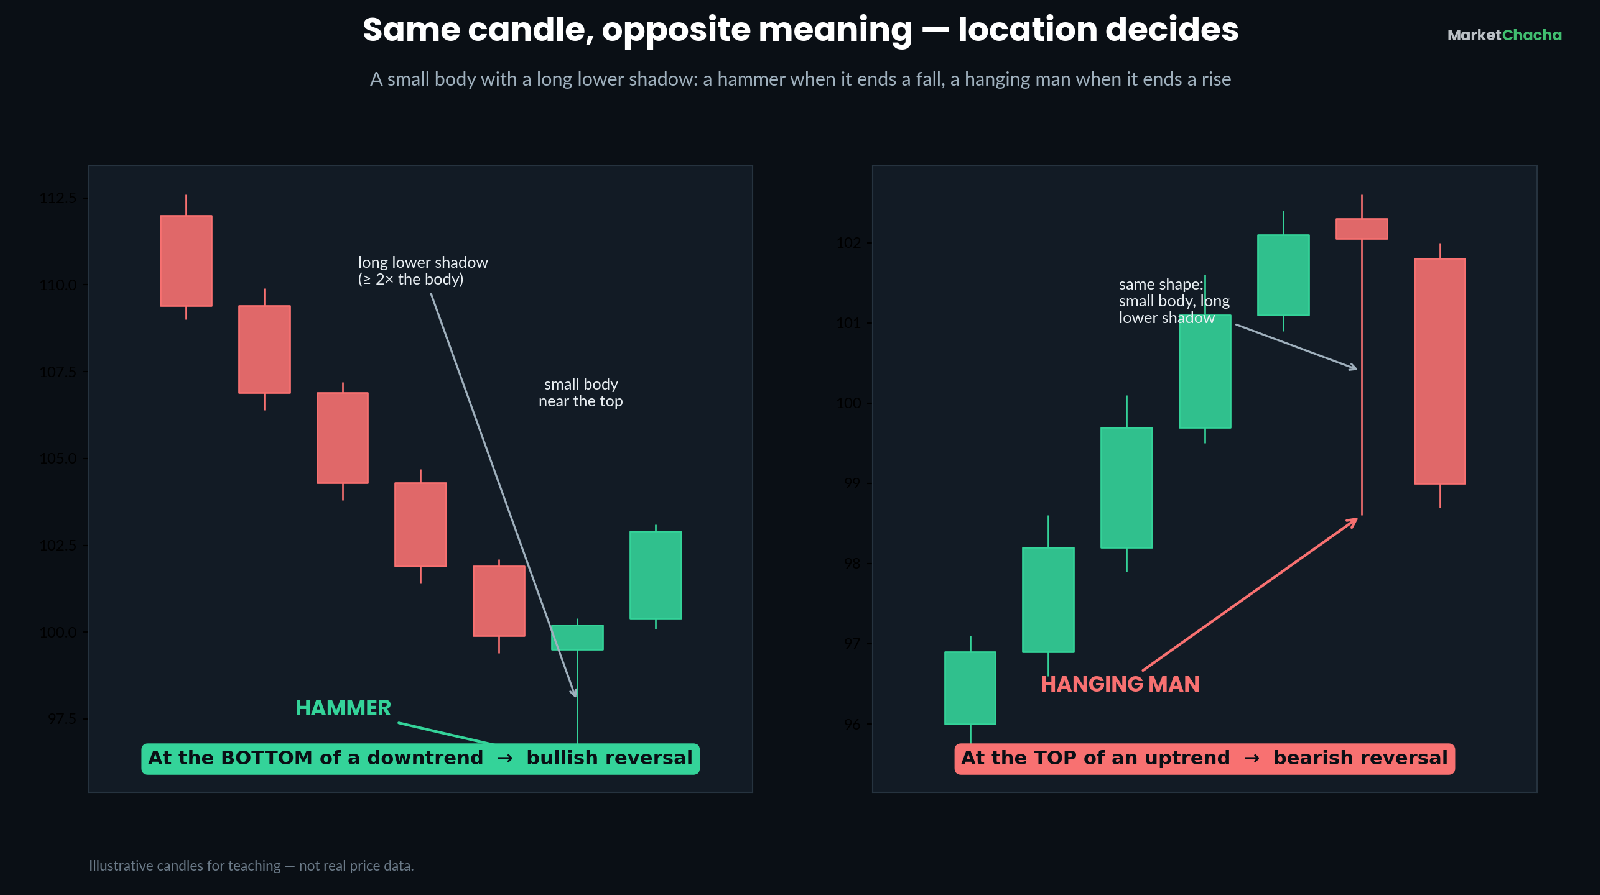
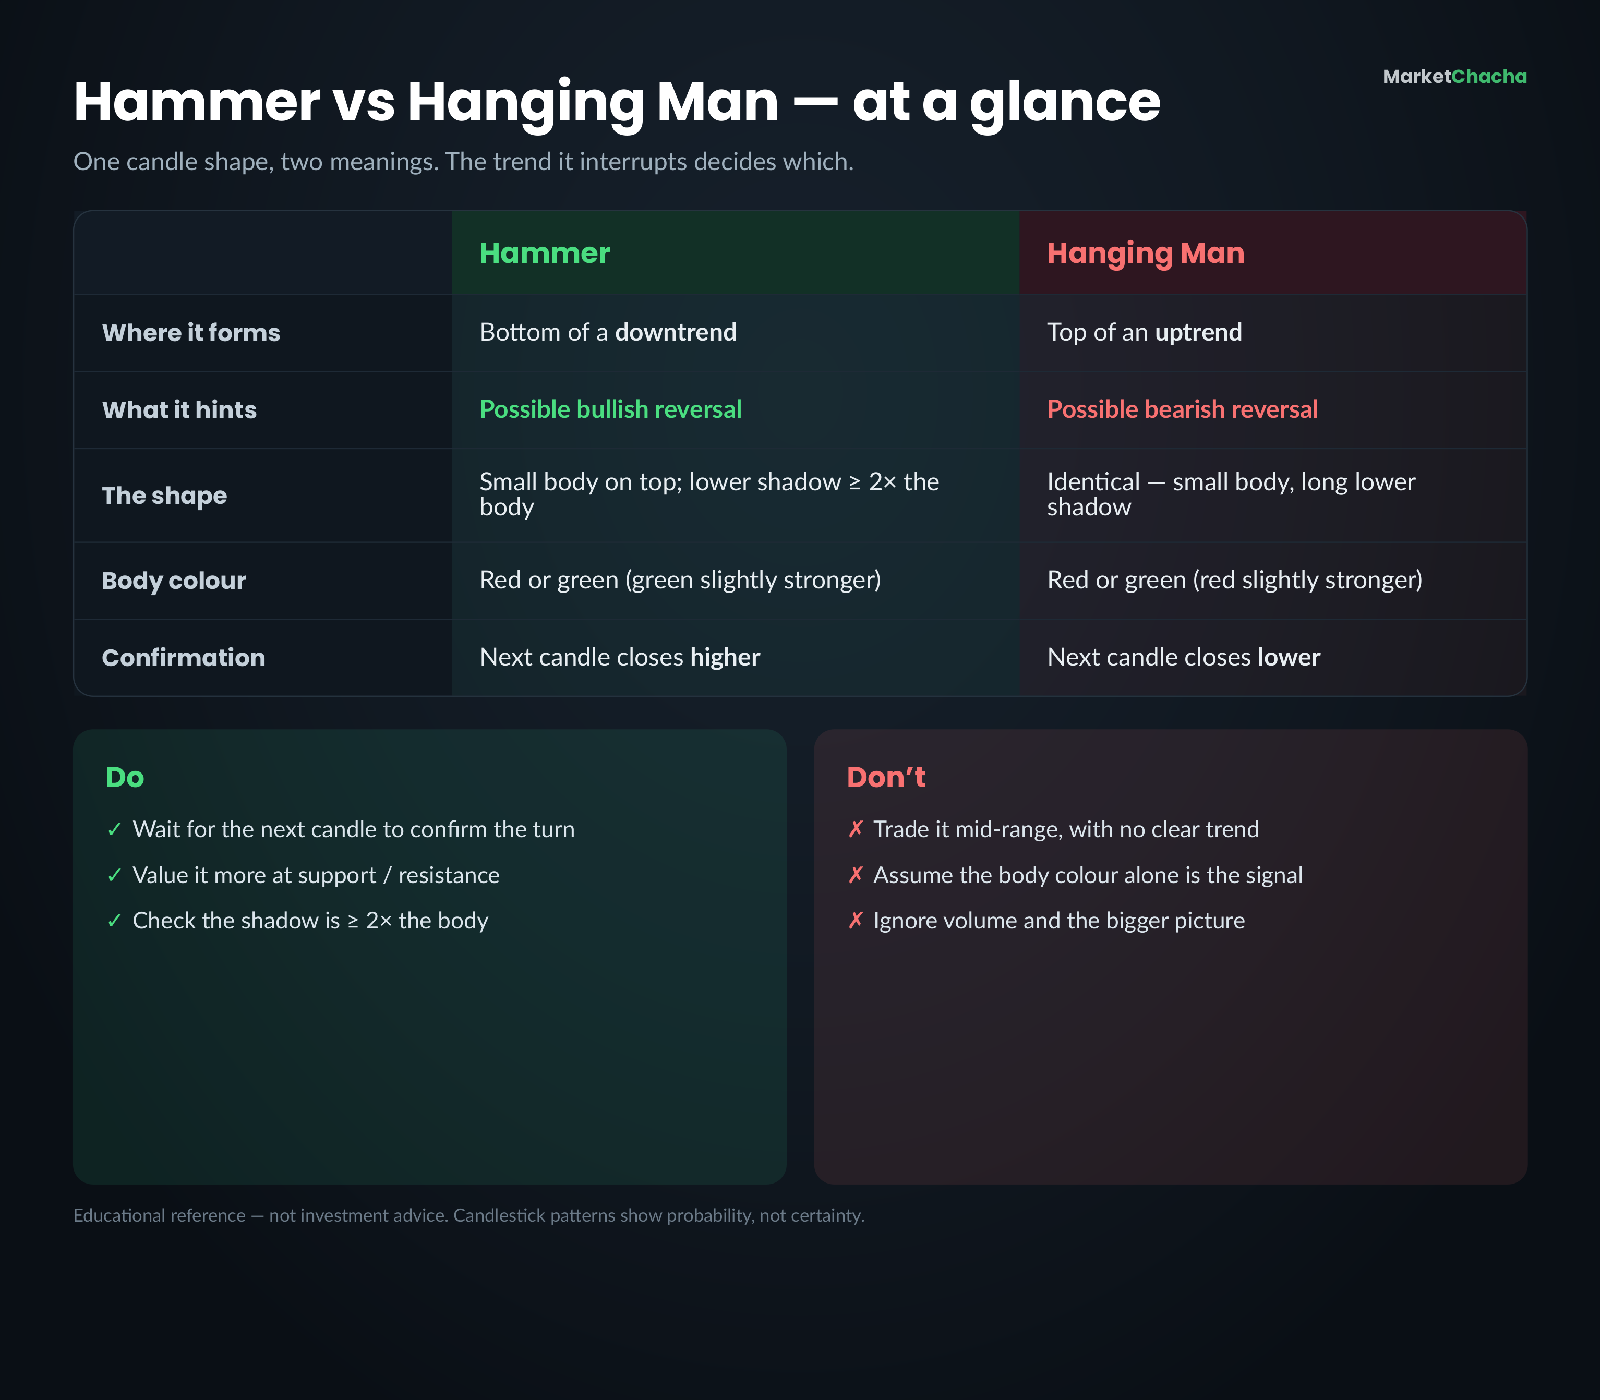
Here is the single most important idea in this whole topic: the hammer and the hanging man are the same candle. Identical proportions — small body, long lower shadow, little upper shadow. The only thing that separates them is where they appear.
- At the bottom of a downtrend, that candle is a hammer, and it hints at a bullish reversal (the fall may be ending).
- At the top of an uptrend, the identical candle is a hanging man, and it hints at a bearish reversal (the rally may be tiring).
Why would a bullish-looking recovery tail be a warning at a top? Because the long lower shadow shows that, even during a strong uptrend, sellers were suddenly able to push price sharply lower mid-session. The buyers rescued it by the close, but the fact that a deep intraday drop happened at all is the first crack in the rally's armour. Context turns the same footprint from "buyers are back" into "sellers just showed up." This is why professional chart readers always identify the prevailing trend before they name a single-candle pattern.
Why the next candle matters: confirmation
A hammer or hanging man is a hint, not a trigger. On its own it only tells you the balance of power wobbled for one session. Traders wait for confirmation from the following candle before they trust the reversal:
- For a hammer, confirmation is the next candle closing higher — ideally a strong green candle — showing buyers followed through.
- For a hanging man, confirmation is the next candle closing lower, showing sellers took over.
Without that follow-through, a hammer is just a candle with a long tail that may lead nowhere. Confirmation is the price you pay for a higher-probability read — you give up the very first tick of the move in exchange for evidence that the turn is real.
Colour, volume and location: what makes a hammer stronger
Not all hammers are created equal. A few factors make one more convincing than another:
- Body colour is secondary, not decisive. A hammer can be green (close above open) or red (close below open). A green hammer is slightly stronger for a bottom because buyers closed above the open, but the long lower shadow and the location matter far more than the colour of the body.
- Volume adds weight. A hammer forming on heavy volume suggests the reversal has real participation behind it — a lot of hands changed the shares near the low.
- Location at a known level is best. A hammer that forms right at a prior support level, a round number, or a moving average is more meaningful than one floating in the middle of nowhere, because two separate signals are lining up in the same place.
The inverted hammer and the shooting star: the upside-down cousins
Flip the candle vertically — small body near the bottom, long upper shadow, little lower shadow — and you get the mirror-image family. At the bottom of a downtrend that shape is an inverted hammer (a possible bullish reversal); at the top of an uptrend the identical shape is a shooting star (a possible bearish reversal). The logic is the same as before: one shape, and the trend it interrupts decides the name and the meaning. If you understand the hammer and hanging man, you already understand their upside-down cousins — just swap "long lower shadow" for "long upper shadow."
How to actually read a hammer, step by step
Chart readers turn the theory into a simple, repeatable checklist. This is process, not a buy or sell instruction:
- 1. Identify the trend first. Is price in a clear downtrend or uptrend? A single candle in a sideways range means little.
- 2. Check the shape. Small body near one end, a shadow on the other side at least twice the body, minimal shadow on the near side. Measure it if you are unsure, as in the worked example above.
- 3. Name it by location. Long lower shadow at a bottom → hammer. Same candle at a top → hanging man.
- 4. Wait for confirmation. Let the next candle close before you conclude the reversal is real.
- 5. Read it with context. Is it at support or resistance? On strong volume? Those raise the odds. It is one clue among several, never the whole picture.
Common mistakes beginners make
- Ignoring the trend. Calling any long-tailed candle a "hammer" regardless of where it sits. Without a prior downtrend there is nothing to reverse.
- Trusting the candle alone. Acting before the confirming candle closes. A hammer is a hint, and hints fail.
- Obsessing over body colour. Believing a red hammer is bearish and a green one bullish. The shadow and the location carry the message.
- Forcing a small tail to qualify. If the lower shadow is not clearly longer than the body (at least twice), it is not a hammer — it is a spinning top or just noise.
- Reading it on a tiny timeframe in isolation. A hammer on a daily or weekly chart at a major level carries more weight than one on a one-minute chart.
Does this work on Indian stocks and Nifty?
Yes — candlestick patterns are universal because they simply describe how open, high, low and close relate within one session, and every market plots them the same way. A hammer on a daily Nifty 50 or Bank Nifty chart, or on an individual NSE/BSE stock after a sustained fall, is read exactly as described here: small body, long lower shadow, at bottom of a downtrend, confirmed by the next session. Indian charting platforms and brokers show the same green/red candles, and Indian technical analysts use the identical hammer, hanging man, inverted hammer and shooting star vocabulary. The pattern does not change with the exchange or the currency — only the ticker and the price scale do.
FAQ
What is a hammer candlestick in simple terms? It is a single candle with a small body near the top and a long lower wick that is at least twice the body's height. Appearing after a downtrend, it suggests sellers pushed price down hard but buyers fought back by the close, hinting the fall may be ending.
What is the difference between a hammer and a hanging man? None in shape — they are identical candles. The difference is location: a hammer forms at the bottom of a downtrend and is potentially bullish, while a hanging man forms at the top of an uptrend and is potentially bearish.
Does the colour of a hammer matter? Only a little. A green (bullish) hammer is marginally stronger than a red one at a bottom, but the long lower shadow and the candle's location in the trend matter far more than the body colour.
Do I need to confirm a hammer before acting on it? Yes. A hammer is a hint, not a signal on its own. Most chart readers wait for the next candle to close higher (for a hammer) or lower (for a hanging man) as confirmation before trusting the reversal.
How long should the lower shadow be for a valid hammer? The common guideline is that the lower shadow should be at least two times the length of the real body, with little or no upper shadow. Many strong hammers have shadows several times the body.
What is the opposite of a hammer? Flipped upside down, the same idea gives the inverted hammer (long upper shadow at a bottom, potentially bullish) and the shooting star (long upper shadow at a top, potentially bearish).
Educational content only — not investment, tax or trading advice, and not a recommendation of any security or strategy. Candlestick patterns describe probabilities, not certainties, and can fail. Always do your own research. [Sources: Investopedia — Hammer & Hanging Man, Corporate Finance Institute, Zerodha Varsity]
This article is for educational and informational purposes only. It is not financial advice, investment recommendation, or a solicitation to buy or sell securities. Investing involves significant risks. I am not a SEBI-registered investment advisor. Readers should consult their own financial advisor and conduct their own research before making any investment decisions.
Comments
Join the conversation
Sign in to join the conversation.
Follow replies, add your view, and take part in the discussion.
Sign in to commentLoading comments...