

What is RSI (Relative Strength Index)? Overbought, oversold & divergence explained (Beginner's In-Depth Guide)
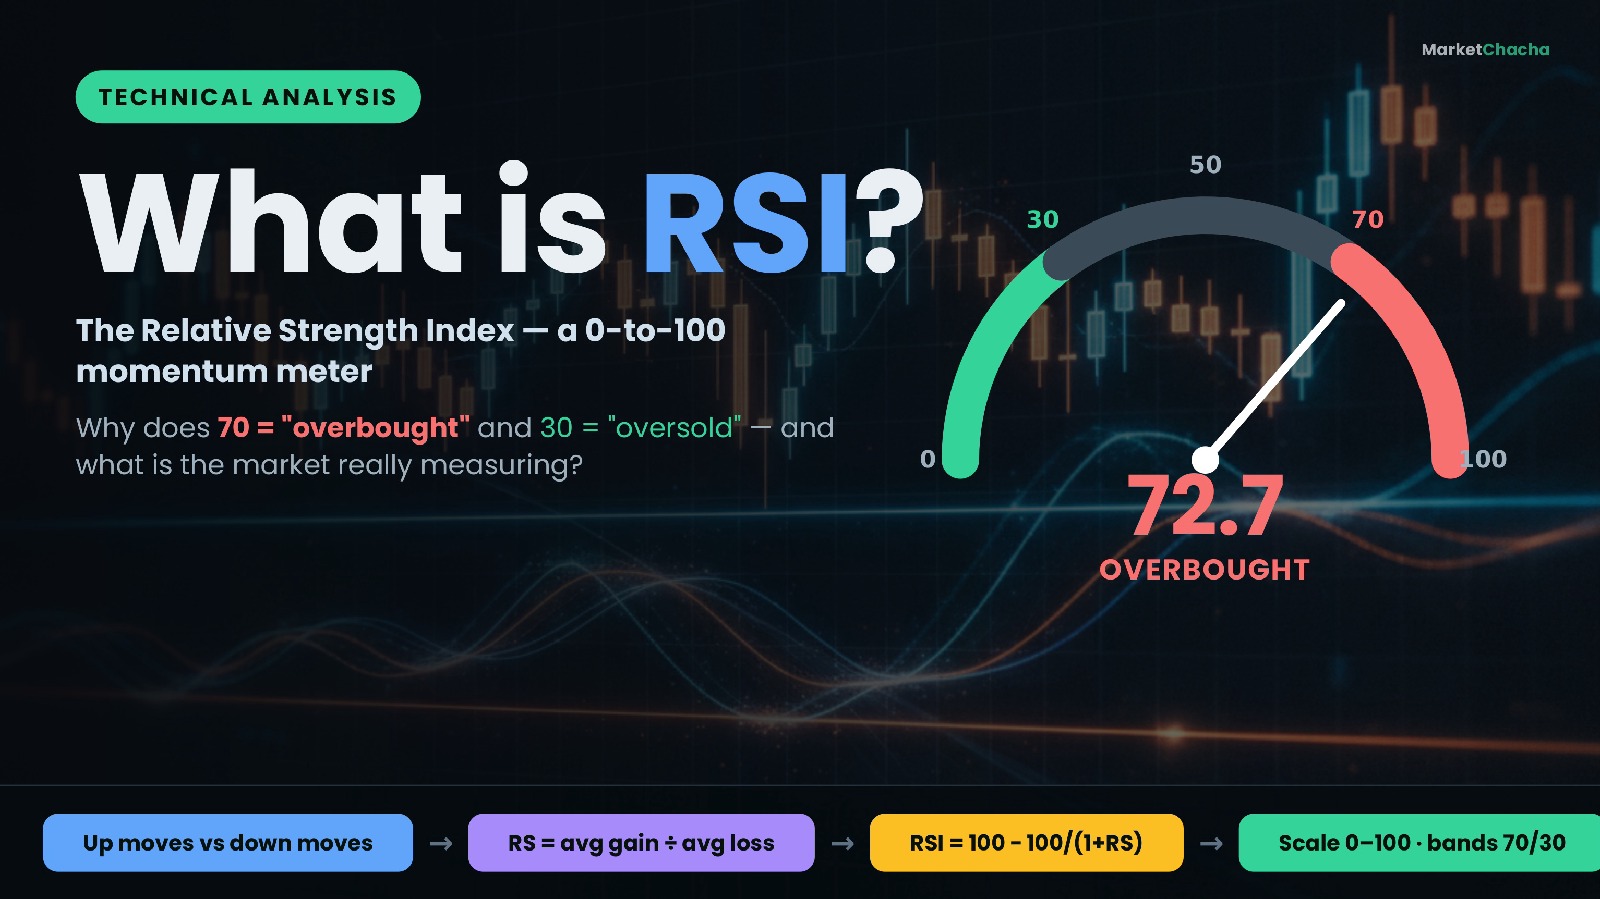
The Relative Strength Index (RSI) is a momentum indicator that measures how strong a stock's recent up-moves have been compared with its recent down-moves, and squeezes that comparison into a single number between 0 and 100. A reading above 70 is traditionally called "overbought" and a reading below 30 "oversold". RSI was created by engineer-turned-trader J. Welles Wilder Jr. and published in his 1978 book New Concepts in Technical Trading Systems. This guide explains what RSI is really measuring, the exact formula, a worked example you can follow by hand, what the 70/30 lines do and don't mean, divergence, and the mistakes beginners make.
The big idea: RSI measures momentum, not price
Price tells you where a stock is. Momentum tells you how forcefully it got there. RSI is a momentum tool: it ignores the absolute price and instead asks a simple question over a look-back window (14 periods by default) — "of all the movement in this stock lately, how much was upward versus downward?"
If almost every recent move was up, RSI climbs toward 100. If almost every move was down, it sinks toward 0. When gains and losses are roughly balanced, RSI hovers around the mid-line of 50. That is why RSI is called an oscillator: it swings back and forth inside a fixed 0–100 range instead of drifting off with the price. That fixed range is what makes it easy to compare a ₹200 stock with a $4,000 one — both are just scored from 0 to 100.
The RSI formula, explained
RSI is built in three steps. First, for each period you record the change from the previous close and split it into a gain (if the price rose) or a loss (if it fell). Losses are written as positive numbers, not negatives.
Second, you average those gains and losses over the look-back window to get the Average Gain and Average Loss. The ratio of the two is called Relative Strength (RS):
RS = Average Gain ÷ Average Loss
Third, you convert RS into a 0–100 score with Wilder's formula:
RSI = 100 − [ 100 ÷ (1 + RS) ]
One detail matters for accuracy. The first Average Gain and Average Loss are simple averages of the first 14 periods. Every reading after that uses Wilder's smoothing, which carries most of the old average forward and adds only a sliver of the newest period: Average Gain = [(previous Average Gain × 13) + current Gain] ÷ 14, and the same for losses. This smoothing is why RSI reacts gradually rather than jumping around, and it is why two charting tools can show slightly different RSI values if one uses a plain moving average instead of Wilder's method.
A worked example you can follow by hand
Imagine that over the last 14 trading days a stock's up-days added up to a total gain of $11.20 and its down-days added up to a total loss of $4.20. Here is the full calculation:
- First Average Gain = 11.20 ÷ 14 = $0.80
- First Average Loss = 4.20 ÷ 14 = $0.30
- RS = 0.80 ÷ 0.30 = 2.67
- RSI = 100 − [100 ÷ (1 + 2.67)] = 100 − (100 ÷ 3.67) = 100 − 27.3 = 72.7
An RSI of 72.7 is above 70, so this stock would be flagged "overbought". Now watch what Wilder's smoothing does on the next day. Say the stock rises again with a gain of $0.50 and no loss:
- New Average Gain = [(0.80 × 13) + 0.50] ÷ 14 = 10.90 ÷ 14 = $0.779
- New Average Loss = [(0.30 × 13) + 0] ÷ 14 = 3.90 ÷ 14 = $0.279
- RS = 0.779 ÷ 0.279 = 2.79, so RSI = 100 − (100 ÷ 3.79) = 73.6
The two extremes are worth remembering. If all 14 periods were up, the Average Loss would be 0, RS would be infinite, and RSI would read exactly 100. If all 14 were down, RSI would read 0. Real stocks almost never reach either edge, which is why RSI usually lives between roughly 20 and 80.
What "overbought" and "oversold" really mean
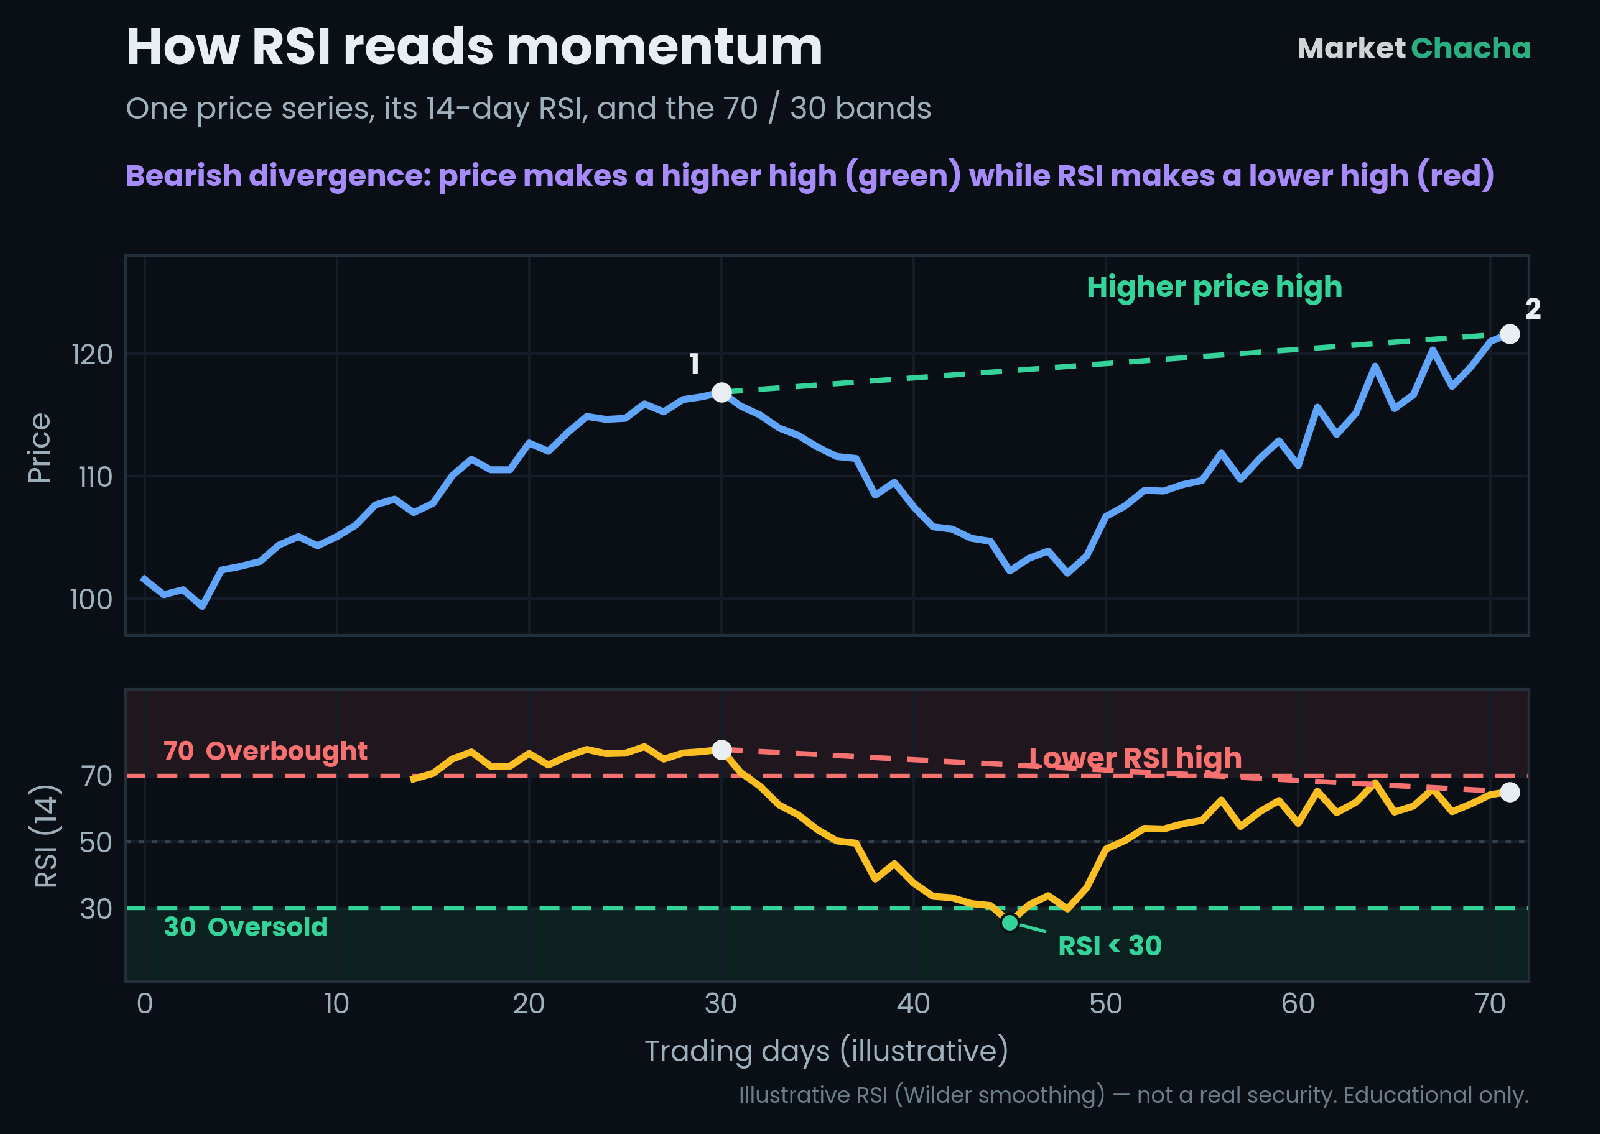
Wilder set the alert lines at 70 and 30. "Overbought" (above 70) simply means the recent buying has been unusually one-sided; "oversold" (below 30) means the selling has been. That is all the number says. It is a description of momentum that has become stretched — not an instruction to trade.
This is the single most important thing a beginner can learn about RSI: overbought does not mean "sell now", and oversold does not mean "buy now". A stretched rubber band often snaps back, which is why traders watch these zones. But a strong stock can stay overbought for a long time while it keeps climbing, and a collapsing stock can stay oversold all the way down. The 70/30 lines flag where to pay attention, not what to do.
Why RSI stays "overbought" in strong trends
Because RSI compares up-moves with down-moves, a powerful uptrend — where most days close green — will pin RSI above 70 for weeks. Traders who reflexively sell the first touch of 70 in a strong bull run get shaken out early and repeatedly. That is why many experienced traders shift the bands to 80/20 on strongly trending instruments, so the alert only fires at a genuine extreme. In a quiet, range-bound stock the standard 70/30 works better. The lesson: the "right" threshold depends on the character of what you are watching.
RSI divergence: when price and momentum disagree
The most respected RSI signal is divergence — when price and RSI point in opposite directions. In the chart above, price grinds to a higher high (point 2 is above point 1), but RSI makes a lower high. That is bearish divergence: the new price high was made with less momentum behind it, hinting the rally is tiring. The mirror image, bullish divergence, appears when price makes a lower low but RSI makes a higher low, hinting that selling is losing steam.
Divergence is considered a stronger clue than a raw 70 or 30 touch because it captures a change in momentum rather than just its level. Even so, it is a warning, not a trigger — trends can diverge for a long time before they actually turn, so divergence is best used alongside price structure like support, resistance and trendlines.
Why 14 periods — and when to change it
Wilder's default look-back is 14 periods, and it remains the standard on almost every charting platform. The "period" matches your chart's timeframe: 14 days on a daily chart, 14 weeks on a weekly, 14 hours on an hourly. A shorter setting (say 7) makes RSI faster and noisier — it hits 70 and 30 more often, giving more signals but more false ones. A longer setting (say 21 or 28) makes it slower and smoother, with fewer but steadier readings. There is no magic number; 14 is simply a well-tested middle ground, and it is wise to keep one consistent setting rather than tweaking it to fit a chart after the fact.
How to actually use RSI on a chart
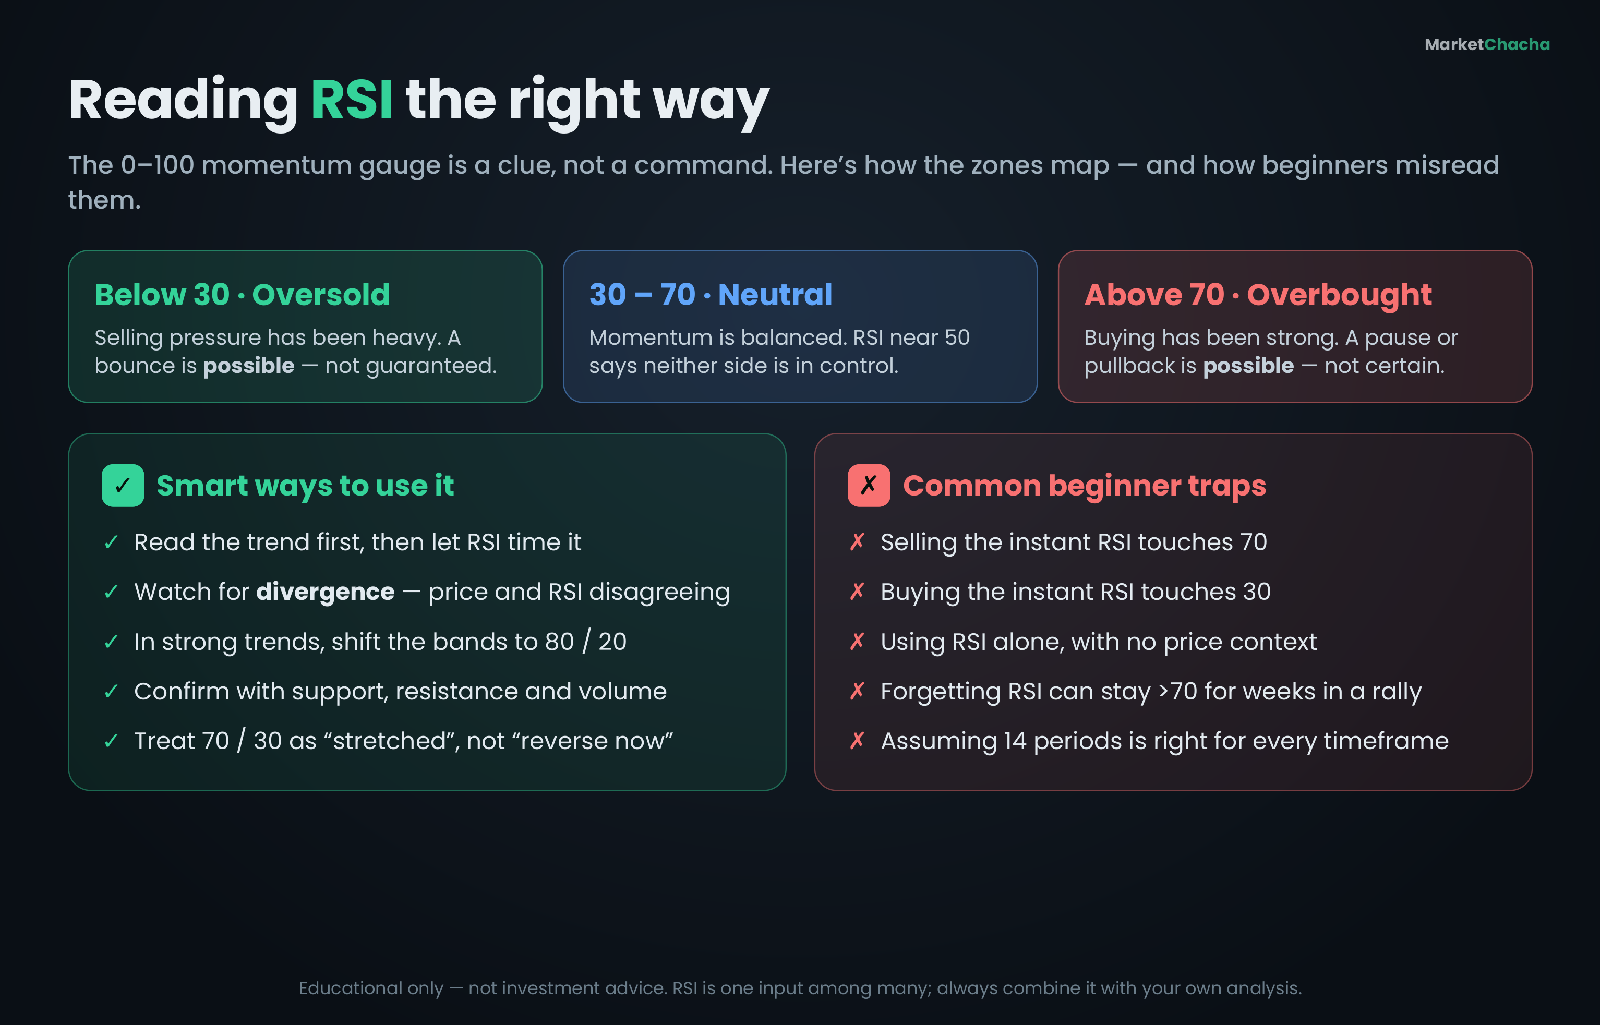
A sensible beginner workflow looks like this:
- Step 1 — Read the trend first. Is the stock broadly rising, falling, or ranging? RSI is a timing aid within a trend, not a substitute for knowing the trend.
- Step 2 — Note the RSI level. Above 70 or below 30 tells you momentum is stretched and worth watching — nothing more.
- Step 3 — Look for divergence. Does RSI confirm each new price high/low, or is it quietly weakening? Disagreement is the higher-quality clue.
- Step 4 — Confirm with price. Wait for the price itself to act — a break of a trendline, support or resistance — rather than acting on the indicator alone.
- Step 5 — Manage risk. No single indicator is right often enough to skip a stop-loss and position sizing.
Common mistakes beginners make
- Selling at the first touch of 70 (or buying at 30). In a real trend these levels can hold for weeks. Treat them as "stretched", not "reverse".
- Using RSI in isolation. RSI with no view of the trend, support or volume is a coin-flip. It is a confirmation tool, not a standalone system.
- Confusing RSI with "relative strength". RSI compares a stock to its own past. Comparing one stock's performance against another stock or an index is a different tool (comparative relative strength).
- Assuming every platform computes RSI identically. Wilder's smoothing is standard, but some tools use a plain average; small differences are normal.
- Forcing signals in a flat market. When a stock chops sideways, RSI whipsaws across 50 and produces lots of noise. Fewer, cleaner setups beat many forced ones.
RSI on the Nifty, Sensex and Indian stocks
RSI is universal — the maths is identical whether you plot it on the Nifty 50, the Sensex, a US mega-cap or a small-cap. Every mainstream Indian charting tool (the ones built into broker platforms and sites like NSE/BSE data feeds) offers a 14-period RSI by default. Because Indian indices and large-caps can trend strongly for long stretches, the same caution applies: a Nifty RSI parked above 70 during a bull phase is describing strength, not signalling a top. Indian traders use RSI exactly as above — as one confirmation input, read alongside trend, price action and risk management, never as a buy/sell button.
FAQ
What does RSI mean in simple terms? RSI (Relative Strength Index) is a score from 0 to 100 that measures whether a stock's recent moves have been mostly up or mostly down. High numbers mean buyers have been dominant lately; low numbers mean sellers have.
Is an RSI above 70 a sell signal? Not by itself. Above 70 means momentum is "overbought" or stretched, which is worth watching, but strong stocks can stay above 70 for weeks. It is a heads-up, not an instruction to sell.
What is a good RSI number to buy at? There is no universally "good" number, and RSI is not a buy button. Some traders watch for readings below 30 (oversold) as a place to look for a bounce, but only after checking the trend and waiting for the price itself to confirm.
What is the best RSI setting? The default 14 periods is the tested standard and a fine starting point. Shorter settings (like 7) react faster but give more false signals; longer settings (like 21) are smoother but slower. Consistency matters more than the exact number.
What is RSI divergence? Divergence is when price and RSI disagree — for example, price makes a higher high while RSI makes a lower high (bearish divergence). It suggests the move is losing momentum and is considered a stronger clue than a simple 70 or 30 touch.
Does RSI work on any timeframe or market? Yes. The same 0–100 formula applies to any timeframe (hourly, daily, weekly) and any market — Indian stocks, US stocks, indices, commodities or crypto — because it only compares an asset's up-moves with its own down-moves.
Educational content only — not investment advice, and not a recommendation of any security or strategy. Technical indicators can and do give false signals; always do your own research and manage risk. [Sources: StockCharts ChartSchool — RSI, Investopedia — Relative Strength Index, J. Welles Wilder Jr., New Concepts in Technical Trading Systems (1978)].
This article is for educational and informational purposes only. It is not financial advice, investment recommendation, or a solicitation to buy or sell securities. Investing involves significant risks. I am not a SEBI-registered investment advisor. Readers should consult their own financial advisor and conduct their own research before making any investment decisions.
Comments
Join the conversation
Sign in to join the conversation.
Follow replies, add your view, and take part in the discussion.
Sign in to commentLoading comments...