

Flag and Pennant Patterns Explained: The Flagpole, the Breakout & the Measured-Move Target (Beginner's In-Depth Guide)
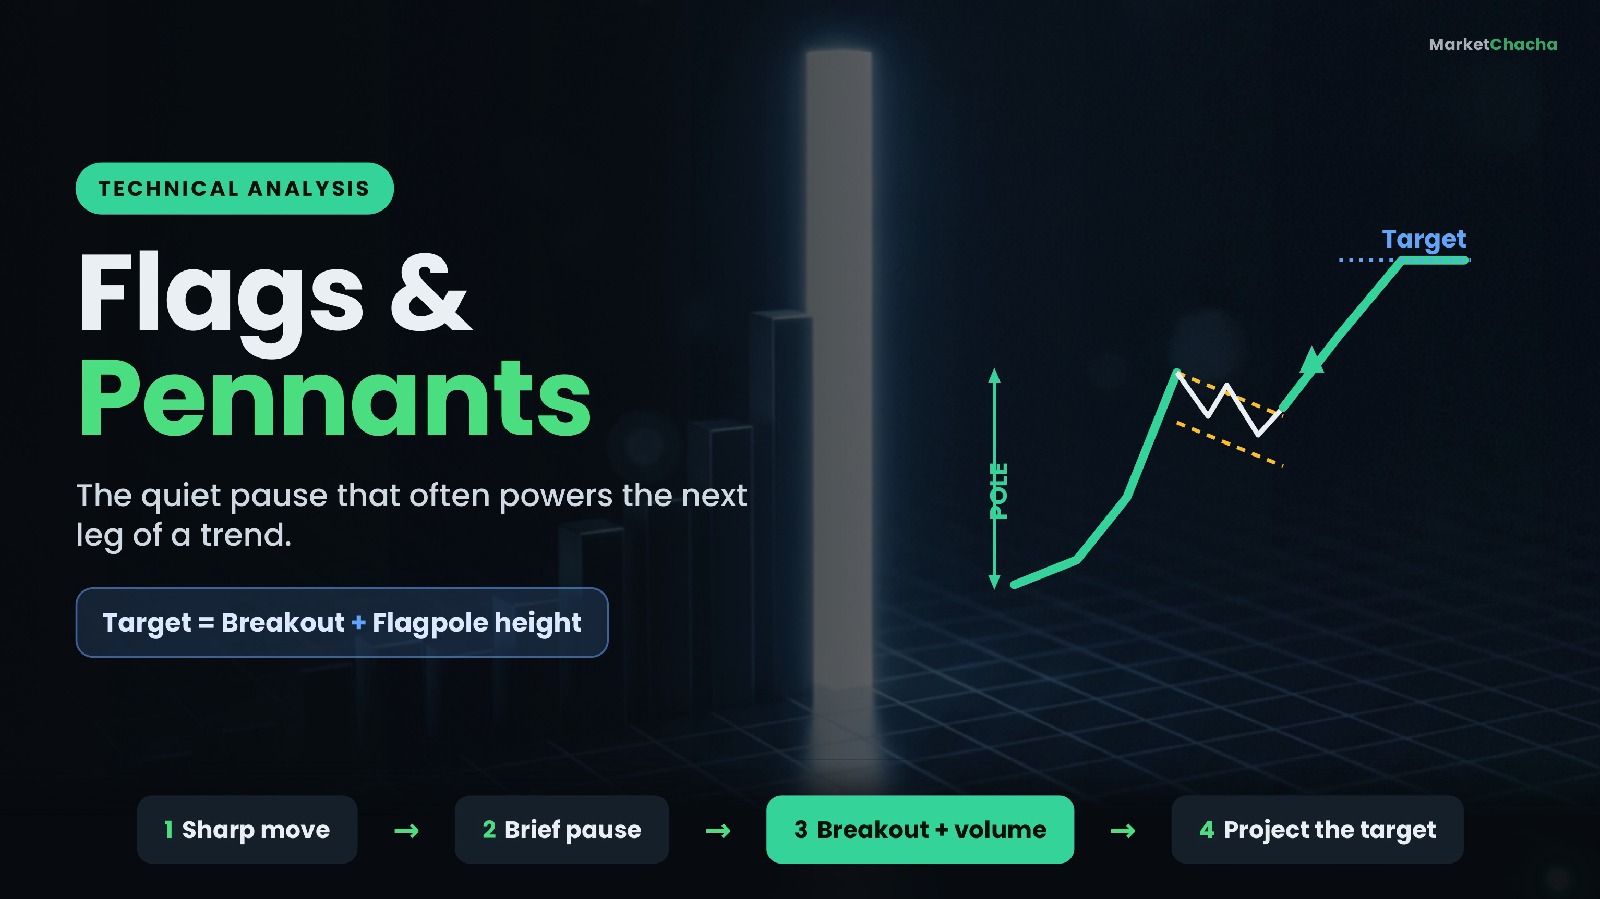
A flag and a pennant are short-term "continuation" chart patterns: after a stock makes a sharp move in one direction, it pauses and drifts sideways for a few days to about three weeks, and then — more often than not — it breaks out and continues in the same direction as that first sharp move. Think of it as the market catching its breath before the next leg. The sharp move is the flagpole; the tidy little consolidation that follows is the flag (a small tilted rectangle) or the pennant (a small triangle). This guide explains exactly what forms these patterns, how to tell a flag from a pennant, how traders estimate a price target from the flagpole, why volume is the honest signal, and the common mistakes that turn a promising setup into a losing one.
What is a flag or pennant pattern?
Both patterns have the same DNA and always come in two parts. First comes the flagpole — a strong, almost vertical price move driven by real buying (or selling) pressure, usually on heavy volume. Something caused it: an earnings surprise, a news catalyst, a breakout from a bigger base. Second comes the consolidation — a brief, orderly pause where price trades in a narrow range while the market digests that move. Buyers who missed the run wait for a dip; early buyers take some profit. This tug-of-war produces the small flag or pennant shape.
Because the underlying trend is still intact, these are continuation patterns: the expectation is that the pause resolves in the direction of the flagpole. They are also short-term by nature. A classic flag or pennant lasts from a few days up to roughly three weeks. If a "flag" drags on for two or three months, it has stopped being a flag — the momentum that powered the pole has faded, and you are really looking at a longer trading range.
Flag vs pennant: what's the difference?
The only real difference is the shape of the pause:
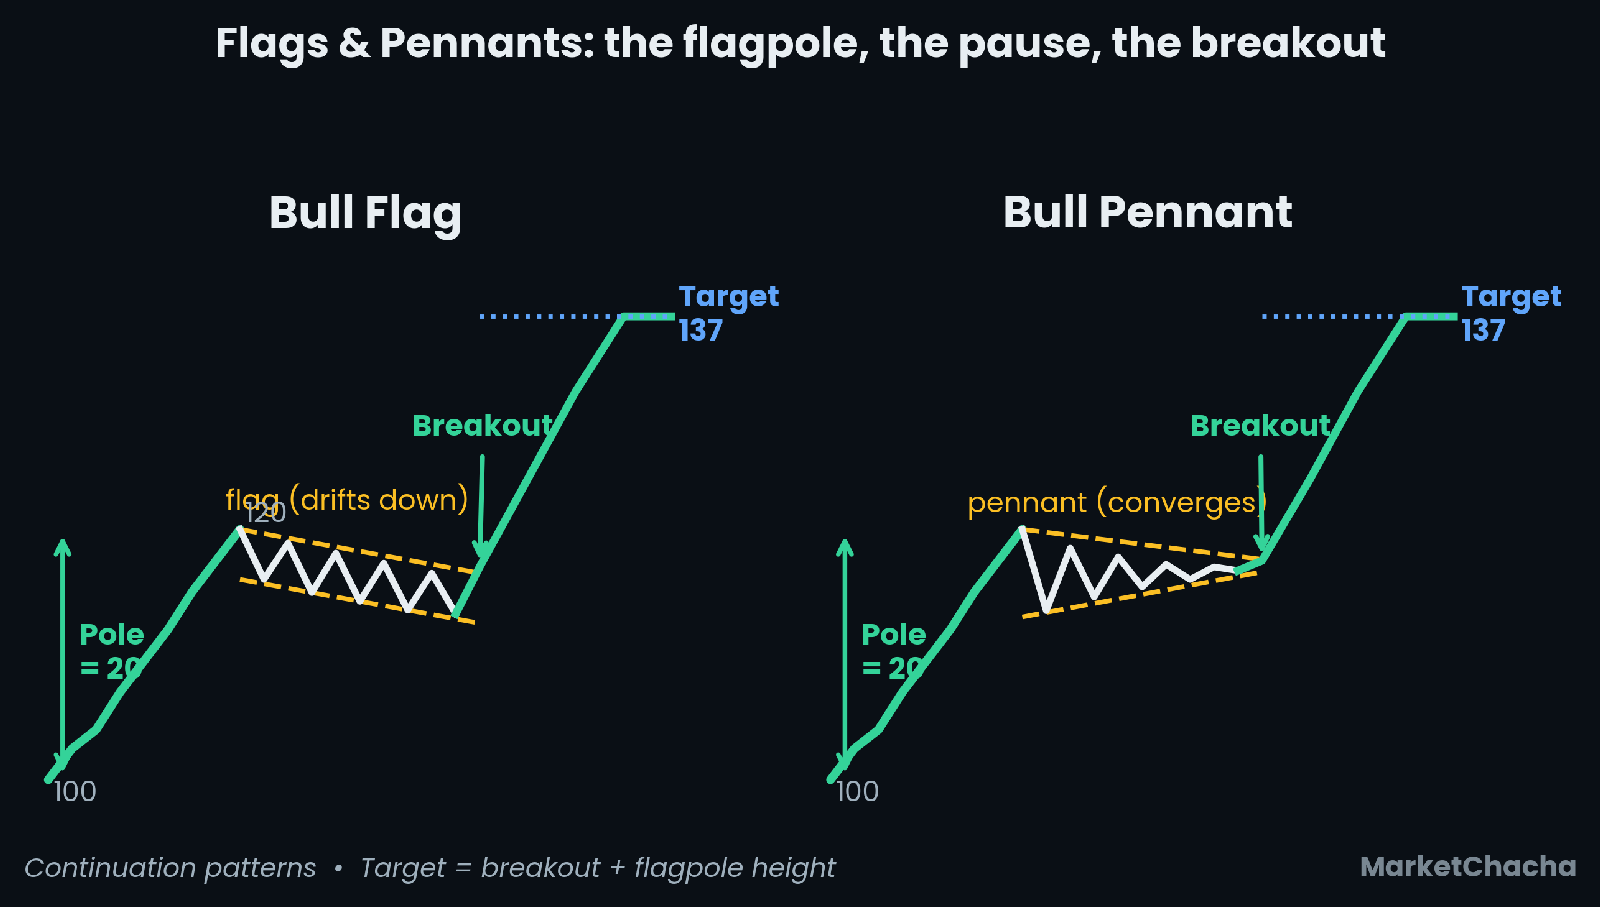
- A flag consolidates inside a small parallel channel that is tilted against the prior trend. After a sharp rally, the flag drifts gently downward; the top and bottom boundaries are roughly parallel, like a small rectangle leaning the other way.
- A pennant consolidates inside a small symmetrical triangle. Instead of parallel lines, the highs step lower and the lows step higher, so the range converges to a point as buyers and sellers reach a brief standoff.
That is the whole distinction. In practice they behave almost identically, are measured the same way, and many traders lump them together. The diagram below shows both after the same bullish flagpole — a flag that drifts down in a channel, and a pennant that squeezes into a triangle — each breaking out and running toward the same measured target.
Bull flag vs bear flag: it's all in the slope
The direction of the flagpole tells you whether it is bullish or bearish, and the consolidation always leans the opposite way:
- A bull flag forms after a sharp rally. The consolidation drifts slightly down (or sideways), and a break above the flag signals the uptrend resuming.
- A bear flag forms after a sharp drop. The consolidation drifts slightly up, and a break below the flag signals the downtrend resuming.
Why does the flag slope against the trend? Because that gentle counter-drift is just mild profit-taking, not a real reversal. A bull flag that instead slopes sharply upward is a warning sign — a steep, excited rise during the "pause" often means the move is getting exhausted rather than resting. The healthiest flags are calm and shallow.
A worked example: measuring the target
The most useful thing a flag or pennant gives you is a measured price target. The rule: take the height of the flagpole and add it to the breakout point. Here is the arithmetic, using round numbers:
- A stock rallies from ₹100 to ₹120. The flagpole height is ₹120 − ₹100 = ₹20.
- It then consolidates in a small down-sloping flag, with the flag's low near ₹113.
- Price breaks out above the upper flag line at about ₹117.
- Measured target = breakout ₹117 + flagpole ₹20 = ₹137.
Now put risk next to reward. A trader using this pattern would typically place a stop-loss just below the flag's low — say ₹112. That means the risk is ₹117 − ₹112 = ₹5, while the potential reward to the target is ₹137 − ₹117 = ₹20 — a reward-to-risk ratio of about 4:1. Favourable ratios like this are a big part of why traders like the pattern: the invalidation level (the flag low) sits close by, so a wrong idea is cheap to exit.
One nuance: there are two accepted ways to project the target. The version above adds the pole to the breakout point (the standard, slightly more optimistic method). A more conservative version adds the pole height to the low of the flag instead (₹113 + ₹20 = ₹133). Neither is "correct" — they are estimates, and a target is a reference level, not a guarantee that price will arrive.
Why volume is the real tell
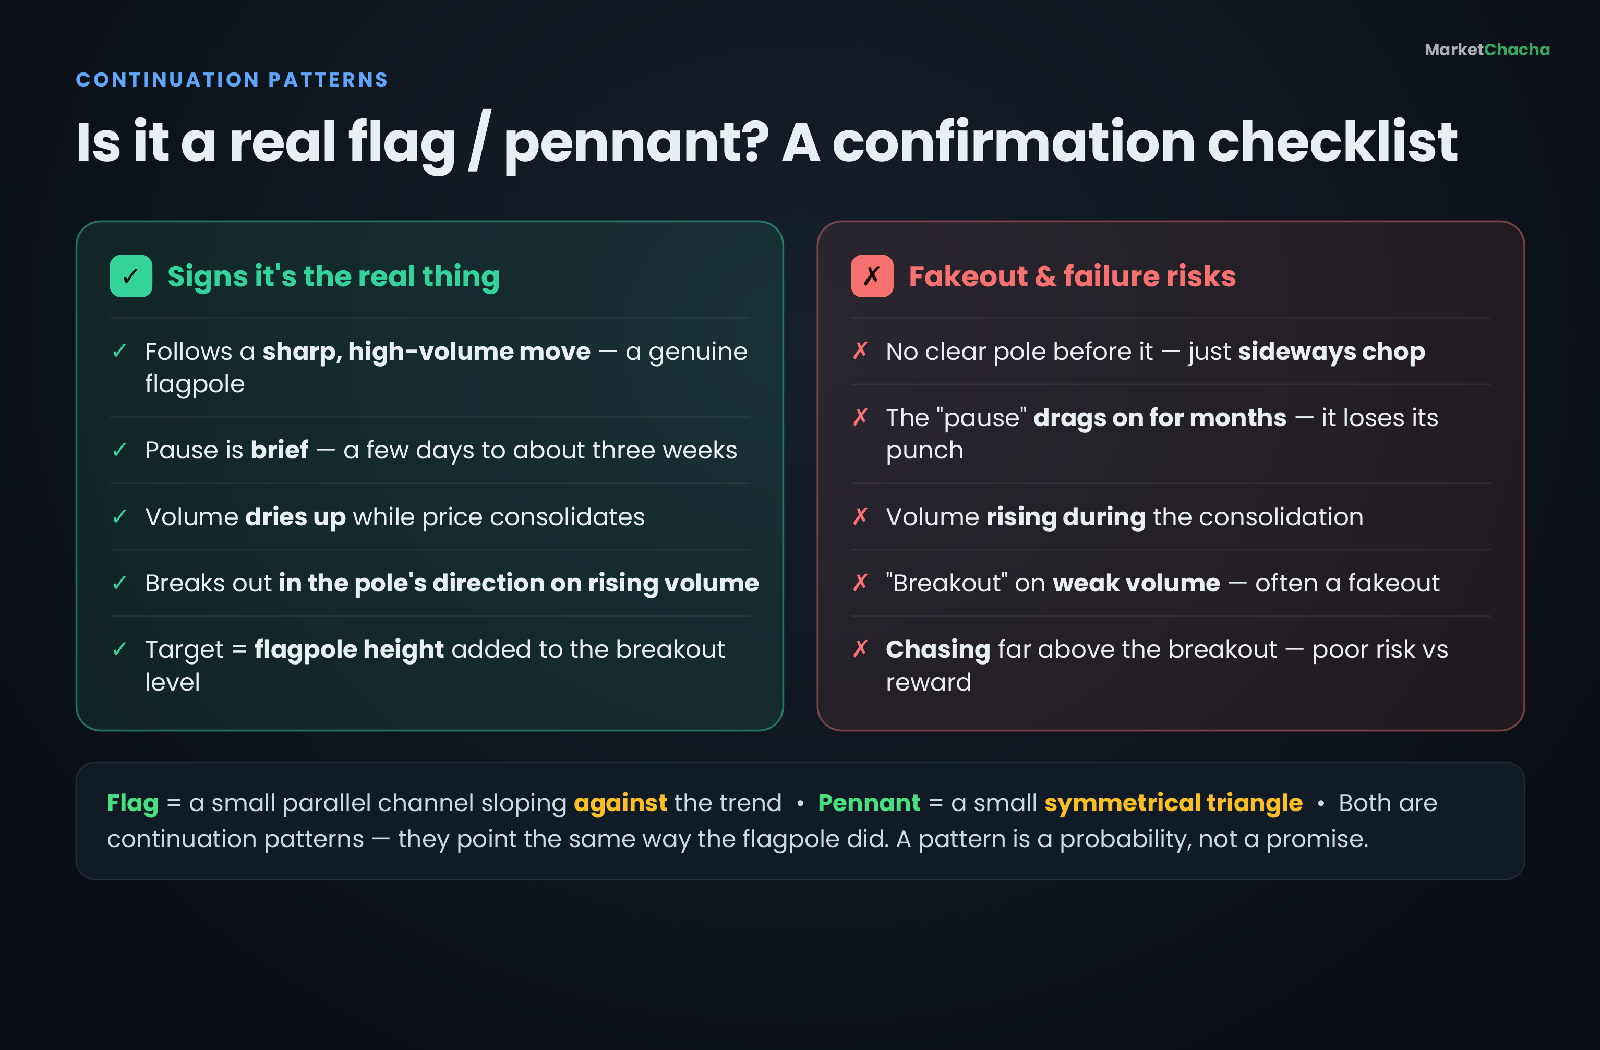
Price makes the shape, but volume is what separates a real flag from a random wiggle. The textbook volume signature has three stages: heavy volume on the flagpole (conviction driving the initial move), volume drying up during the consolidation (the pause is orderly, sellers are not aggressive), and volume expanding again on the breakout (demand returns and pushes price out of the range).
That fade-then-surge pattern is the confirmation most disciplined traders wait for. A breakout on weak volume is suspect — it is far more likely to be a "fakeout" that reverses back into the range. If volume is actually rising while price consolidates, be careful: that can mean sellers are quietly distributing, and the pattern may fail.
How to actually read and use the pattern
Putting it together, here is the sequence experienced traders look for — described so you can recognise it, not as a recommendation to trade any particular stock:
- Find the flagpole. Look for a sharp, high-volume move. No clear pole, no flag — sideways chop that just looks like a flag is the most common trap.
- Wait for the consolidation. A brief, orderly pause tilting against the trend (flag) or squeezing to a point (pennant), with volume fading.
- Wait for the breakout. A close beyond the pattern boundary in the pole's direction, ideally on rising volume. Many traders wait for the close rather than reacting to an intraday poke through the line.
- Project the target. Add the flagpole height to the breakout to get a reference target, and define an invalidation level (typically just past the far side of the flag) before entering.
The reference card below sums up what confirms a genuine setup versus the red flags that warn of a fakeout.
Flags and pennants vs wedges and triangles
Beginners often mix these up because they are all "sideways" shapes. The differences that matter:
- Flags/pennants are short and follow a pole. They are brief (days to weeks), small relative to the pole, and only appear after a sharp directional move. Wedges and large triangles can form over many weeks or months and do not need a preceding pole.
- A pennant is a small symmetrical triangle that appears right after a pole. A stand-alone symmetrical triangle without that sharp lead-in is just a triangle, and it can break either way.
- Wedges slope; flags slope the other way for a reason. A rising wedge (both lines tilting up) is generally read as bearish, even in an uptrend — the opposite intuition to a bull flag's mild downward drift. That is exactly why the flag's counter-trend slope matters: a bull "flag" that slopes steeply up starts to look like a bearish rising wedge instead.
Common mistakes beginners make
- Seeing a flag with no flagpole. If there was no sharp move first, a small range is not a flag — it is just noise. The pole is non-negotiable.
- Jumping in before the breakout. Entering inside the consolidation, hoping it breaks the right way, throws away the pattern's main benefit: waiting for confirmation.
- Ignoring volume. Acting on a low-volume breakout is the single most common way these setups disappoint.
- Treating the target as certain. The measured move is a probability-based estimate. Plenty of flags fail, and the flag's low (or high, for a bear flag) is there precisely to tell you when the idea is wrong.
- Letting the pattern get too old. A tidy pause becomes a stale range after a few weeks. The longer the consolidation, the weaker the original momentum.
How this shows up in Indian markets
Flags and pennants are pure price-action patterns, so they look the same on an NSE or BSE chart as anywhere else — the psychology of a sharp move followed by a pause is universal. Indian traders commonly spot them on liquid large-cap stocks and on the Nifty and Bank Nifty after a strong news-driven session or a post-results gap. Two practical notes for the Indian context: liquidity matters — volume confirmation is far more reliable on heavily traded names than on thin small-caps where a few trades can distort both the shape and the volume signal; and settlement is T+1, so a delivery-based position on a flag breakout is funded the next trading day. As always, the pattern describes probability, not certainty, and works best as one input alongside the broader trend and your own risk rules.
FAQ
What is the difference between a flag and a pennant? The pause is shaped differently. A flag consolidates in a small parallel channel that tilts against the trend; a pennant consolidates in a small symmetrical triangle that converges to a point. They form the same way and are measured the same way.
Are flags and pennants bullish or bearish? Either — they continue whatever trend preceded them. A bull flag follows a sharp rally and tends to break upward; a bear flag follows a sharp drop and tends to break downward.
How do you calculate the price target of a flag pattern? Measure the flagpole (the sharp move) and add that height to the breakout point. If the pole is ₹20 and price breaks out at ₹117, the measured target is about ₹137. A conservative variant adds the pole to the low of the flag instead.
How long should a flag or pennant last? Typically a few days to about three weeks. If the consolidation stretches on much longer, it is losing the momentum that defines the pattern and is better treated as a broader range.
Why is volume important for these patterns? The classic signature is heavy volume on the flagpole, fading volume during the pause, and expanding volume on the breakout. A breakout on weak volume is more likely to fail, so volume acts as the confirmation.
Do flag and pennant patterns always work? No. They are continuation patterns that improve the odds, not guarantees. Breakouts can fail ("fakeouts"), which is why traders define an exit level — usually just beyond the far side of the flag — before entering.
Educational content only — not investment advice, and not a recommendation of any security or strategy. Chart patterns describe probabilities, not certainties, and can fail. Always do your own research and manage your own risk. [Sources: StockCharts ChartSchool — Flag, Pennant, Britannica Money].
This article is for educational and informational purposes only. It is not financial advice, investment recommendation, or a solicitation to buy or sell securities. Investing involves significant risks. I am not a SEBI-registered investment advisor. Readers should consult their own financial advisor and conduct their own research before making any investment decisions.
Comments
Join the conversation
Sign in to join the conversation.
Follow replies, add your view, and take part in the discussion.
Sign in to commentLoading comments...