

Moving Averages Explained: SMA vs EMA, the Golden Cross & the Death Cross (Beginner's In-Depth Guide)
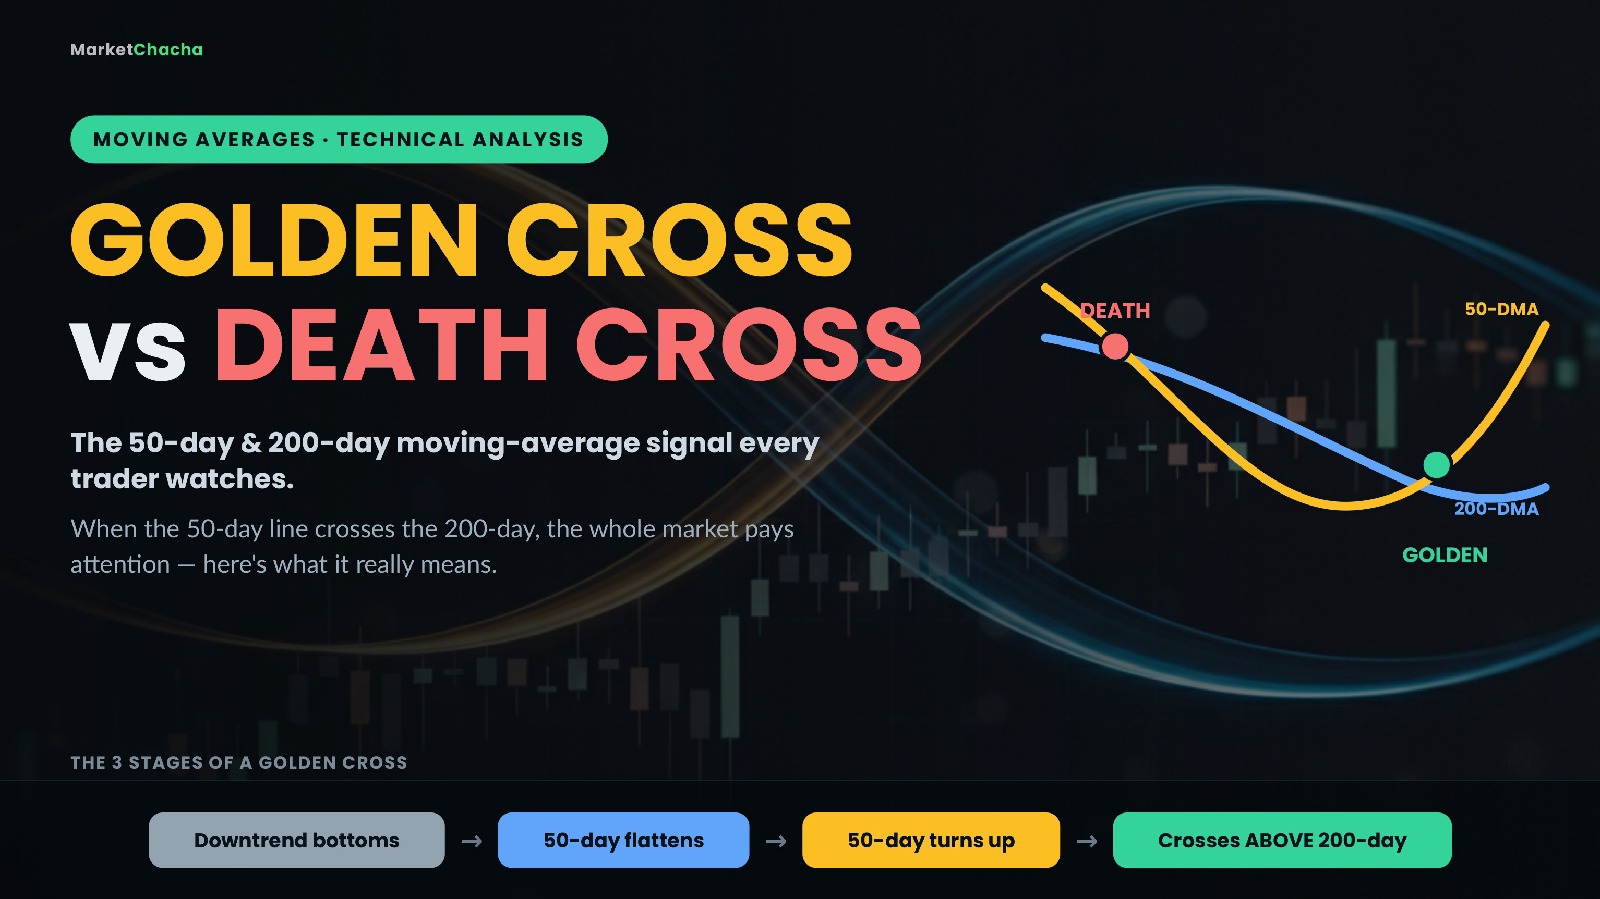
A moving average is simply the average price of a stock or index over a set number of recent days, recalculated every day so it "moves" forward with the market. It smooths out the daily zig-zag of prices so you can see the underlying trend. When a shorter average crosses a longer one, traders get two of the most famous signals in charting: the golden cross (a shorter average rising above a longer one — widely read as bullish) and the death cross (the shorter average falling below — widely read as bearish).
This guide explains what a moving average is, how it is calculated (with the actual arithmetic), the difference between the two main types (SMA and EMA), what the golden and death crosses really mean, and — just as important — where these signals mislead you.
What is a moving average, in plain English?
Prices bounce around every day on noise: a stray headline, a big order, a quiet session. That noise makes it hard to tell whether a stock is actually trending up, trending down, or just drifting sideways. A moving average filters the noise by averaging the last N closing prices into a single smooth line laid over the chart.
The word "moving" matters. Each new trading day, the newest close is added to the calculation and the oldest one is dropped, so the window of days keeps sliding forward. The result is a line that lags a little behind price but shows the trend far more clearly than the raw candles. If the line slopes up, the average price is rising; if it slopes down, it is falling; if it is flat, the market is going nowhere.
How a simple moving average (SMA) is calculated — a worked example
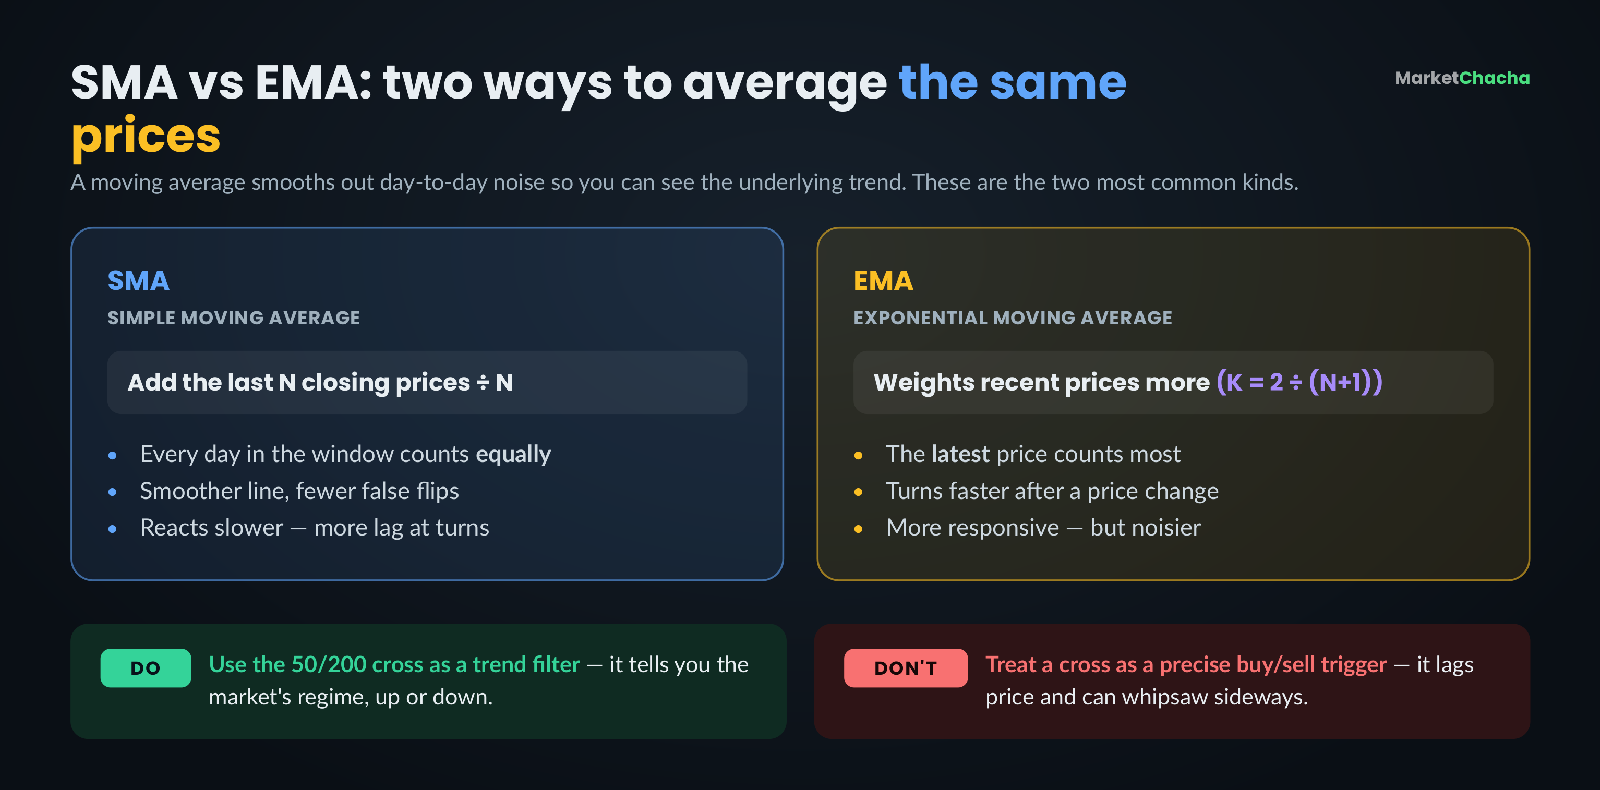
The simple moving average (SMA) is the most basic version: add up the last N closing prices and divide by N. Nothing fancy — it is a plain average.
Say we want a 5-day SMA and the last five closes were 100, 102, 101, 105 and 102.
- Add them: 100 + 102 + 101 + 105 + 102 = 510
- Divide by 5: 510 ÷ 5 = 102.0 — that is today's 5-day SMA.
Tomorrow a new close of 108 arrives. We drop the oldest price (100) and add the newest (108), so the window is now 102, 101, 105, 102, 108.
- Add them: 102 + 101 + 105 + 102 + 108 = 518
- Divide by 5: 518 ÷ 5 = 103.6
The average has "moved" from 102.0 to 103.6. That is the whole mechanic — a rolling window that steps forward one day at a time. A 50-day SMA does exactly the same thing with 50 closes; a 200-day SMA with 200 closes.
SMA vs EMA: what is the difference?
The SMA has one quirk: it gives every day in the window equal weight. A price from 50 days ago counts just as much as yesterday's. Many traders want the average to react faster to fresh information, so they use the exponential moving average (EMA), which puts more weight on recent prices.
The EMA uses a smoothing factor, K = 2 ÷ (N + 1). For a 10-day EMA, K = 2 ÷ 11 ≈ 0.18. Today's EMA is then roughly 18% of today's close plus 82% of yesterday's EMA. Because the newest price carries the biggest single weight, the EMA turns sooner than the SMA after a real change in direction. The trade-off: reacting faster also means reacting to noise, so an EMA gives more false signals in a choppy market. Neither is "better" — the SMA is smoother and steadier, the EMA is quicker and twitchier.
What the golden cross and death cross actually mean
Crossovers are where moving averages get their reputation. The idea is to plot two averages of different lengths — most commonly the 50-day and the 200-day — and watch where they cross.
A golden cross happens when the faster 50-day average crosses above the slower 200-day average. It signals that recent prices have pulled the short-term trend up through the long-term trend — a shift toward a bullish, uptrending regime. A death cross is the mirror image: the 50-day crosses below the 200-day, signalling that momentum has rolled over into a bearish, downtrending regime.
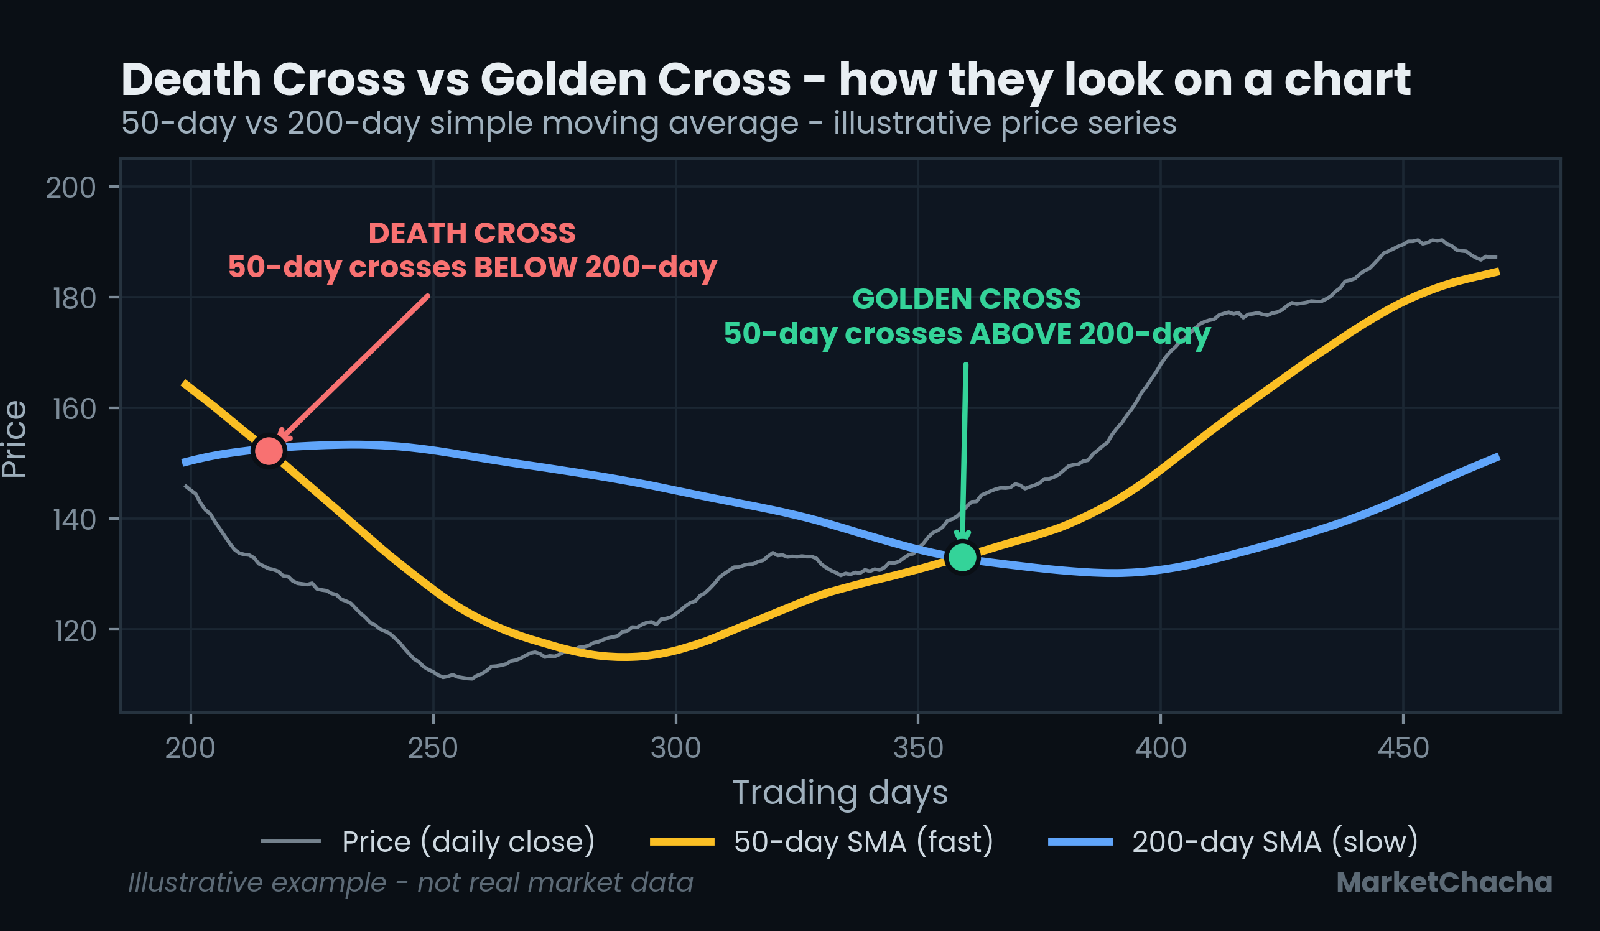
A golden cross typically unfolds in three stages: first a downtrend has to exhaust itself and the price bottoms; then selling slows, the 50-day average flattens and turns up while the 200-day is often still drifting down; finally the 50-day crosses above the 200-day and, if buyers stay in control, both averages eventually slope upward together. The death cross runs the same sequence in reverse after an uptrend tops out.
Why 50 and 200 days?
These lengths are popular for a practical reason: there are roughly 50 trading days in a calendar quarter and about 200 trading days in a year. So the 50-day average summarises the last quarter of price action and the 200-day summarises the last year — a natural short-term-versus-long-term comparison. They are conventions, not magic numbers. Short-term traders also watch the 10-day and 20-day (roughly two weeks and a month), while very long-term investors sometimes use weekly or monthly averages. The logic of a crossover is identical whatever lengths you pick: a faster line crossing a slower line flags a change in trend.
How traders actually use moving averages
Beyond crossovers, moving averages do three everyday jobs. First, as a trend filter: many traders will only look for buys when price is above a rising 200-day average, and only look for sells when it is below a falling one. Second, as dynamic support and resistance: prices often pause or bounce near a widely-watched average such as the 200-day, partly because so many people are watching the same line. Third, as a context gauge: the slope and spacing of the averages tell you whether a market is trending strongly (averages far apart and steep) or going nowhere (averages flat and tangled together).
None of this is unique to US stocks. The same 50-day and 200-day averages are watched on global indices and on Indian benchmarks like the Nifty 50 and the Sensex; a "Nifty golden cross" headline means exactly what it means anywhere else. Moving averages are one of the few tools that work identically across every liquid market and timeframe.
The catch: moving averages lag, and crosses whipsaw
Here is the honest part. A moving average is a lagging indicator — it is built entirely from prices that have already happened, so it can never predict a turn; it can only confirm one after the fact. By the time a golden cross appears, the low is usually well behind you and a chunk of the move is already gone. That is a feature (it filters out false starts) and a flaw (you are late) at the same time.
The bigger trap is the whipsaw. In a sideways, choppy market the two averages can cross back and forth repeatedly over days or weeks, each crossing technically a golden or death cross but none of them meaningful. This is why experienced traders treat a cross as context, not a command. Crossovers become far more reliable when they line up with other evidence — rising volume, momentum indicators, or a clear break in price structure — and far less reliable when the market is range-bound. A golden cross does not guarantee prices rise, and a death cross does not guarantee they fall; both simply describe the trend that has recently taken hold.
Common mistakes beginners make
- Treating a cross as an instant buy or sell button. It is a trend signal on a slow timeframe, not a precise entry. Blindly buying every golden cross gets chopped up in sideways markets.
- Using moving averages in a range. They shine in trends and fail in flat, choppy markets. If the averages are tangled and flat, the signal is noise.
- Expecting the golden cross to call the bottom. Because it lags, it confirms a recovery that has already started — it never marks the exact low.
- Assuming shorter is always better. A faster average reacts sooner but fires more false signals. More signals is not the same as more good signals.
- Ignoring the timeframe. A 50/200-day cross is a multi-month signal. It says nothing about what a stock will do tomorrow.
FAQ
What is the difference between a golden cross and a death cross? A golden cross is when the 50-day moving average rises above the 200-day (a bullish signal); a death cross is when the 50-day falls below the 200-day (a bearish signal). They are the same event in opposite directions.
Is a golden cross always bullish? It is generally read as bullish, but it is not a guarantee. Because moving averages lag, the cross confirms a trend that has already begun, and in choppy markets it can produce false signals that reverse quickly.
Should I buy a stock as soon as I see a golden cross? Most experienced traders don't. A crossover is a slow, big-picture trend filter, not a precise entry trigger. It works best as confirmation alongside volume, momentum and the overall price structure — not on its own.
Which is better, SMA or EMA? Neither is universally better. The SMA is smoother and gives fewer false signals; the EMA reacts faster because it weights recent prices more heavily. Trend-followers often prefer the SMA, while shorter-term traders often prefer the EMA.
What does the 200-day moving average tell you? It summarises roughly the last year of price action, so it is used as a long-term trend line. Price above a rising 200-day average is generally considered a healthy long-term uptrend; below a falling one, a downtrend.
Do moving averages work on indices like the Nifty or S&P 500? Yes. Moving averages and their crossovers are calculated the same way on any liquid market — individual stocks, the Nifty 50, the Sensex, the S&P 500 or commodities — and are widely watched on all of them.
Educational content only — not investment advice, and not a recommendation of any security or strategy. Technical signals like moving-average crossovers are lagging and can give false signals; they do not predict future prices. [Sources: Britannica Money — Golden Cross vs. Death Cross, Charles Schwab — A Moving Average: Simple vs. Exponential]. Always do your own research.
This article is for educational and informational purposes only. It is not financial advice, investment recommendation, or a solicitation to buy or sell securities. Investing involves significant risks. I am not a SEBI-registered investment advisor. Readers should consult their own financial advisor and conduct their own research before making any investment decisions.
Comments
Join the conversation
Sign in to join the conversation.
Follow replies, add your view, and take part in the discussion.
Sign in to commentLoading comments...