

What is the Treasury yield curve — and why does an 'inverted' one scare investors?
The Treasury yield curve is simply a line that plots the interest rate (the "yield") you earn on U.S. government debt against how long you lend for — from a 1-month T-bill all the way out to a 30-year bond. Read left to right, it shows whether short-term or long-term money pays more. Most of the time the line slopes up (longer = higher yield), which is called "normal." When it slopes down — short-term bonds paying more than long-term ones — the curve is "inverted," and that is the shape that lands on the front page, because a U.S. inversion has come before almost every recession in the past half-century. This guide explains what the curve is, how to read it, why it inverts, what an inversion does and does not tell you, and how the same idea works in India.
What the yield curve actually is
Picture a chart. The horizontal axis is time to maturity: how long until you get your money back — 1 month, 3 months, 6 months, 1 year, 2, 5, 10, 20, 30 years. The vertical axis is the yield: the annual return the market currently pays to lend for that length of time. Connect the dots for U.S. Treasuries of every maturity on a single day and you have that day's yield curve.
Two rules make the curve meaningful. First, every point is the same borrower — the U.S. Treasury — so credit risk is held constant and the only thing changing is time. Second, the yields are set by the open market minute by minute (except the very shortest bills, which hug the Federal Reserve's policy rate). So the curve is really a live snapshot of what millions of buyers and sellers collectively think interest rates, growth and inflation will do over the next few decades.
The three shapes: normal, flat and inverted
A yield curve is described by its slope:
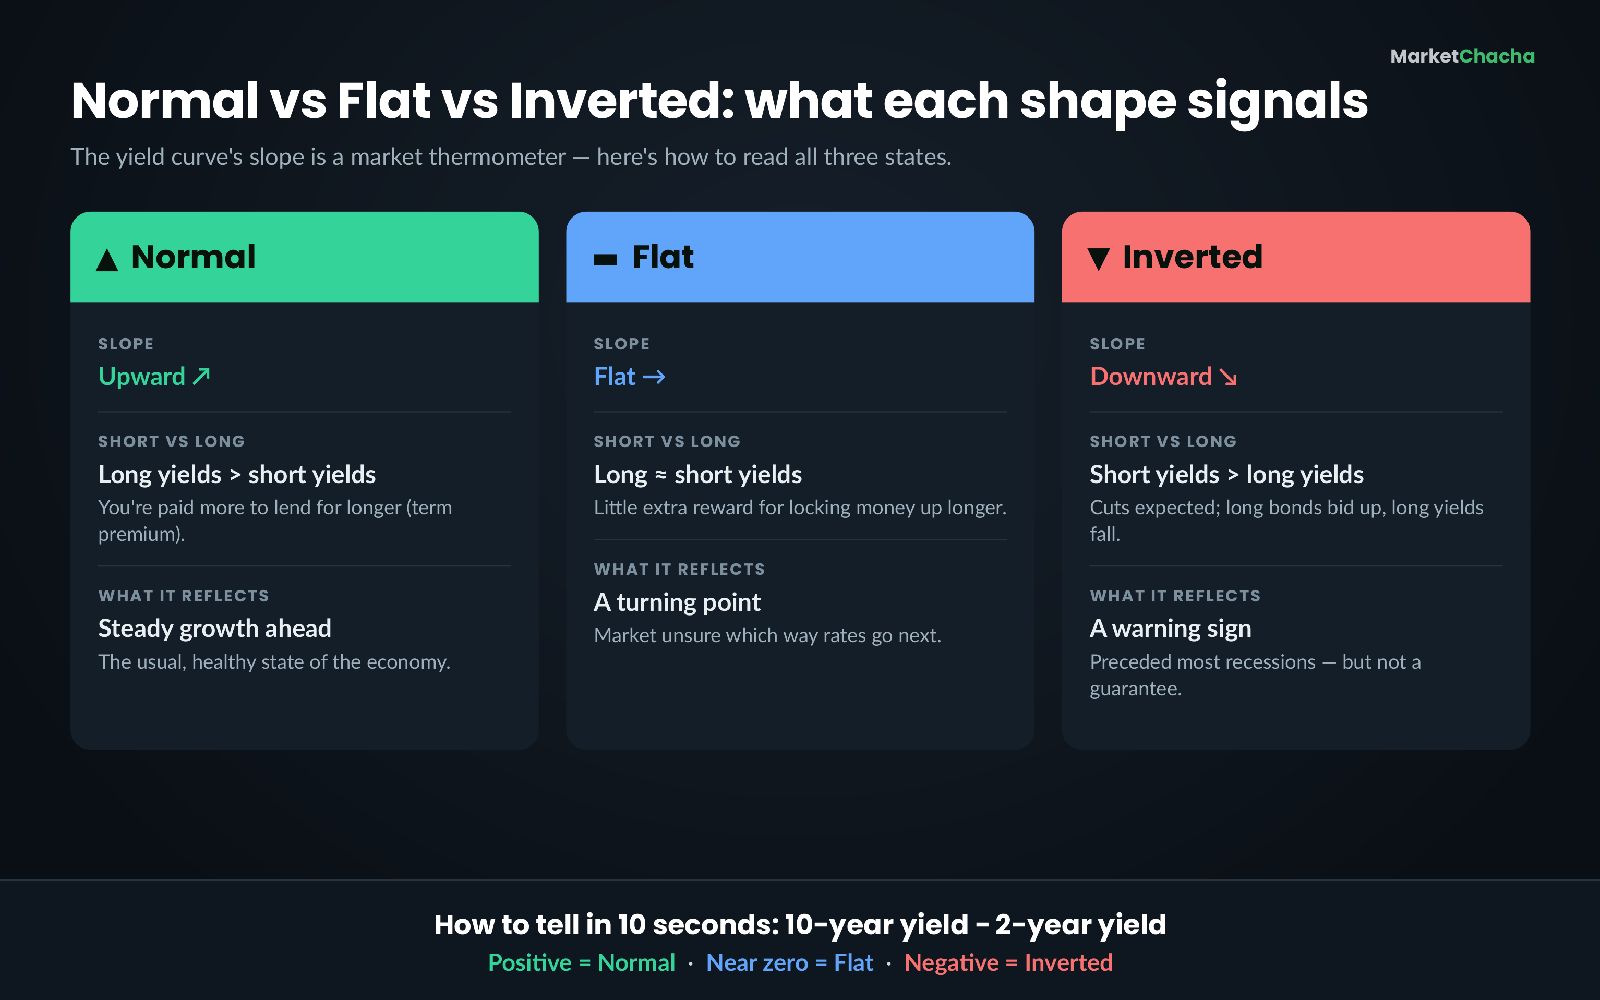
- Normal (upward-sloping): long-term yields are higher than short-term yields. This is the usual state. Lenders demand extra for locking money away longer — they face more inflation risk and give up flexibility — so a 10-year yield sits above a 2-year, which sits above a 3-month. That extra reward for going long is called the term premium.
- Flat: short and long yields are roughly equal. It often shows up when the economy is at a turning point and the market is unsure which way rates go next.
- Inverted (downward-sloping): short-term yields are higher than long-term yields. This is unusual and is the shape that gets attention.
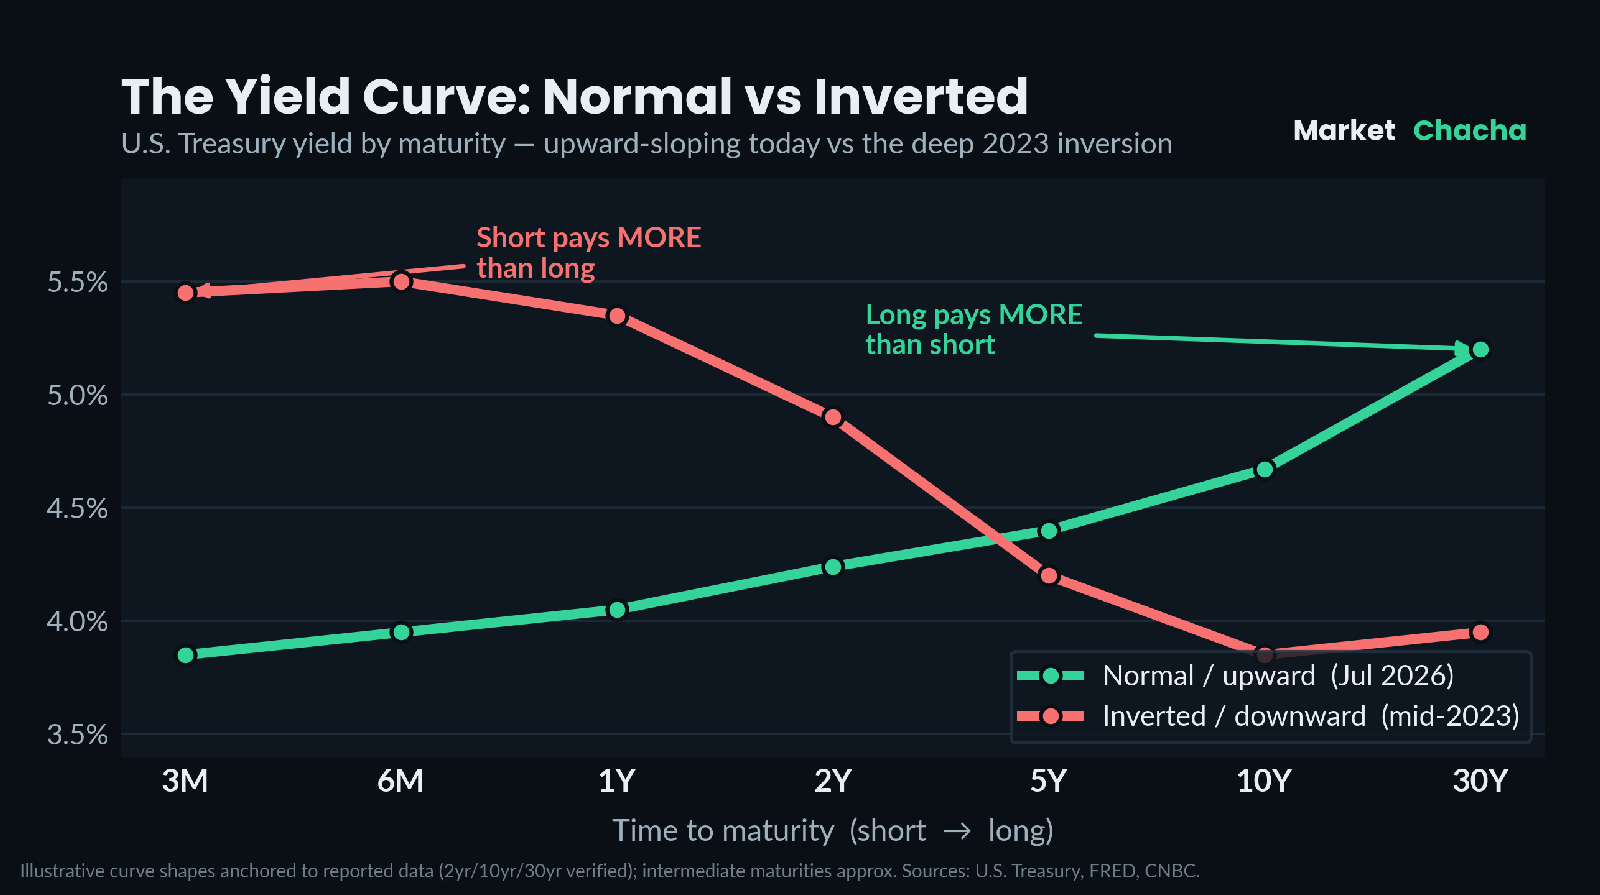
The curve below shows both extremes on real data: an upward-sloping U.S. curve in mid-2026, and the deeply inverted curve of mid-2023 for contrast.
A worked example: reading two points on the curve
You do not need the whole curve to spot an inversion — two points do the job. The two most-watched are the 2-year and the 10-year Treasury, and the gap between them is nicknamed the "2s10s" spread (10-year yield minus 2-year yield).
Take mid-2023, near the peak of the inversion. The 2-year Treasury yielded roughly 4.90% and the 10-year about 3.85%. The 2s10s spread was 3.85% − 4.90% = −1.05%, i.e. about −105 basis points. Negative means inverted: you were paid more to lend for 2 years than for 10. Now compare late July 2026: the 2-year was near 4.24% and the 10-year about 4.67% (per the Treasury/Fed and CNBC, 29 Jul 2026). The 2s10s spread was 4.67% − 4.24% = +0.43% — positive, so the curve is back to normal, upward-sloping.
Why would anyone ever accept 3.85% for ten years when two years paid 4.90%? Because a long yield is essentially the market's guess of the average of future short-term rates, plus a small term premium. If investors are convinced the Fed will cut sharply in the years ahead, the average short rate over the next decade could be well below today's 4.90% — so locking in 3.85% for ten years can beat rolling over short bills whose rate is expected to fall. That expectation is exactly what pushes the long end below the short end and inverts the curve.
Why the curve inverts — and why it makes headlines
An inversion is usually a collision of two forces. The short end is pinned up high because the Federal Reserve has raised its policy rate to cool inflation (short T-bills track that rate closely). The long end is dragged down because the same investors expect that tight policy to slow the economy and force rate cuts later — so they buy long bonds to lock in today's yield before it falls, pushing long yields below short ones.
The reason this shape frightens people is its track record. A U.S. yield-curve inversion has preceded nearly every recession since the 1960s, which is why economists — and the New York Fed's own recession-probability model — watch the 10-year-minus-3-month and 2s10s spreads so closely. But treat it as a smoke alarm, not a stopwatch. The lead time is long and variable: historically a recession has arrived anywhere from about 6 to 24 months after the curve first inverts, averaging on the order of a year. And it is not perfect — the 1998 inversion produced no recession, a clean "false positive."
The most recent episode is a live lesson in humility. The 2s10s spread was continuously negative from July 2022 to late August 2024 — the longest inversion on record — and reached its deepest level (around −108 bps in mid-2023) since the early 1980s. Yet the widely feared recession did not clearly show up in the usual window; many call it a "soft landing." The signal still deserves respect, but the 2022–24 experience is a reminder that no single indicator is destiny.
How to actually read the curve yourself
You can watch the curve for free, and it takes about a minute:
- The raw curve: the U.S. Treasury publishes the "Daily Treasury Par Yield Curve Rates" every business day — every maturity from 1 month to 30 years in one table.
- The spread, charted over time: the St. Louis Fed's free FRED database plots the 2s10s (series T10Y2Y) and the 10-year-minus-3-month (series T10Y3M). When the line drops below zero, the curve is inverted.
- The recession read-through: the New York Fed publishes a monthly recession-probability estimate derived from the 10-year/3-month spread.
To judge the shape yourself, pick two maturities and subtract the shorter yield from the longer one. Positive = normal, near zero = flat, negative = inverted. The reference card below sums up what each shape typically signals.
What it means for your money — and the catch
The curve is a thermometer, not a to-do list, but it does touch your wallet. Longer-term borrowing costs — most importantly the 30-year fixed mortgage — move roughly with the 10-year Treasury (the U.S. 30-year fixed was about 6.49% per Freddie Mac in early July 2026), while savings accounts, CDs and T-bills track the short end and the Fed's policy rate. That is why an inverted curve creates an unusual window: in 2023, a high-yield savings account or a 3-month T-bill could pay more than a 10-year bond. The catch is that this window closes: once the Fed cuts and the curve normalizes, short-term cash yields fall first, so cash that felt "safe and high-paying" quietly earns less — the very reason some savers lock in longer yields (via CDs or longer Treasuries) while short rates are still elevated.
Common mistakes beginners make
- Reading an inversion as "sell everything today." It is a lead indicator with a long, uncertain lag — stocks have often kept rising for many months after the curve inverted.
- Assuming inversion guarantees a recession. It has false positives (1998), and the 2022–24 inversion did not produce a clear recession in the usual window.
- Confusing the curve with the Fed. The Fed sets only the very short end; the market sets everything from about 2 years out. The curve is the market's view, not the Fed's decree.
- Watching a single spread. The 2s10s and the 10-year/3-month can flash different signals at the same time; look at more than one.
How this works in India
India has its own version: the G-sec (government securities) yield curve, built from Treasury bills and dated government bonds. The short end is anchored by the RBI's repo rate (held at 5.25% as of mid-2026) rather than the Fed funds rate, and the Reserve Bank auctions 91-, 182- and 364-day T-bills plus longer G-secs. As of late July 2026, India's curve was normal and upward-sloping — the 10-year-minus-1-year spread was around +100 bps, the 10-year G-sec yielded roughly 6.7–6.8%, and the 30-year near 7.4%.
Two practical differences matter for an Indian reader. First, India's curve inverts far less often and less dramatically than the U.S. one; a sharp flattening is usually the signal that liquidity is tight or that rate cuts are being priced in, rather than a full inversion. Second, retail investors can now buy T-bills and G-secs directly through the RBI Retail Direct platform, so the same "lock in a yield before rates fall" idea that drives the U.S. curve applies at home — the everyday parallel being when to fix money in a longer fixed deposit versus keeping it liquid.
FAQ
What is a yield curve in simple terms? It is a line chart of the interest rate you earn on government bonds plotted against how long you lend, from a few months to 30 years. Its slope tells you whether short-term or long-term money currently pays more.
What does an inverted yield curve mean? It means short-term bonds are yielding more than long-term ones — an unusual, downward-sloping shape. It typically appears when the central bank has rates high to fight inflation while markets expect rate cuts (and slower growth) ahead.
Does an inverted yield curve always mean a recession is coming? No. A U.S. inversion has preceded nearly every recession since the 1960s, but it has given false alarms (1998), the timing lag is long and variable, and the 2022–24 inversion — the longest on record — was not followed by a clear recession in the usual window. Treat it as a warning sign, not a guarantee.
What is the 2s10s spread? It is the 10-year Treasury yield minus the 2-year Treasury yield — the single most-quoted measure of the curve's slope. Positive means normal; negative means inverted.
Is the U.S. yield curve inverted right now? As of late July 2026 it is not — it is upward-sloping (the 2-year was near 4.24% and the 10-year near 4.67%), a normal curve. Rates change constantly, so always check current data.
Where can I see the yield curve for free? The U.S. Treasury's Daily Par Yield Curve Rates page shows the full curve each business day, and the St. Louis Fed's FRED (series T10Y2Y and T10Y3M) charts the spreads over time. In India, the RBI and NSE publish G-sec yields.
Educational content only — not investment, tax or insurance advice, and not a recommendation of any product. Rates, fees and rules change — always check current terms with the provider. Sources: U.S. Department of the Treasury, Federal Reserve H.15, FRED (St. Louis Fed), Advisor Perspectives / VettaFi, CNBC, Reserve Bank of India. Always do your own research.
This article is for educational and informational purposes only. It is not financial advice, investment recommendation, or a solicitation to buy or sell securities. Investing involves significant risks. I am not a SEBI-registered investment advisor. Readers should consult their own financial advisor and conduct their own research before making any investment decisions.
Comments
Join the conversation
Sign in to join the conversation.
Follow replies, add your view, and take part in the discussion.
Sign in to commentLoading comments...