

Drawdown and Recovery Math Explained: Why a 50% Loss Needs a 100% Gain (Beginner's In-Depth Guide)
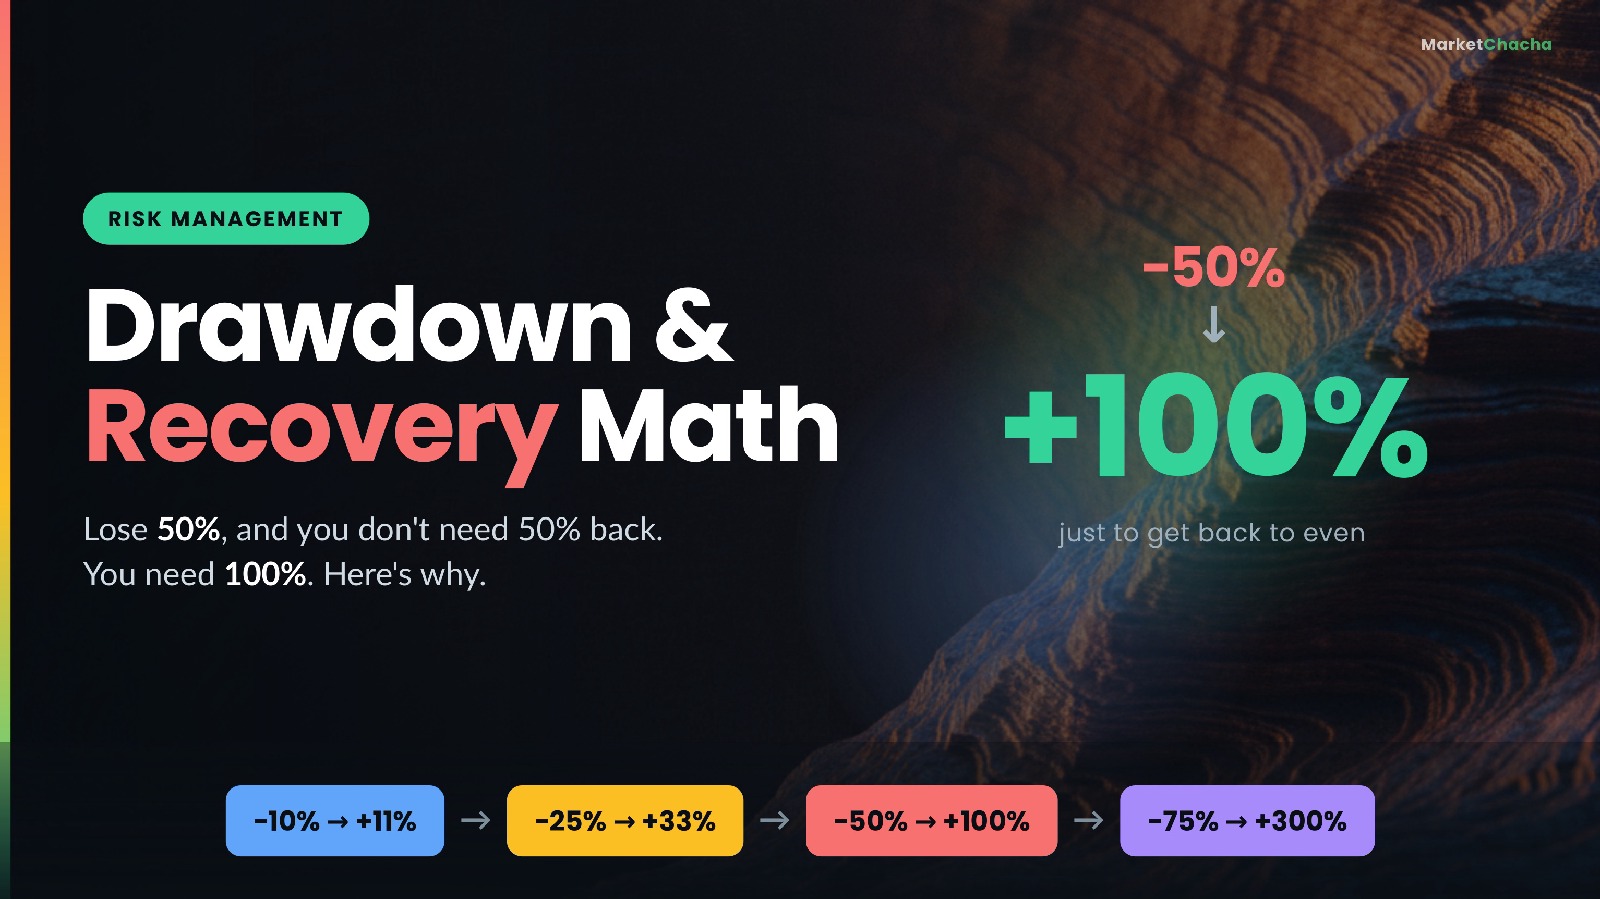
A drawdown is the fall in your portfolio (or a stock) from its highest point to its lowest point before it makes a new high — and recovery math is the uncomfortable fact that the gain you need to get back to even is always bigger than the loss you took. Lose 10% and you need +11.1% to be square. Lose 50% and you need +100%. Lose 75% and you need +300%. The formula is simple: break-even gain = loss ÷ (1 − loss). This article explains where that asymmetry comes from, works through the arithmetic step by step, shows what it does to your position sizing, and covers the mistakes it quietly punishes.
What a drawdown actually is
A drawdown is measured peak to trough, not from where you bought. Suppose your portfolio goes ₹10,00,000 → ₹12,00,000 → ₹9,00,000. Your drawdown is not "I'm down 10% from cost". It is measured from the ₹12,00,000 peak: (12,00,000 − 9,00,000) ÷ 12,00,000 = 25%.
Two numbers matter. Maximum drawdown is the deepest peak-to-trough fall you have ever experienced — it tells you the worst pain your strategy has actually put you through. Current drawdown is how far below your all-time peak you are sitting right now. Professional fund managers track both obsessively, because a strategy that earns a lovely return but takes a 60% drawdown along the way is a strategy almost no human can actually stay invested in.
The break-even formula, worked out
Here is why the asymmetry exists. Percentages are calculated on different bases on the way down and on the way up.
Start with ₹1,00,000 and lose 50%. You now have ₹50,000. To get back to ₹1,00,000 you need to make ₹50,000 — but you are now making it on a base of ₹50,000, not ₹1,00,000. And ₹50,000 ÷ ₹50,000 = 100%. The loss was calculated on the big number; the recovery has to be earned on the small number. That is the whole trick.
Formally: if you lose a fraction L, you are left with (1 − L). To return to 1, you need to multiply by 1 ÷ (1 − L), so the required gain is:
Gain needed = L ÷ (1 − L)
Check it: L = 0.50 → 0.50 ÷ 0.50 = 1.00 = +100%. L = 0.20 → 0.20 ÷ 0.80 = 0.25 = +25%. L = 0.90 → 0.90 ÷ 0.10 = 9 = +900%. A 90% loss needs a ten-bagger just to get you back to where you started.
Why the maths turns cruel after about 30%
Below roughly 20%, the gap between the loss and the required gain is small and forgivable — a 10% fall needs 11.1%, barely different. But the curve is not a straight line; it bends upward and then goes near-vertical. From 30% onwards, every extra 10% of loss adds a disproportionately larger climb.
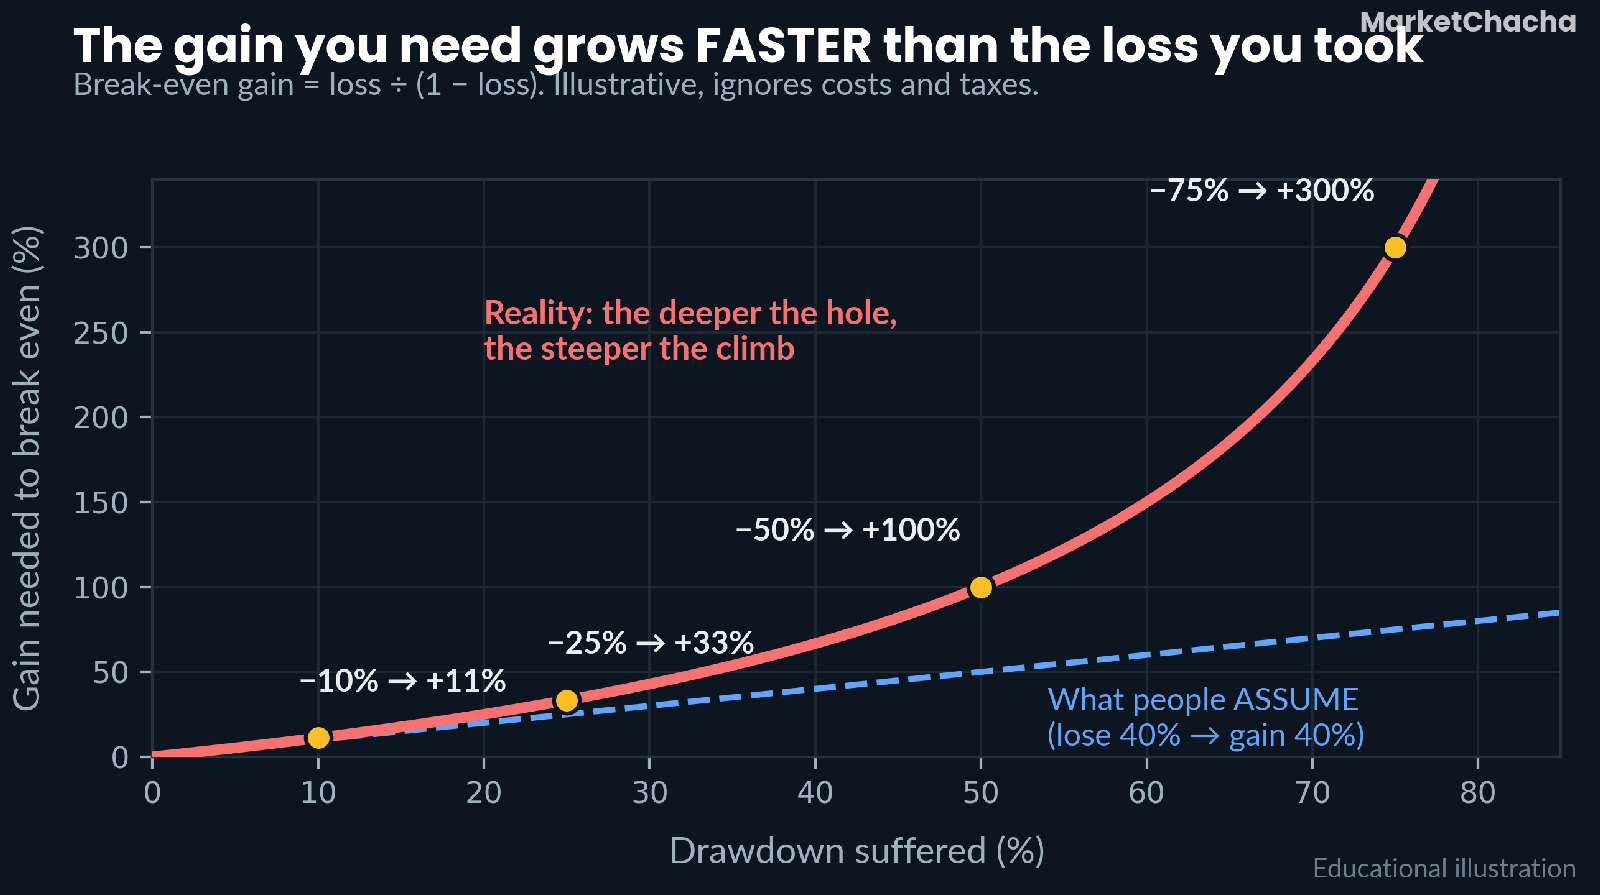
This is the single most important shape in risk management. It means small losses are cheap and large losses are catastrophic — and not in a linear way. A 20% loss is not "twice as bad" as a 10% loss; it costs you 25% of climbing versus 11%. A 60% loss is not six times a 10% loss; it demands +150% versus +11%. The whole discipline of cutting losses early exists because of this curve.
The second, hidden cost: time
The rupee figure is only half the damage. The other half is the years you spend getting back to zero — years in which your money produced nothing.
Suppose your portfolio compounds at 12% a year on average. How long does it take to climb out of a hole?
- −10% drawdown → needs +11.1% → roughly 1 year of a normal 12% return
- −25% drawdown → needs +33.3% → roughly 2.5 years
- −50% drawdown → needs +100% → roughly 6.1 years
- −75% drawdown → needs +300% → roughly 12 years
Six years of compounding, spent just to return to a number you already had. That is the real price of a 50% loss — not the money, but the six years of growth you will never get back. (Working: at 12% a year, doubling takes ln(2) ÷ ln(1.12) ≈ 6.1 years. Illustrative only; real returns are lumpy, not smooth.)
What this means for position sizing
Once you accept the curve, position sizing stops being a matter of taste and becomes arithmetic. The goal is to make sure that no single trade, and no ordinary losing streak, can push you into the steep part of the curve.
The common rule of thumb is to risk a small fixed fraction — often about 1% of the portfolio — on any single idea. "Risk" means the money you lose if your exit level is hit, not the size of the position. Worked example:
- Portfolio: ₹5,00,000. Risk per trade: 1% = ₹5,000.
- You buy a stock at ₹200 and decide in advance to exit if it closes below ₹180.
- Risk per share = ₹200 − ₹180 = ₹20.
- Position size = ₹5,000 ÷ ₹20 = 250 shares = ₹50,000 of stock (10% of the portfolio).
Notice what happened: the stop distance, not your enthusiasm, decided the size. A wider stop would have forced a smaller position. Now look at the effect of the rule over a bad run. Ten losing trades in a row at 1% risk each leaves you at 0.99¹⁰ = 0.904, a −9.6% drawdown, needing +10.6% to recover — survivable. Ten losing trades at 10% risk each leaves you at 0.90¹⁰ = 0.349, a −65% drawdown, needing +186%. Same skill, same losing streak, completely different fate.
Risk of ruin: why a bad streak is not rare
Beginners assume a run of six losses is a freak event. It isn't. Even with a coin-flip 50% hit rate, the chance of six losses in a row within any given six trades is 0.5⁶ ≈ 1.6% — and across a hundred trades, a streak of six or more is close to a certainty. Streaks are normal; the market does not owe you an alternating win-loss pattern.
Risk of ruin is the probability that a normal-looking losing streak takes you down so far that you can no longer recover — either mathematically, or psychologically, because you quit. Because losing streaks are guaranteed and the recovery curve is convex, survival depends less on how good your winners are and more on how small you keep each loss. Keep the per-trade risk small and the worst streak is a dent. Make it large and one ordinary bad month ends the game.
Common mistakes beginners make
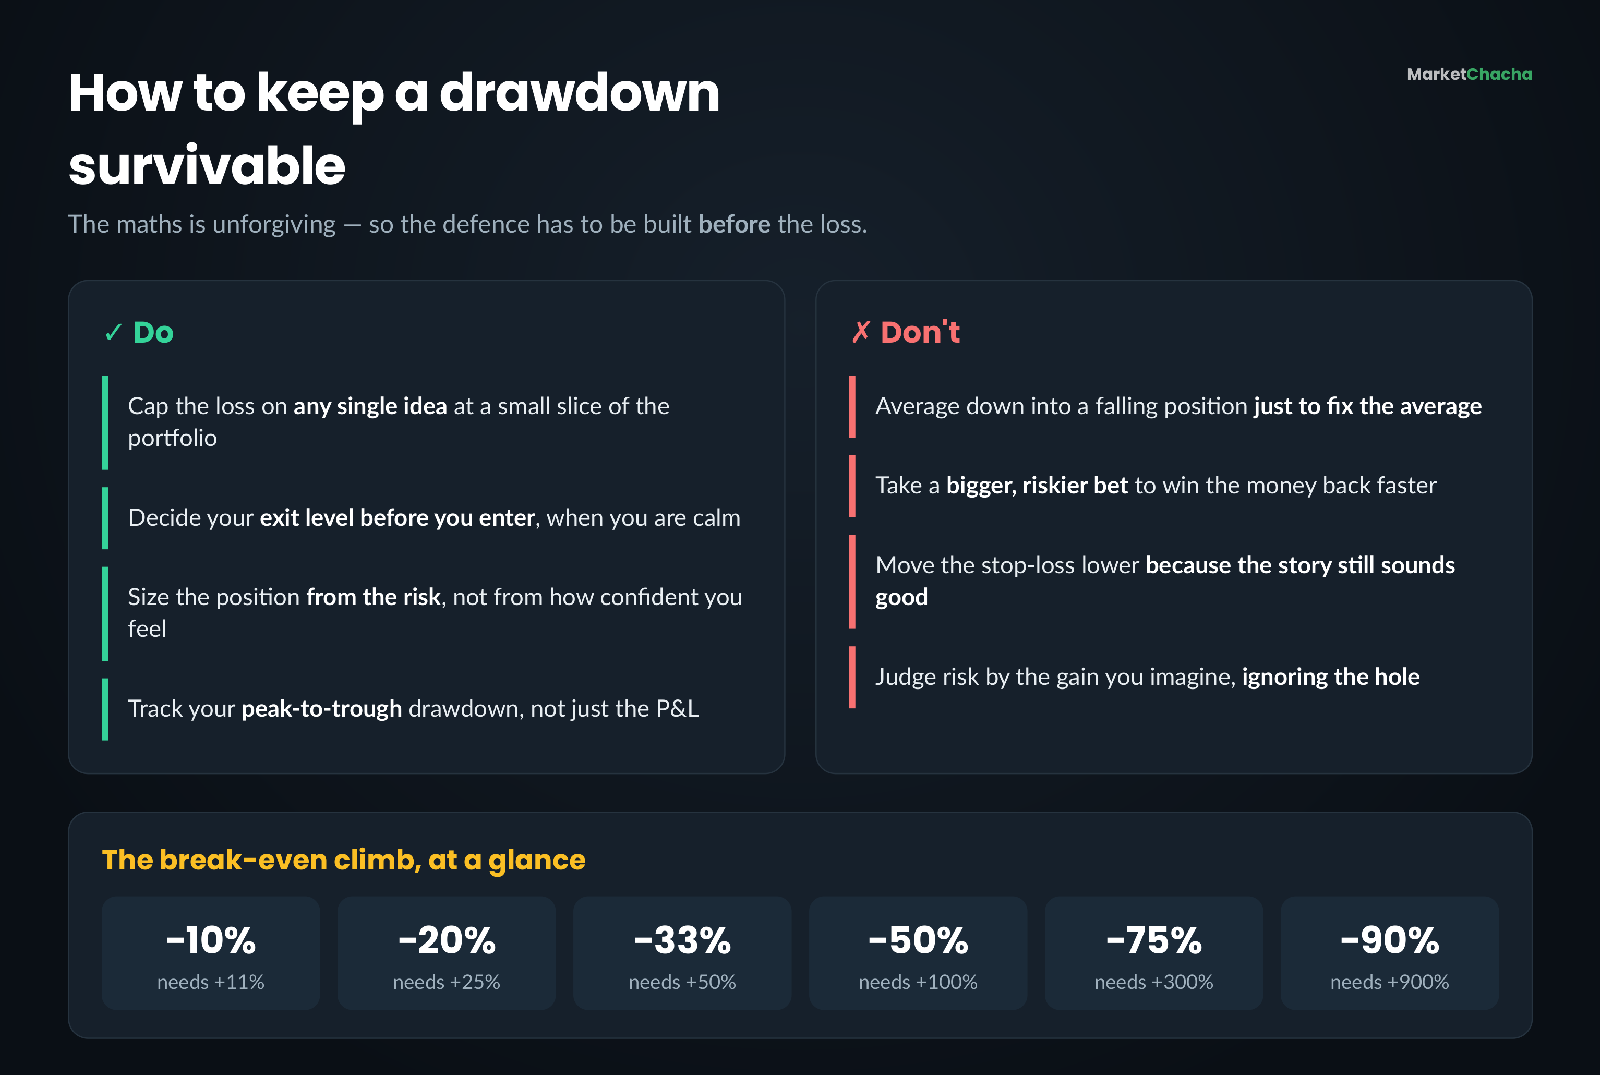
- Averaging down to "fix" the average price. A lower average price does not undo the loss; it simply puts more money into the same falling position and moves you further right along the curve.
- Trying to win it back faster. After a −30% hit, the temptation is to take a bigger, riskier bet. This is exactly the moment the maths punishes you hardest, because you are now compounding risk on a shrunken base.
- Moving the stop-loss because the story still sounds good. The exit level you set when calm is worth more than the one you rationalise when you are down.
- Confusing a drawdown with a loss. A drawdown you sit through in a diversified, quality portfolio can recover. A drawdown in a leveraged or concentrated bet may not.
- Ignoring costs and taxes. The formula gives you the minimum gain. Brokerage, STT and taxes mean the real climb is a little steeper still.
- Judging only the return, never the drawdown. Two strategies can both return 15% a year; the one that got there through a 45% drawdown is a completely different product for a real human being.
How to apply it, practically
You cannot avoid drawdowns — every investor and every index has them. What you control is their depth. Decide, before you buy, the level at which you are wrong. Size the position so that being wrong costs a small, pre-agreed fraction of the portfolio. Track your peak-to-trough drawdown alongside your returns, so you know what you are actually living with. And when you are in a hole, stop digging: the fastest way out of a drawdown is to not make it deeper.
One nuance worth knowing: this arithmetic applies to your own capital, and it applies most brutally where the loss is permanent — a broken business, a leveraged bet, an option that expired worthless. A broad, diversified index that falls 30% in a panic is running the same arithmetic, but it has an engine underneath it (earnings growth) that can climb the curve for you over time. Understanding which kind of drawdown you are in is half the job.
FAQ
Why does a 50% loss need a 100% gain to break even? Because the loss is calculated on your original, larger capital, and the recovery has to be earned on the smaller amount left. ₹1,00,000 falling 50% leaves ₹50,000; making ₹50,000 back on a ₹50,000 base is a 100% gain.
What is the formula for the gain needed to recover from a drawdown? Gain needed = loss ÷ (1 − loss). For a 40% loss: 0.40 ÷ 0.60 = 0.667, or +66.7%.
What is the difference between a drawdown and a loss? A loss is measured from your purchase price. A drawdown is measured from the peak value your portfolio or the stock reached, down to the lowest point before it makes a new high. You can be in a drawdown and still be in profit overall.
What is maximum drawdown and why do investors track it? Maximum drawdown is the largest peak-to-trough fall a portfolio or strategy has ever suffered. It tells you the worst pain the strategy has historically inflicted — a far more useful measure of "risk" for a real person than volatility, because it is what makes people abandon a plan.
How much should I risk on a single trade? There is no universal answer, but a widely taught rule of thumb is to cap the loss on any single idea at a small fixed fraction of the portfolio (often around 1%), so that even a long losing streak keeps you in the shallow, recoverable part of the curve. What suits you depends on your goals, time horizon and temperament.
How long does it take to recover from a 50% drawdown? It depends entirely on future returns, which nobody can promise. As illustration only: at a hypothetical 12% a year, doubling your money takes roughly 6 years — so a 50% drawdown would cost about six years of compounding just to return to the old peak.
Educational content only — not investment advice, not a buy/sell recommendation. No guaranteed returns. All figures are illustrative arithmetic and exclude costs and taxes. Always do your own research.
This article is for educational and informational purposes only. It is not financial advice, investment recommendation, or a solicitation to buy or sell securities. Investing involves significant risks. I am not a SEBI-registered investment advisor. Readers should consult their own financial advisor and conduct their own research before making any investment decisions.
Comments
Join the conversation
Sign in to join the conversation.
Follow replies, add your view, and take part in the discussion.
Sign in to commentLoading comments...