

What is MACD? The 12/26/9 crossover, signal line & histogram explained (Beginner's In-Depth Guide)
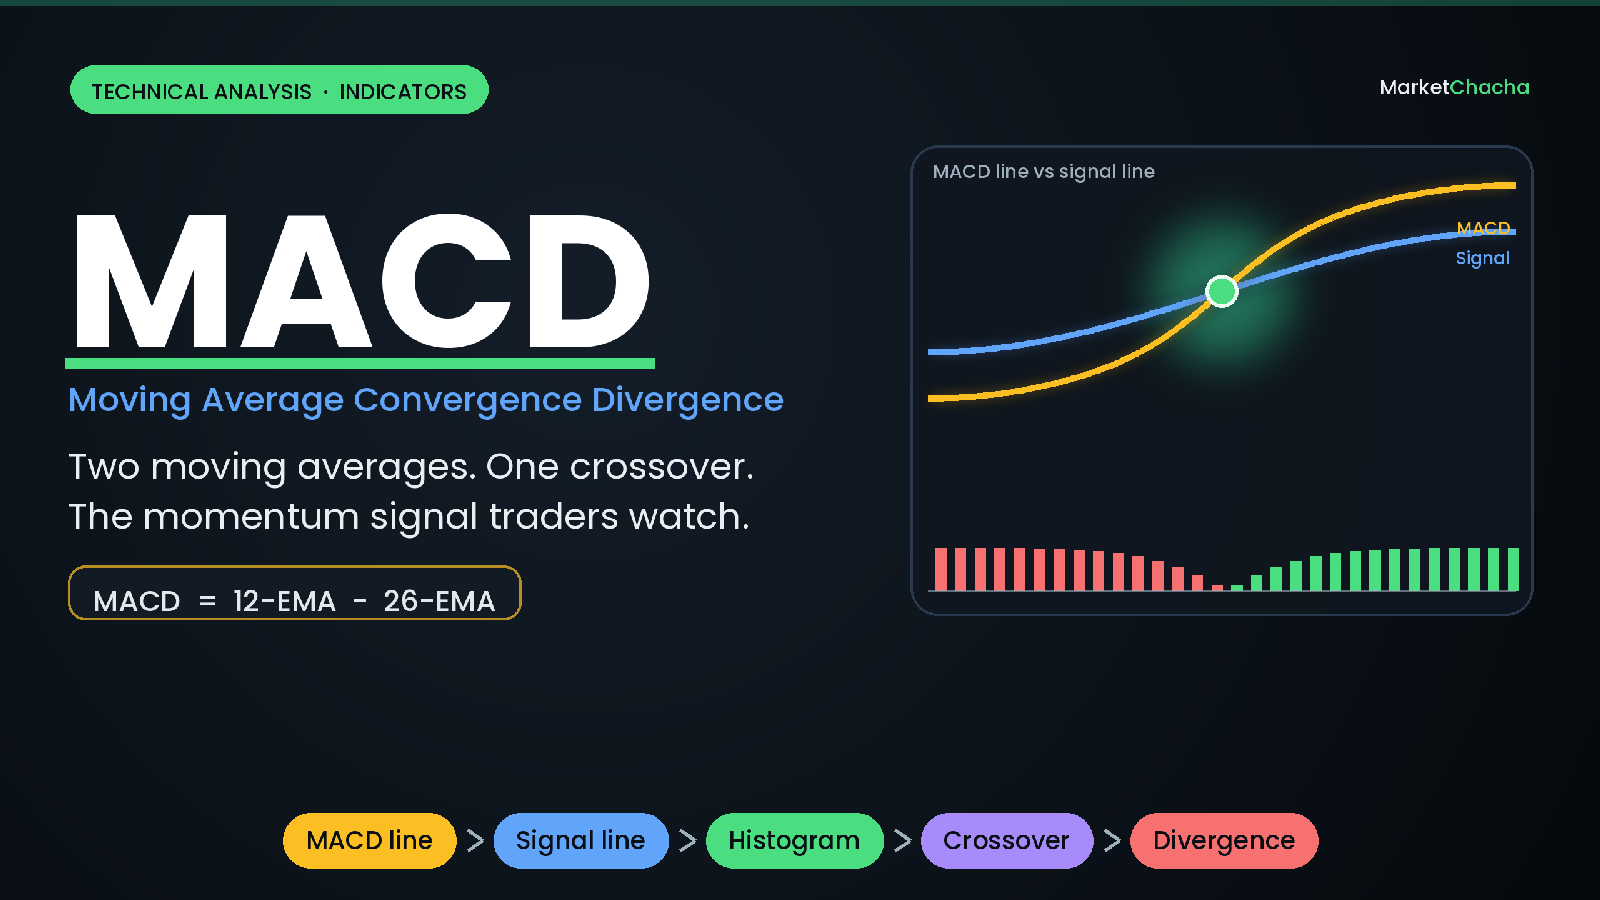
MACD (Moving Average Convergence Divergence) is a momentum indicator that measures the gap between two moving averages of a stock's price — a fast 12-period average and a slow 26-period one. When the fast average pulls away from the slow one, momentum is strengthening; when they drift back together, momentum is fading. MACD packages that idea into three things you read straight off a chart: the MACD line, a signal line, and a histogram. It was developed by Gerald Appel in the late 1970s (the histogram was added later, by Thomas Aspray in 1986), and it is one of the most widely used tools in technical analysis because it shows trend and momentum together, in a single glance.
This guide breaks down exactly how MACD is built, walks through the arithmetic with a worked example, explains the three signals traders actually watch, covers the mistakes that trip beginners up, and shows how it works on Indian platforms.
What is MACD, in plain English?
A moving average smooths out the daily jitter in a price so you can see the underlying trend. MACD simply compares two of them: a short-term average that reacts quickly to new prices, and a longer-term one that reacts slowly. Subtract the slow from the fast and you get a single number — the MACD line — that tells you how far apart they are and in which direction.
That is where the name comes from. When the two averages move apart, they are diverging and the MACD line moves away from zero. When they move back toward each other, they are converging and the MACD line drifts back toward zero. So MACD is really a picture of two moving averages breathing in and out.
Two things to keep in mind from the start. First, MACD is unbounded — unlike RSI, which is pinned between 0 and 100, MACD can be any value, so its numbers only mean something relative to that stock's own history. Second, it is a lagging indicator: because it is built from averages of past prices, it confirms a move that is already underway rather than predicting one before it happens.
The three parts: MACD line, signal line and histogram
Every MACD reading is made of three pieces, and the standard settings are written as 12/26/9:
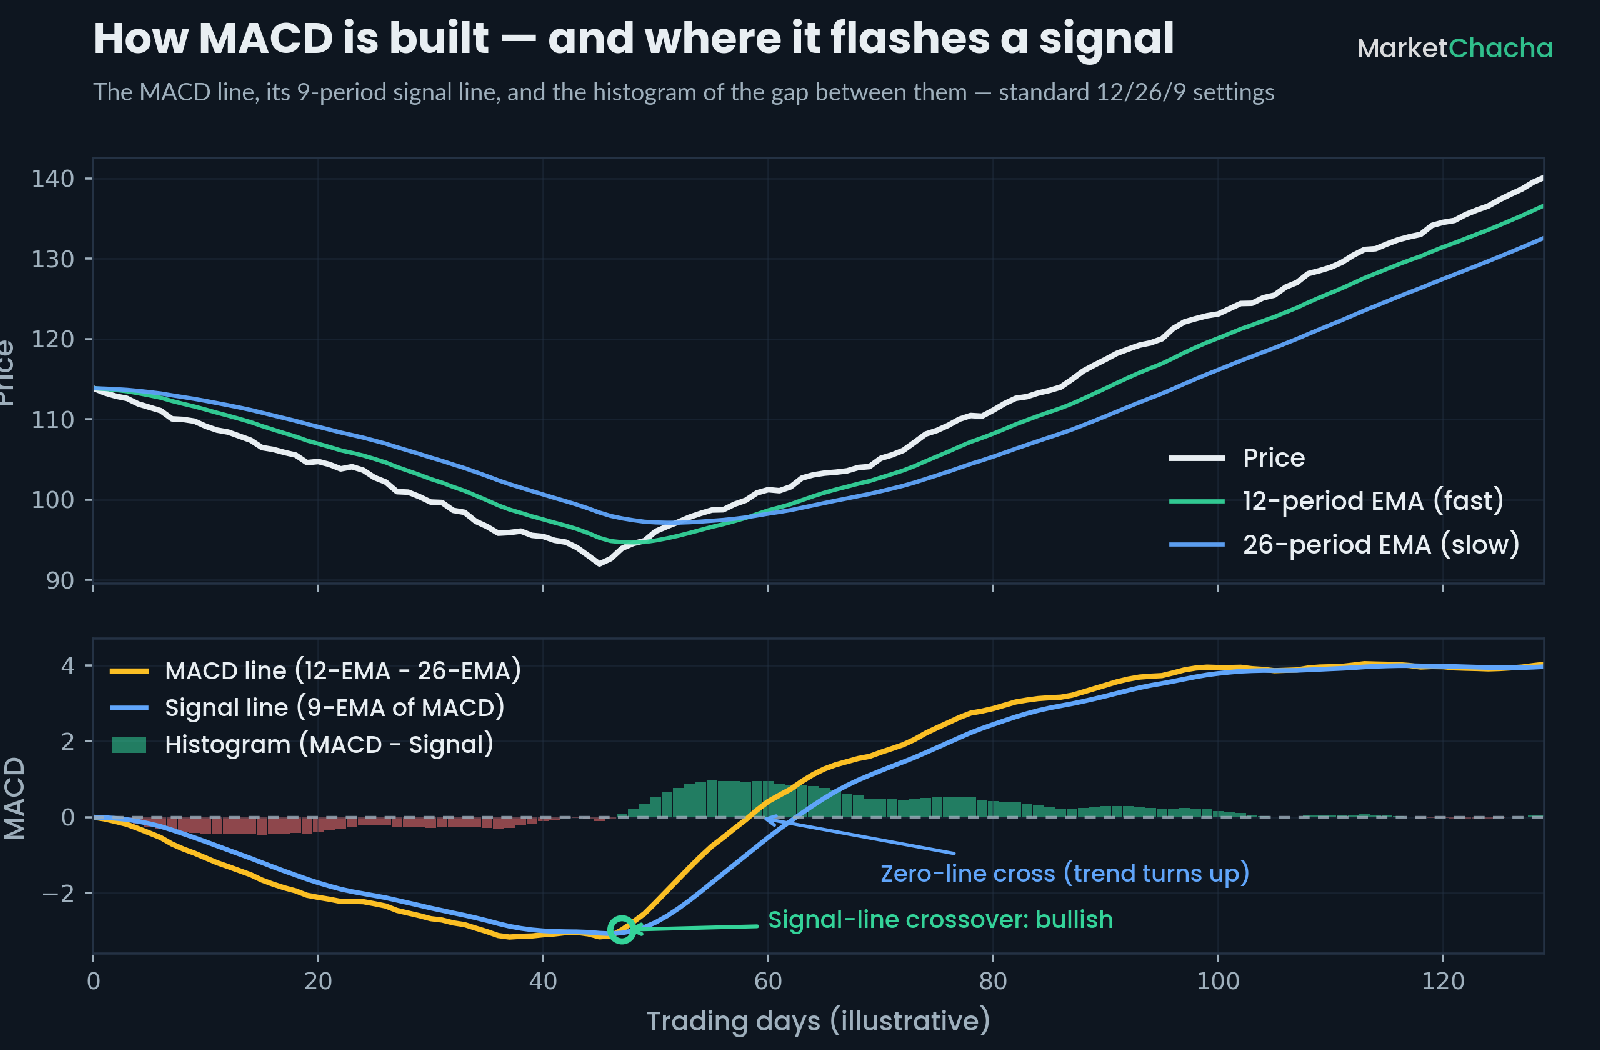
- MACD line = 12-period EMA − 26-period EMA. This is the core measure of momentum. (EMA means exponential moving average — a moving average that weights the most recent prices more heavily, which is why MACD reacts faster than two plain averages would.)
- Signal line = 9-period EMA of the MACD line. It is a smoothed, slower-moving version of the MACD line. Because it lags the MACD line slightly, the two cross each other — and those crossings are the most-watched signal.
- Histogram = MACD line − signal line. The bars simply measure the gap between the two lines. When the MACD line is above its signal, the bars are positive (above zero); when it is below, they are negative.
The chart below shows all three built from the same price series. Notice how the histogram bars shrink toward zero as the two lines come together, flip from red to green exactly at the crossover, then grow as momentum expands.
A worked example: how the numbers actually move
Say a stock is trading around $150. On a given day its 12-day EMA is $151.20 and its 26-day EMA is $148.00. Then:
- MACD line = 151.20 − 148.00 = +3.20
- Suppose the 9-day EMA of the MACD line — the signal line — currently sits at +2.40.
- Histogram = 3.20 − 2.40 = +0.80
Reading that: the MACD line is positive (the fast average is above the slow one, so the recent trend is up) and it is above its signal line, so the histogram is positive. Momentum is with the buyers.
Now fast-forward a few weeks. The rally stalls. The 12-day EMA slips to $150.10 while the 26-day EMA is $149.30:
- MACD line = 150.10 − 149.30 = +0.80 (still positive, but much smaller)
- The signal line, which smooths the recent, higher MACD readings, has caught up to +1.10.
- Histogram = 0.80 − 1.10 = −0.30
The MACD line has just dropped below its signal line — a bearish signal-line crossover — even though MACD is still above zero. This is the single most important thing to understand about MACD: the signal-line crossover and the zero-line crossover are two different events. Here, momentum turned down (signal-line cross) well before the trend itself flipped (which would need MACD to fall below zero).
The three signals MACD gives you
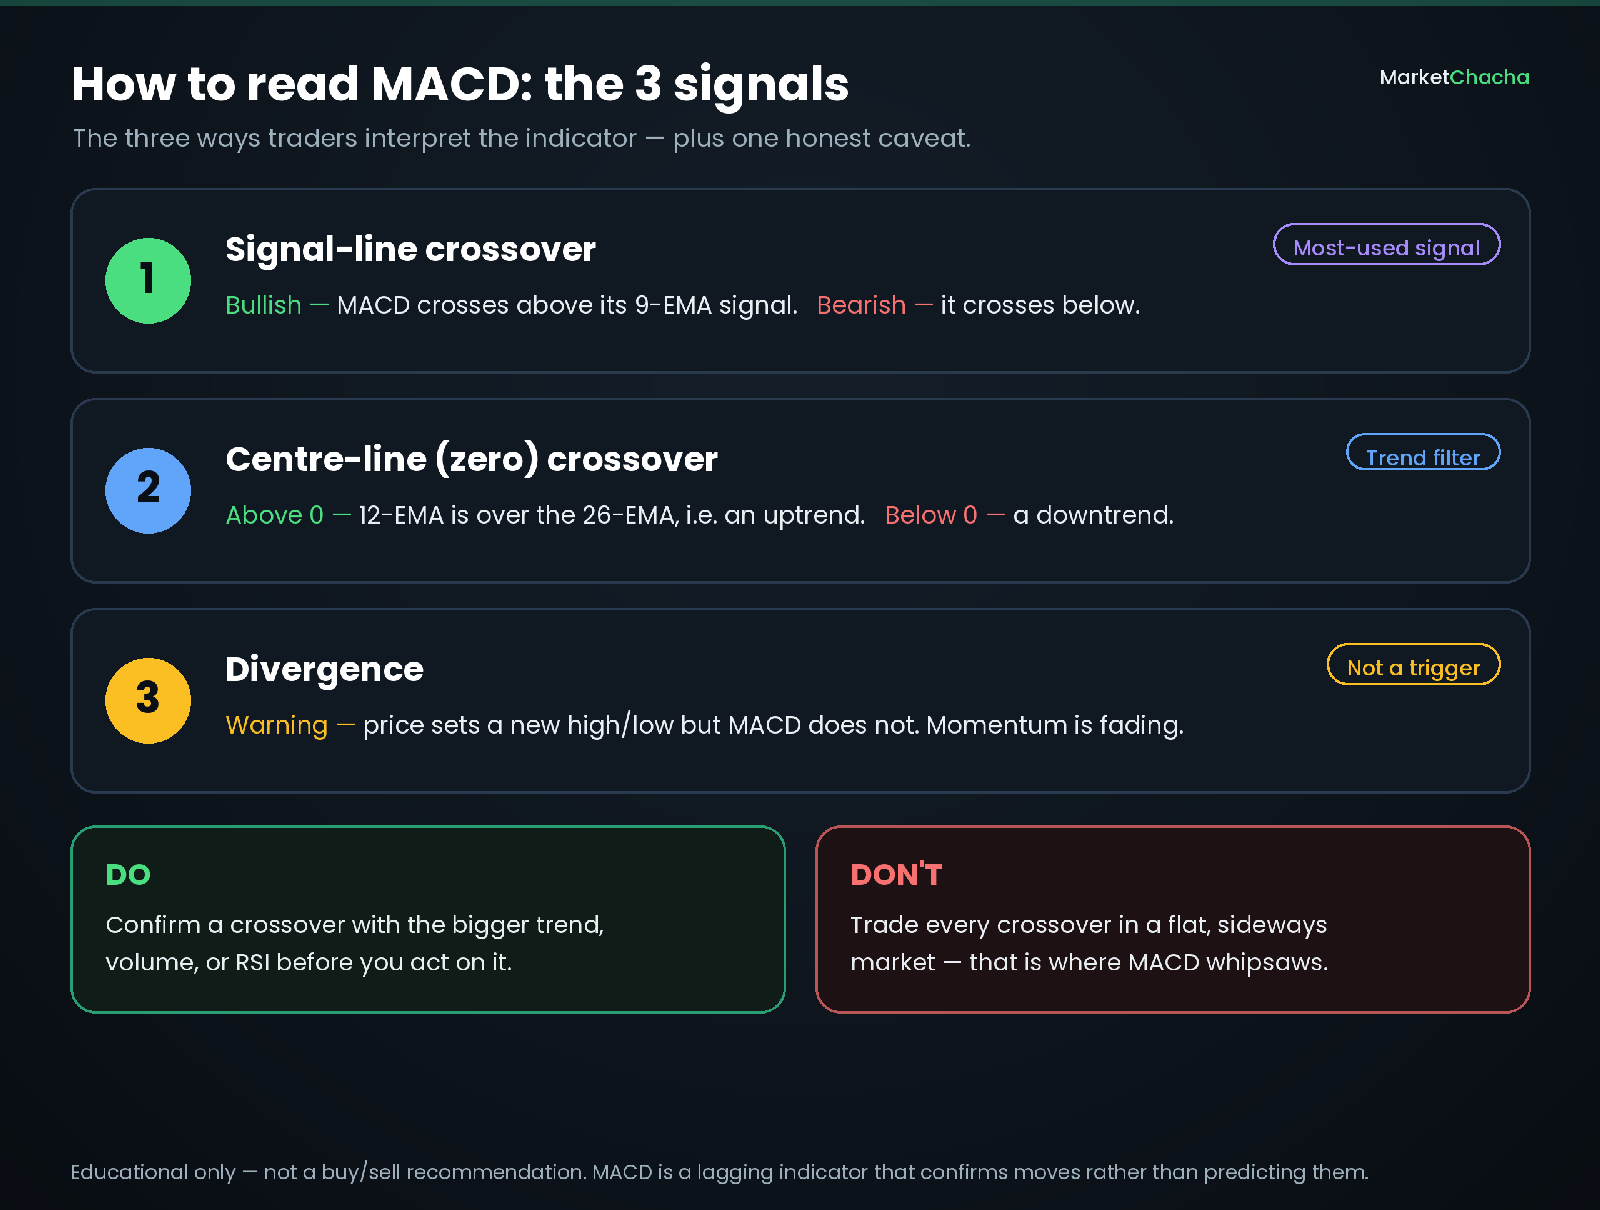
1. Signal-line crossover
This is the most frequently used MACD signal. A bullish crossover is when the MACD line crosses above its signal line (the histogram flips from negative to positive). A bearish crossover is when it crosses below (the histogram flips negative). It flags a shift in short-term momentum. Because it fires often, it also produces the most false alarms — more on that below.
2. Zero-line (centre-line) crossover
When the MACD line crosses above zero, the 12-EMA has moved above the 26-EMA — the trend has turned up. Crossing below zero means the opposite. This is a slower, higher-conviction signal than a signal-line crossover, because it reflects a change in the actual trend, not just a wobble in momentum.
3. Divergence
Divergence is when price and MACD disagree. If a stock makes a new high but MACD makes a lower high, buying momentum is quietly weakening even as price climbs — a potential warning. The reverse (price making a new low while MACD makes a higher low) hints that selling pressure is drying up. Divergence is a heads-up, not a trigger: it can persist for a long time, and it does not tell you when anything will happen.
What the histogram is really telling you
The histogram is often the first thing experienced traders glance at, because it turns "how far apart are the two lines?" into a shape. Growing bars mean the MACD line is pulling away from its signal — momentum is accelerating. Shrinking bars mean they are converging — momentum is slowing, even if price is still rising. A histogram that is still green but getting shorter each day is a classic early hint that a move is running out of steam, often before the lines themselves cross.
Common mistakes beginners make with MACD
- Trading every crossover. In a flat, sideways market the two lines cross back and forth constantly, generating "whipsaws" — a string of small losing signals. MACD works best when a market is actually trending.
- Treating MACD as a crystal ball. It is a lagging, confirming tool. It will never get you in at the exact bottom or out at the exact top, and expecting that leads to disappointment.
- Ignoring the bigger trend. A bullish crossover inside a strong downtrend is far less reliable than one that lines up with the primary trend. Zoom out before you act.
- Confusing the two crossovers. As the worked example showed, a signal-line crossover is not the same as a zero-line crossover. Know which one you are looking at.
- Over-tuning the settings. Beginners often tweak 12/26/9 endlessly chasing a "perfect" setup. Those numbers are a sensible default, not magic — but changing them will not turn a lagging indicator into a leading one.
How to actually use MACD
The practical way to use MACD is as a confirmation tool inside a bigger process, not as a standalone buy/sell machine. A common approach: first decide the trend on a higher timeframe (is the stock broadly rising or falling?), then use MACD on your trading timeframe to time entries in the direction of that trend. Many traders pair it with a second, differently-built indicator — for example RSI for overbought/oversold context, or volume to confirm that a breakout has real participation behind it — so they are not relying on one signal alone.
You can also read the histogram for early warnings (shrinking bars into a rally), and treat divergence as a reason to tighten risk rather than to flip your position outright. And because MACD lags, define your risk — where you are wrong — before you enter, not after.
How this works in India
MACD is universal: the maths is identical whether you are looking at Apple, the S&P 500, Reliance, HDFC Bank, the Nifty 50 or the Sensex. The default 12/26/9 settings are the same everywhere, and the indicator is built into every major Indian platform — Zerodha Kite, Groww, Upstox, Angel One and charting tools such as TradingView and Investing.com — usually one click away under the "indicators" or "studies" menu.
Indian swing traders commonly apply MACD on daily and weekly charts of index and large-cap stocks to time entries within an existing trend, while intraday traders use it on shorter timeframes (with the same caution about whipsaws in range-bound sessions). India's T+1 settlement cycle changes nothing about the calculation — MACD reads closing prices exactly as it does anywhere else.
One important note for Indian readers: this is education, not a recommendation. Under SEBI rules, only a registered Research Analyst or Investment Adviser can give you specific buy/sell calls. Learn the mechanic, test it on past charts yourself, and make your own decisions.
FAQ
Is MACD a good indicator for beginners? Yes — it is popular precisely because it is intuitive: two lines and a set of bars that show trend and momentum together. Just remember it lags price and works best in trending, not sideways, markets.
What do the numbers 12, 26 and 9 in MACD mean? They are the default periods: a 12-period fast EMA and a 26-period slow EMA form the MACD line, and a 9-period EMA of that line forms the signal line. They are a widely used convention, not magic numbers.
What is the difference between the MACD line and the signal line? The MACD line is the raw momentum measure (12-EMA minus 26-EMA). The signal line is a smoothed, slower 9-EMA of the MACD line. The two crossing each other is the most common MACD signal.
Does a MACD crossover mean I should buy or sell? No. A crossover flags a shift in momentum, but it fires often and produces false signals in choppy markets. It is best used as confirmation alongside the broader trend and other tools — not as an automatic trade order.
What is MACD divergence? It is when price and MACD disagree — for example, price makes a new high but MACD does not. It suggests momentum is fading and is a warning to watch, not a precise timing signal.
Which timeframe is best for MACD? There is no single best one. Longer timeframes (daily, weekly) give fewer but more reliable signals; shorter ones give more signals with more noise. Match the timeframe to how long you intend to hold.
Educational content only — not investment advice, and not a recommendation to buy or sell any security. Technical indicators can and do give false signals. Always do your own research. [Sources: StockCharts ChartSchool — MACD, StockCharts ChartSchool — MACD-Histogram, AAII — Moving Average Convergence/Divergence]
This article is for educational and informational purposes only. It is not financial advice, investment recommendation, or a solicitation to buy or sell securities. Investing involves significant risks. I am not a SEBI-registered investment advisor. Readers should consult their own financial advisor and conduct their own research before making any investment decisions.
Comments
Join the conversation
Sign in to join the conversation.
Follow replies, add your view, and take part in the discussion.
Sign in to commentLoading comments...