

How do you read an income statement? Revenue, gross profit, operating income and net profit explained (Beginner's In-Depth Guide)

An income statement (also called the profit and loss statement, or P&L) is the financial statement that shows how much money a company brought in over a period — a quarter or a year — and what was left after every cost was subtracted. It is built like a staircase: you start at the top with revenue, walk down through cost of sales, operating expenses, interest and tax, and arrive at the bottom line, net income. The US Securities and Exchange Commission's own beginners' guide describes it exactly that way — "a set of stairs" that you descend one deduction at a time.
This guide walks the whole staircase with a worked example you can follow line by line, shows you the three profit margins it produces, explains what the statement quietly leaves out, and closes with a section on how the same statement is laid out in India, where the format is genuinely different.
What an income statement actually measures (and what it doesn't)
The income statement covers a period of time — "for the year ended 31 March 2026", "for the three months ended 30 June". That is the key difference from the balance sheet, which is a snapshot of a single day.
The second thing to understand is that it is prepared on an accrual basis. Revenue is recorded when it is earned and expenses when they are incurred — not when cash actually moves. A company that ships $10 million of goods in March and gets paid in June still records that $10 million of revenue in March. This is why a profitable company can run out of money, and why the SEC's guide points out that it takes the cash flow statement, not the income statement, to tell you whether a company actually generated cash.
So the income statement answers "did this business make a profit?" It does not answer "does this business have cash?", "what does it own and owe?" (balance sheet) or "is the profit high quality?" (you need all three statements plus the notes for that).
The staircase, line by line
Reading down a typical US-style income statement:
- Revenue / Net sales — the money brought in from selling products or services, after deducting returns, discounts and allowances. This is the "top line".
- Cost of sales (COGS) — what it cost to produce or deliver the things that were actually sold: raw materials, factory labour, direct production costs.
- Gross profit — revenue minus cost of sales. What's left to cover everything else.
- Operating expenses — the costs of running the business rather than making the product: selling, general and administrative (SG&A), research and development, marketing, and depreciation and amortisation (spreading the cost of long-lived assets over their useful lives).
- Operating income — gross profit minus operating expenses. Profit from the core business, before financing and tax.
- Non-operating items — mainly interest expense on borrowings and interest or investment income. Under SEC rules, interest expense gets its own prescribed line rather than being netted away inside something else.
- Pre-tax income — operating income adjusted for those non-operating items.
- Income tax expense — the tax charge for the period.
- Net income — the bottom line: what the company actually earned or lost.
- Earnings per share (EPS) — net income divided by the share count, shown as both basic and diluted. Diluted assumes options and convertibles turn into shares, so it is the more conservative number.
One honest caveat: the exact captions vary. Some companies write "Total net sales", others "Revenue"; some show "Gross margin" where others show "Gross profit"; some banks and financial firms don't present a gross profit line at all because the concept doesn't apply to them. Read the labels the company actually used rather than assuming a template.
Worked example: walking down the stairs with real arithmetic
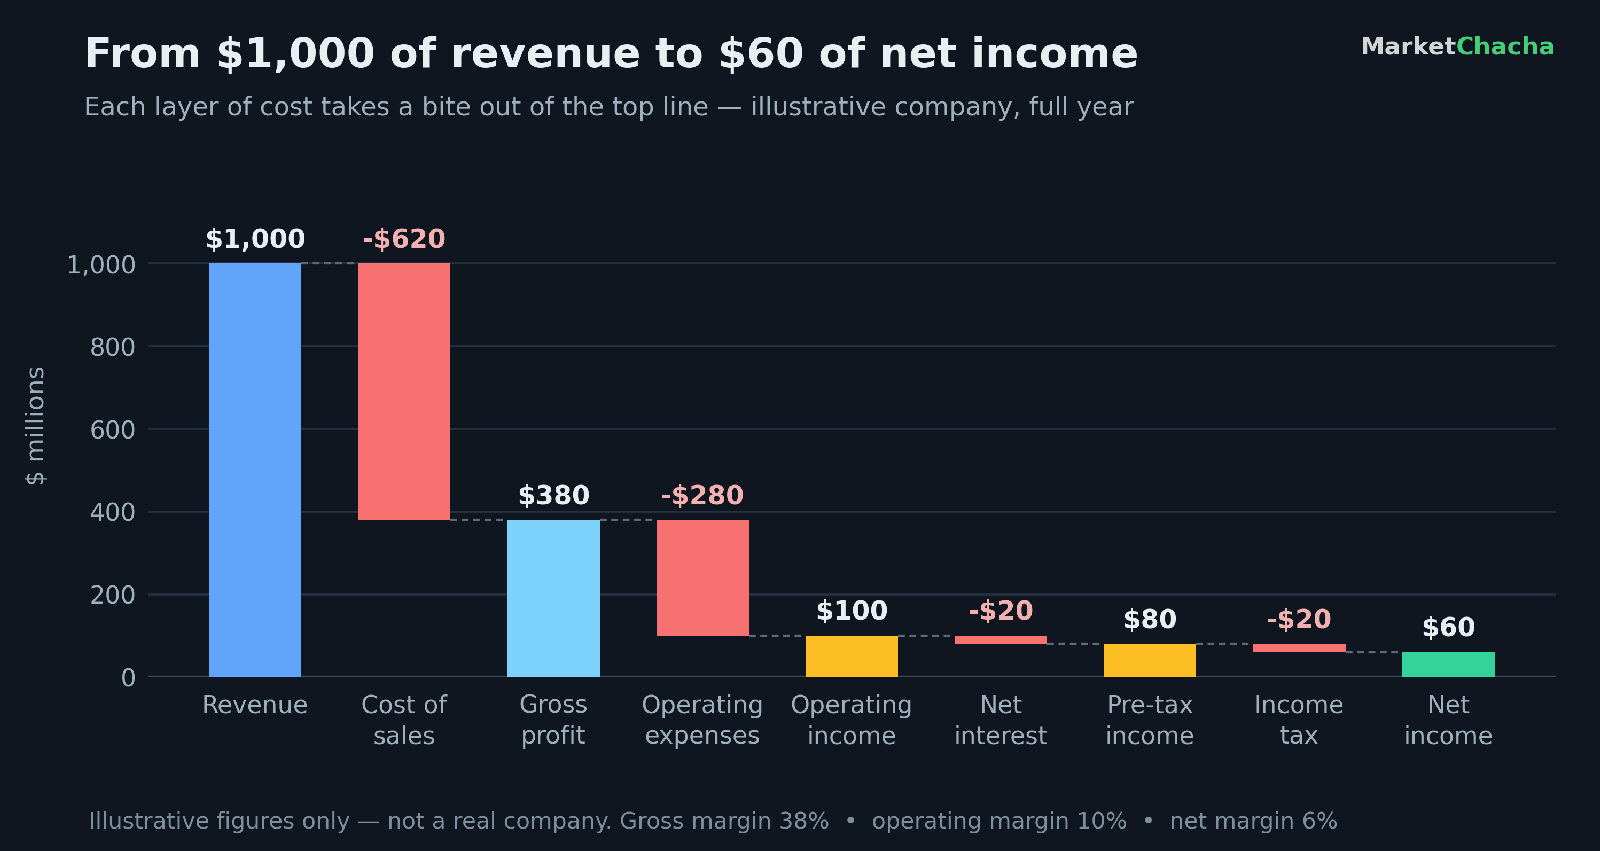
Take an illustrative manufacturer, Lumina Tools, for a full financial year. All figures in millions of dollars — these numbers are made up to demonstrate the mechanics, not drawn from any real company.
- Revenue: $1,000
- Less cost of sales: $620 → Gross profit = $380
- Less operating expenses — SG&A $180 + R&D $60 + depreciation and amortisation $40 = $280 → Operating income = $100
- Less interest expense $25, plus interest income $5 → Pre-tax income = $80
- Less income tax at 25% = $20 → Net income = $60
- Weighted average diluted shares: 50 million → Diluted EPS = $60m ÷ 50m = $1.20
Notice what just happened. Out of every dollar of revenue, 38 cents survived cost of sales, 10 cents survived the cost of running the company, and just 6 cents reached the shareholder. That collapse from 38% to 6% is the whole story of this business, and it is invisible if you only look at the top line or only at the bottom line.
The three margins — and what each one is really telling you
Each step of the staircase produces a margin. Divide by revenue and you get a percentage you can compare across years and across companies of wildly different sizes.
- Gross margin = gross profit ÷ revenue = $380 ÷ $1,000 = 38%. This is about pricing power and production cost. A gross margin that keeps falling usually means input costs are rising faster than the company can raise prices, or the sales mix is shifting to cheaper products.
- Operating margin = operating income ÷ revenue = $100 ÷ $1,000 = 10%. This is about operating efficiency — whether the overheads, salespeople and R&D budget are sized sensibly against the gross profit they generate. It is the cleanest measure of the core business because it strips out how the company is financed and how it is taxed.
- Net margin = net income ÷ revenue = $60 ÷ $1,000 = 6%. The final answer, but the noisiest one: it moves with debt levels, tax rates and one-off items that have nothing to do with whether the business is good.
You will also hear about EBITDA — earnings before interest, tax, depreciation and amortisation. In this example, operating income of $100 plus the $40 of depreciation and amortisation gives EBITDA of $140, a 14% margin. Be careful here: that addition only works because we said all $40 of D&A sat inside operating expenses. If part of a company's depreciation is buried inside cost of sales — common for manufacturers — you have to add that part back too, which is why EBITDA is a non-GAAP measure that different companies calculate differently. Always check how the company defined it.
How to read the statement in practice
A beginner-friendly routine that works on almost any company:
- Read across, not just down. Every filing shows at least the prior period next to the current one. Growth is the point: revenue up 12% while costs are up 20% is a very different company from the reverse.
- Convert everything to margins. Absolute rupees or dollars tell you size; margins tell you quality. Track all three margins over three to five years and the trend will usually say more than any single year's figure.
- Check whether profit grew for a good reason. Net income can rise because the business sold more, or because interest costs fell, or because a tax credit landed, or because an asset was sold. Only the first one repeats.
- Look for one-off items. Restructuring charges, impairments, litigation settlements and asset sales distort a single period. Companies flag these; the notes explain them.
- Cross-check against cash. If net income keeps rising while cash from operations doesn't, that gap is worth understanding.

Common mistakes beginners make
- Treating revenue as a measure of success. Revenue growth funded by selling below cost is not success. A company can grow its top line forever and never earn a cent.
- Assuming profit means cash in the bank. Accrual accounting means the two routinely diverge. This is the single most common misreading of an income statement.
- Comparing margins across unrelated industries. A software company with an 80% gross margin is not "better run" than a supermarket at 25% — those are different business models. Compare a company to its own history and to its direct peers.
- Using basic EPS when diluted exists. If a company has issued a lot of options or convertible notes, basic EPS flatters it. Diluted is the number to anchor on.
- Ignoring "other income". If a meaningful slice of pre-tax profit comes from interest on idle cash or a property sale rather than from operations, the headline profit growth is not what it appears.
- Forgetting the share count can change. Net income can be flat while EPS rises purely because the company bought back stock — or falls because it issued more.
Where the income statement fits with the other two statements
The three statements interlock. Net income from the bottom of the income statement flows into retained earnings on the balance sheet, increasing equity. It is also the starting line of the cash flow statement, where non-cash charges like depreciation are added back and changes in working capital are adjusted for, to get from accounting profit to actual cash generated.
That linkage is why analysts rarely read one statement alone. The income statement tells you the story the company is telling; the balance sheet tells you what that story has done to its financial position; the cash flow statement tells you whether the story converted into money.
How this works in India
Indian companies file a Statement of Profit and Loss under Schedule III of the Companies Act, 2013, and the format is meaningfully different from the US one — which trips up a lot of beginners moving between the two.
Under Division II of Schedule III, which applies to companies following Ind AS (listed companies and larger unlisted ones), the order runs: Revenue from operations → Other income → Total income → Expenses → Profit before exceptional items and tax → Exceptional items → Profit before tax → Tax expense (current and deferred) → Profit for the period → Other comprehensive income → Total comprehensive income → Earnings per equity share (basic and diluted).
The big structural difference is that Schedule III requires expenses to be presented by nature, not by function: cost of materials consumed, purchases of stock-in-trade, changes in inventories, employee benefits expense, finance costs, depreciation and amortisation expense, and other expenses. There is no cost-of-sales line and therefore no gross profit subtotal on the face of an Indian P&L. If you want gross margin for an Indian company, you have to build it yourself from the materials and inventory-change lines. Similarly, "operating profit" or EBITDA is not a printed line — screeners compute it, and different screeners compute it differently.
Two more India-specific things to watch. Other income sits right at the top, above total income, and for cash-rich Indian companies it can be a large share of profit before tax — always check how much of the profit growth came from operations rather than treasury income. And Indian filings come in standalone and consolidated versions; the consolidated statement includes subsidiaries and is usually the one that reflects the actual group business. Under Division II, "extraordinary items" are not permitted; unusual items are shown as clearly labelled exceptional items instead.
FAQ
What is the difference between an income statement and a balance sheet? An income statement covers a period of time and shows revenue, expenses and profit for that period. A balance sheet is a snapshot of a single date showing what the company owns, owes and the equity left over. Profit from the income statement flows into the balance sheet as retained earnings.
Is the income statement the same as the profit and loss statement? Yes. "Income statement" is the common US term, "profit and loss statement" or "P&L" is used widely elsewhere, and Indian companies file it under the Companies Act, 2013 as the "Statement of Profit and Loss". Same document, different names.
Why does a company show a profit but have no cash? Because income statements use accrual accounting: revenue is booked when it is earned and expenses when they are incurred, regardless of when cash moves. If customers haven't paid yet, or the company has tied up money in inventory, profit can be positive while the bank balance falls. The cash flow statement is where you check this.
What is the difference between gross profit, operating income and net income? Gross profit is revenue minus the direct cost of what was sold. Operating income takes gross profit and subtracts the cost of running the business — SG&A, R&D, depreciation. Net income takes operating income and additionally subtracts interest and tax. Each one absorbs one more layer of cost.
What is a good net profit margin? There is no universal number — it depends entirely on the industry. Software and pharma businesses often run high margins; grocery retail and distribution run low ones on high volume. The useful comparison is a company against its own history and against direct competitors, not against the market as a whole.
Why is there no gross profit line in an Indian company's P&L? Because Schedule III of the Companies Act, 2013 requires expenses to be disclosed by nature — materials, employee benefits, finance costs, depreciation, other expenses — rather than split into cost of sales and operating expenses. You can approximate gross profit yourself, but it is not printed on the face of the statement.
Educational content only — not investment, tax or insurance advice, and not a recommendation of any product. All company figures in the worked example are illustrative and do not represent any real company. Accounting standards and reporting formats change — always check the current filing and the accompanying notes. [Sources: U.S. Securities and Exchange Commission — Beginners' Guide to Financial Statements, Schedule III, Companies Act 2013 (Statement of Profit and Loss format), PwC Viewpoint — income statement presentation, Regulation S-X 5-03, Harvard Business School Online — How to Read Financial Statements. Accessed September 2026.] Always do your own research.
This article is for educational and informational purposes only. It is not financial advice, investment recommendation, or a solicitation to buy or sell securities. Investing involves significant risks. I am not a SEBI-registered investment advisor. Readers should consult their own financial advisor and conduct their own research before making any investment decisions.
Comments
Join the conversation
Sign in to join the conversation.
Follow replies, add your view, and take part in the discussion.
Sign in to commentLoading comments...