

Headline vs core inflation: why does the CPI number feel lower than your actual bills?
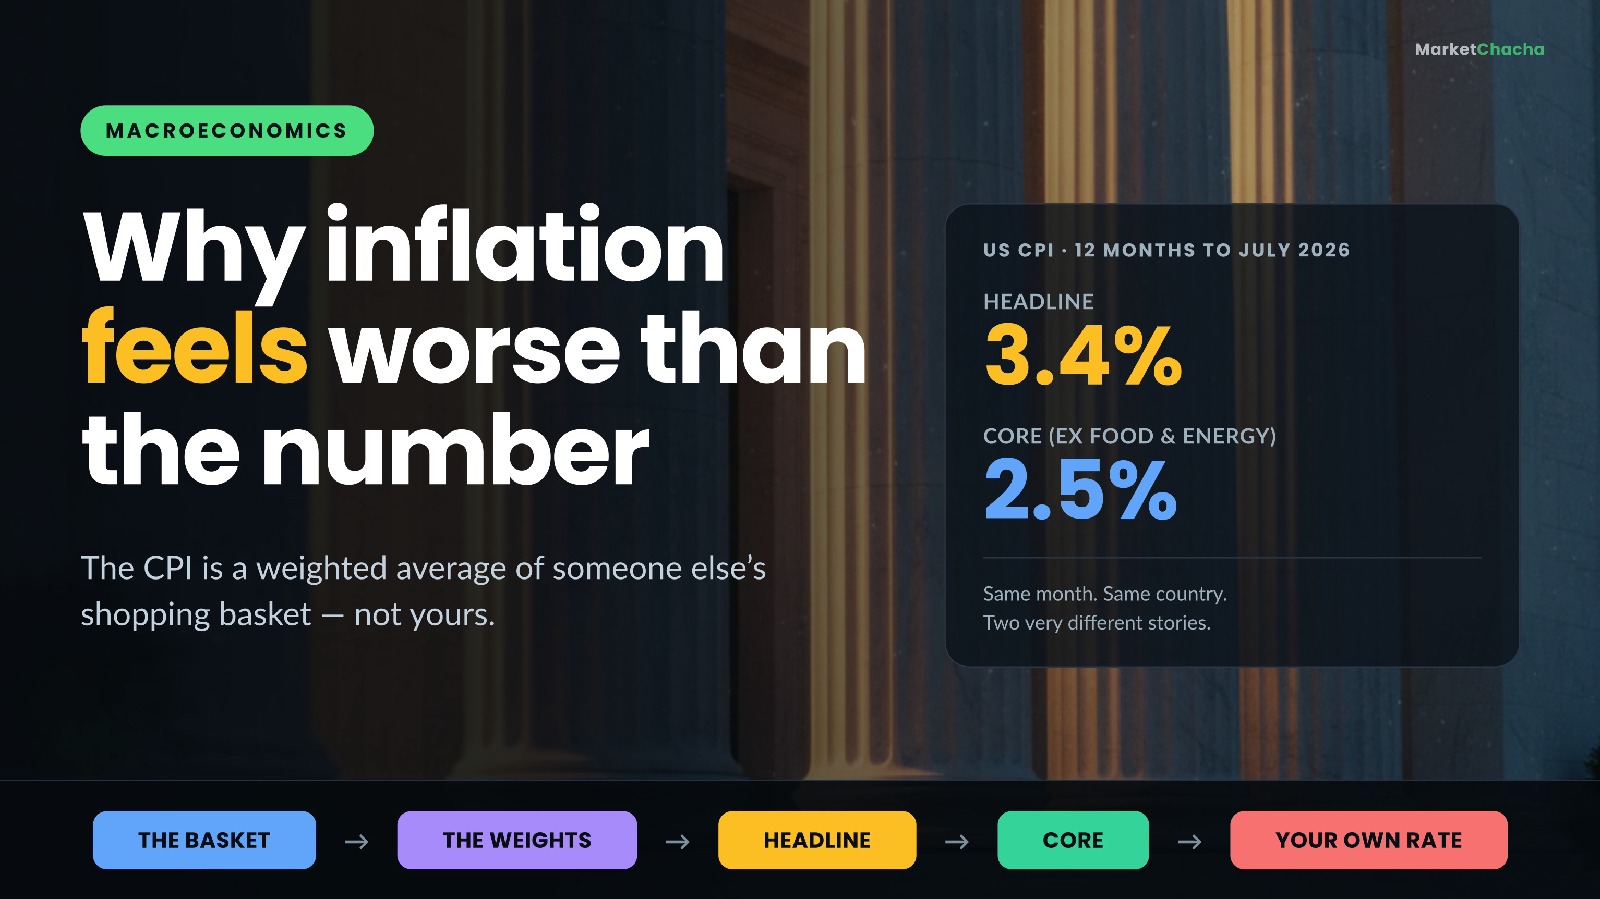
Headline inflation is the change in the price of everything in the official basket; core inflation is the same basket with food and energy taken out. Neither one is your personal inflation rate. The Consumer Price Index (CPI) is a weighted average of what a statistically average urban household buys, so if your spending looks nothing like that average — you drive a lot, you rent, you have a fixed mortgage, you have a child in daycare — your true cost of living can be a full percentage point away from the number in the news. That gap is not a conspiracy or a measurement failure. It is arithmetic, and once you can see it, the inflation report stops being confusing.
This article covers what the CPI actually measures, the difference between headline and core, a worked example showing how to compute your own rate, why shelter dominates the index, how the CPI differs from the PCE index the Federal Reserve actually targets, how to read a release in five minutes, and how all of this maps onto India's CPI.
What the CPI actually measures — and whose basket it follows
The US Bureau of Labor Statistics (BLS) defines the CPI as "a measure of the average change over time in the prices paid by consumers for a representative basket of consumer goods and services." Two words in that sentence do all the heavy lifting: average and representative.
The version quoted in the news is CPI-U, for All Urban Consumers. It covers urban households in metro areas and towns of 10,000 or more — over 90% of the US population — and excludes rural households, farm households, people on military installations and people in institutions. So before any price is collected, one group is already out of the sample.
The basket's weights come from the Consumer Expenditure Survey, in which over 20,000 households a quarter report their spending and roughly 12,000 more keep two-week purchase diaries. Those spending patterns decide how much each category counts. Critically, there is a lag: the weights applied in a given year come from survey data collected roughly two years earlier. BLS is blunt about the consequence, stating that the CPI "does not necessarily measure your own experience with price change" because it is built "on the experience of the relevant average household, not of any specific family or individual."
Headline vs core inflation: what the split really means
Headline CPI is the all-items index. Core CPI is the index for "all items less food and energy." Core is not a smaller or adjusted number by design — it is simply the same basket with two volatile categories removed.
Why remove them? Food and fuel prices are driven by weather, harvests, refinery outages, OPEC decisions and wars. They can swing 15% in a year and swing straight back, which tells a central banker almost nothing about whether inflation is embedded in wages and rents. Core is meant to reveal the underlying trend. It is a diagnostic tool, not a claim that food and fuel do not matter.
How large is the piece being removed? Using the BLS relative importance table for December 2025, food is 13.698% of the CPI-U basket and energy is 6.383%. Everything else — the core — is 79.919%. So core covers about four-fifths of what the average urban household spends.
The July 2026 report is a good illustration. Over the 12 months to July 2026, headline CPI rose 3.4% while core rose 2.5%. The wedge between them was energy, up 14.7% over the same year. Food rose 3.0% and shelter 3.2%.
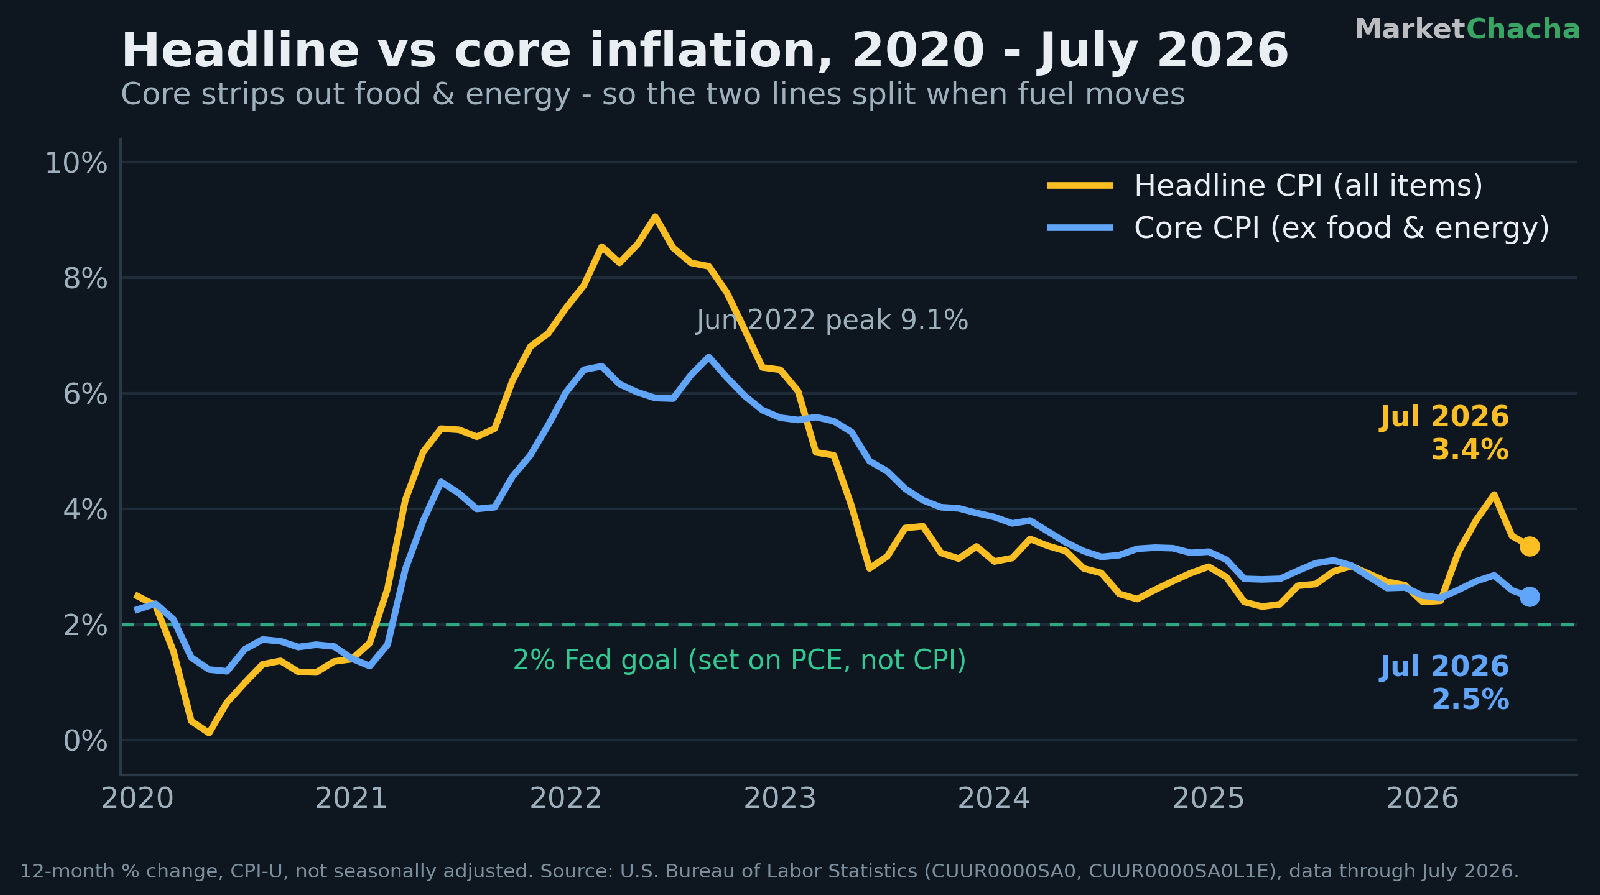
The chart shows why you should never read one line alone. In 2021 and 2022 headline ran far above core as fuel spiked, peaking at 9.1% in June 2022. Through 2023 headline fell faster than core, because energy reversed while rents and services kept climbing. And in 2026 the lines separated again in the same direction as 2021 — headline above core, energy doing the work.
Worked example: why your inflation rate is not 3.4%
The CPI is a weighted average, so you can reproduce it. Take the three July 2026 rates — food 3.0%, energy 14.7%, core 2.5% — and apply the CPI's own weights:
- Food: 13.698% × 3.0% = 0.411
- Energy: 6.383% × 14.7% = 0.938
- Everything else: 79.919% × 2.5% = 1.998
- Total: 3.347, or about 3.3%
The official headline print was 3.4%. The small gap is honest arithmetic, not error: the published index is built month by month from thousands of item indexes rather than from three rounded annual rates, and the weights shift slightly through the year. Close enough to prove the point — the headline number is just your three-line sum with the average household's weights.
Now swap in weights that look like a real household. Take someone with a long car commute and a big grocery bill, where energy is 15% of spending and food 18%:
- Food: 18% × 3.0% = 0.540
- Energy: 15% × 14.7% = 2.205
- Everything else: 67% × 2.5% = 1.675
- Personal rate: 4.420, or about 4.4%
And a homeowner with a fixed mortgage who works from home, where energy is 3% of spending and food 10%:
- Food: 10% × 3.0% = 0.300
- Energy: 3% × 14.7% = 0.441
- Everything else: 87% × 2.5% = 2.175
- Personal rate: 2.916, or about 2.9%
Same month, same country, same official statistics: 4.4% for one household and 2.9% for the other. Neither is wrong, and neither is 3.4%. This is the single most useful thing to understand about inflation data.
Shelter: the 36% of the basket that moves slowly
Housing is the largest thing in the index by a wide margin. In the December 2025 relative importance table, shelter is 35.625% of CPI-U, of which owners' equivalent rent (OER) alone is 26.204% and rent of primary residence is 7.840%. Because shelter is so heavy, it can hold the whole index up or down almost single-handedly.
OER is where most people get confused, so it is worth being exact. The CPI does not contain house prices or mortgage payments. BLS treats an owned home as a capital asset, not a consumption good — as its documentation puts it, the programme "views owned housing units as capital (or investment) goods distinct from the shelter service they provide." What it measures instead is the rental value of the shelter service the home provides, estimated from what comparable homes actually rent for.
That design has a real consequence: shelter in the CPI lags the housing market. The CPI Housing Survey splits each area's rental sample into six panels and reprices each unit only every six months, and most observations are continuing leases rather than newly signed ones. New-lease rents can turn months before the CPI shelter index reflects it. If you have just signed a new lease at a much higher rent, your housing cost jumped today while the index is still averaging in leases signed a year ago.
Why the CPI can be right and still feel wrong
Several things pull perception away from the print, and none of them require the statistics to be false.
You notice frequent purchases most. Petrol, milk, eggs and coffee are bought weekly, so you have a mental price history for them. You have no such intuition for the price of a laptop, an airline seat or a mobile phone plan, which may be flat or falling and are quietly dragging the average down.
Inflation falling does not mean prices falling. A drop from 9% to 3% means prices are still rising, just more slowly. Prices are compounding on top of the earlier increase, not returning to it. Falling prices across the economy would be deflation, which is a different and generally worse problem.
Your basket changes, the index's does not — quickly. A new baby, a new commute or a first mortgage rewrites your weights overnight. The CPI's weights are updated on a schedule, from survey data collected around two years earlier.
Quality adjustment is real but counter-intuitive. If this year's model of a product is meaningfully better than last year's for the same money, statisticians treat part of that as a price decline. That is defensible, and it also means the index can record "cheaper" for something whose sticker price did not move.
CPI vs PCE: the number the Fed actually targets
Here is a fact that reframes a lot of financial news: when the Federal Reserve says it targets 2% inflation, it does not mean the CPI. The FOMC's Statement on Longer-Run Goals defines its objective as "inflation of 2 percent over the longer run, as measured by the annual change in the price index for personal consumption expenditures" — the PCE index, published by the Bureau of Economic Analysis.
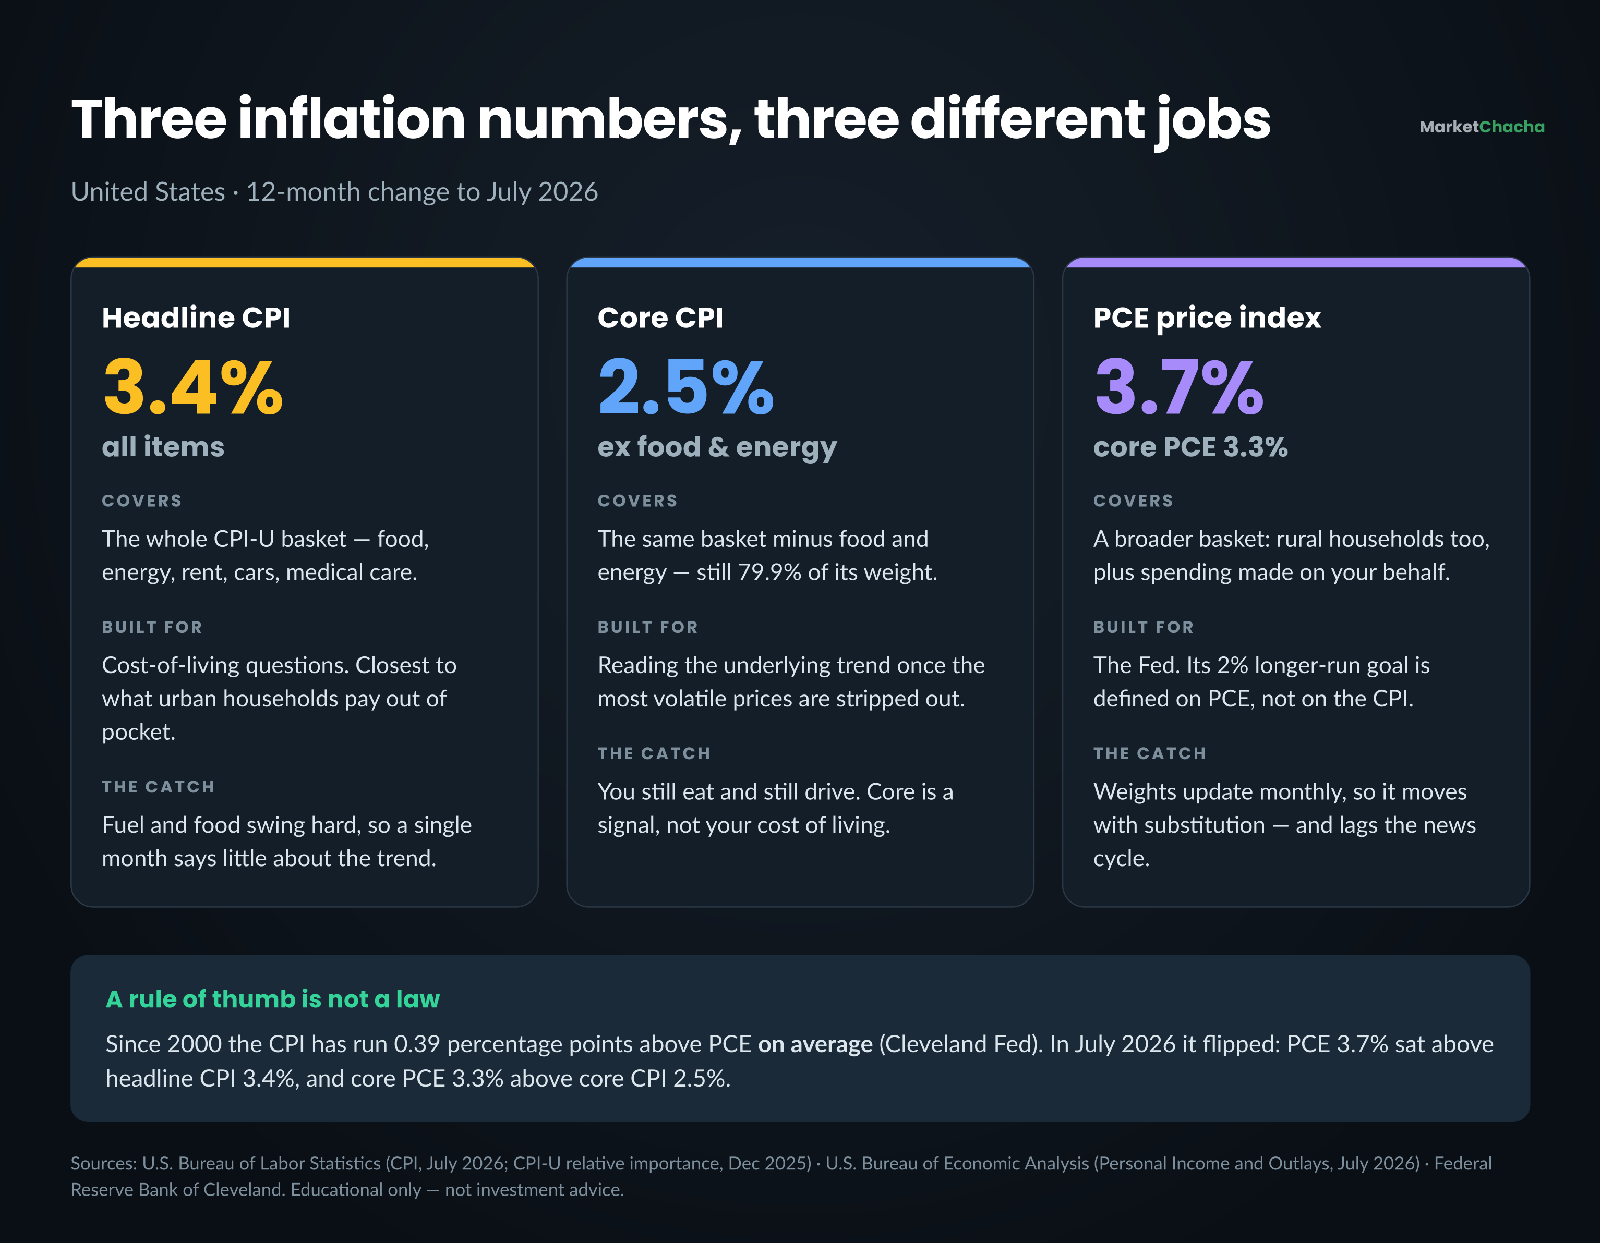
The two differ in ways that matter. The Cleveland Fed notes that the CPI is limited to "out-of-pocket spending on goods and services by urban households," while PCE "extends its coverage to rural households and includes spending on consumers' behalf, like for employer-provided health insurance, Medicare, and Medicaid." That gives healthcare a bigger weight in PCE and housing a smaller one. PCE also updates its weights monthly rather than annually, so it captures consumers substituting cheaper goods as prices rise.
Because of those differences, CPI inflation has averaged 0.39 percentage points above PCE inflation since 2000, per the Cleveland Fed. But an average is not a rule, and July 2026 is the proof: PCE rose 3.7% over the year and core PCE 3.3% (BEA, released 26 August 2026) — both above the corresponding CPI readings of 3.4% and 2.5%. If you had assumed PCE is always the lower number, you would have read that month's policy outlook backwards.
How to read an inflation report in five minutes
A repeatable routine, in order:
- Read the 12-month change and the 1-month change separately. In July 2026 the all-items index rose 0.1% on the month seasonally adjusted while the 12-month figure was 3.4%. The monthly number is the news; the annual number is the memory.
- Check headline against core. If they diverge, something in food or energy is doing the work, and it may not last.
- Look at shelter. At roughly 36% of the basket it decides most of the core number by itself.
- Find the one or two line items the release calls out — the news release names the biggest contributors explicitly. Do not infer them from the headline.
- Reweight it for yourself using the three-line sum above with your own rough shares.
- Ignore any single month as a trend. Look at three or six months of the same series before concluding anything.
What it costs you if you use the wrong number
This is not trivia. If you are negotiating a raise and quote core CPI at 2.5% while your own cost of living rose 4.4%, you have argued against yourself with official data. If you are choosing between a fixed and a variable rate, or judging whether a savings rate is beating inflation, the comparison only means something once you use a rate that reflects your spending. And if you are trying to anticipate central bank decisions, watching only the CPI while the Fed responds to PCE means watching the wrong dial — as July 2026 showed, the two can point different ways in the same month.
Common mistakes beginners make
- Treating the CPI as your personal cost of living. It is an average across a population you are not identical to.
- Thinking core inflation is the "real" number. Core is a trend-spotting tool. Headline is closer to what you actually pay.
- Believing falling inflation means falling prices. It means slower increases from a higher base.
- Assuming house prices are in the CPI. They are not; owners' housing enters as an estimated rental value.
- Reacting to one month's print. Monthly numbers are noisy and frequently revised in seasonal factors.
- Assuming the Fed targets the CPI. Its 2% goal is defined on PCE.
- Assuming PCE always runs below CPI. That is a long-run average, and it can flip.
How this works in India
India runs the same machinery with a very different basket. The Ministry of Statistics and Programme Implementation (MoSPI) publishes the all-India CPI, and in 2026 it moved the index to a new 2024=100 base series, with back-series data released in February 2026. That revision changed the weights substantially: Food and Beverages fell from 45.86% under the 2012 series to 36.75% under the 2024 series, while housing (now including water, electricity, gas and other fuels under the COICOP 2018 framework) rose from 10.07% to 17.67%, and Fuel and Light fell from 6.84% to 5.49%. Part of that shift is genuine change in consumption and part is reclassification — MoSPI notes food would have been 40.10% on the old structure — so comparisons across the two series need care.
The practical difference from the US is the weight of food. Even after the revision, food is roughly 37% of the Indian basket against under 14% in the US CPI-U, while shelter is about 36% of the US basket. That is why a monsoon failure or a vegetable price shock moves the Indian headline number far more violently than it would in America, and why the gap between headline and "core" is often wider and noisier in India.
One important nuance: MoSPI does not publish an official "core inflation" series the way BLS publishes all-items-less-food-and-energy. Indian core inflation — usually CPI excluding food and fuel — is computed by economists, the RBI's research and brokerages, so different houses can quote slightly different core numbers for the same month. Always check what a given "core" figure excludes.
For July 2026, MoSPI reported all-India CPI inflation of 4.45% year-on-year with food inflation at 5.52% (provisional, released 12 August 2026). India's monetary policy framework targets CPI inflation of 4% with a tolerance band of 2% to 6%, a target retained in the most recent review — so unlike the Fed, the RBI's target is defined on the headline consumer price index itself, not on a separate deflator. When you read "RBI is comfortable on inflation", it is this CPI number they mean.
FAQ
What is the difference between headline and core inflation? Headline inflation covers every item in the official basket. Core inflation is the same basket with food and energy removed, because those two categories are volatile enough to hide the underlying trend. In the US, core still covers about 80% of the basket by weight.
Why is my personal inflation rate higher than the CPI? Because the CPI weights each category by what an average urban household spends, not what you spend. If you spend a much larger share on the categories rising fastest — fuel, food, rent — your own rate will be higher. Using July 2026 US data, a heavy-commuting household worked out at roughly 4.4% against a 3.4% headline.
Does the CPI include house prices or mortgage payments? No. BLS treats a home as an investment asset rather than a consumption item, so the CPI measures the rental value of the shelter a home provides — owners' equivalent rent — instead of the purchase price or the mortgage.
Does the Federal Reserve target the CPI? No. The FOMC's 2% longer-run goal is defined on the PCE price index published by the Bureau of Economic Analysis. The CPI and PCE cover different spending and use different weighting, so they routinely differ — in July 2026 PCE was 3.7% while headline CPI was 3.4%.
If inflation is falling, why are prices still going up? Falling inflation means prices are rising more slowly than before, not that they are coming down. A move from 9% to 3% still adds 3% on top of everything the earlier 9% already added. Prices actually falling across the economy would be deflation.
What does India's CPI measure and how is it different? MoSPI publishes India's CPI, now on a 2024=100 base. Food and beverages carry about 37% of the weight against under 14% in the US, so food shocks move India's headline number far more. India also has no official core series — core there is computed by analysts, usually as CPI excluding food and fuel.
Educational content only — not investment, tax or insurance advice, and not a recommendation of any product. Rates, fees and rules change — always check current terms with the provider. Data as of the July 2026 reference month. [Sources: U.S. Bureau of Labor Statistics — Consumer Price Index Summary, July 2026, BLS — CPI-U relative importance, December 2025, BLS — Rent and Rental Equivalence, BLS — CPI Questions and Answers, U.S. Bureau of Economic Analysis — Personal Income and Outlays, July 2026, Federal Reserve — Why 2 percent inflation?, Federal Reserve Bank of Cleveland — CPI versus PCE, MoSPI — CPI press release, July 2026 and CPI 2024 series FAQ] Always do your own research.
This article is for educational and informational purposes only. It is not financial advice, investment recommendation, or a solicitation to buy or sell securities. Investing involves significant risks. I am not a SEBI-registered investment advisor. Readers should consult their own financial advisor and conduct their own research before making any investment decisions.
Comments
Join the conversation
Sign in to join the conversation.
Follow replies, add your view, and take part in the discussion.
Sign in to commentLoading comments...