

What are support and resistance levels — and how do you actually use them?
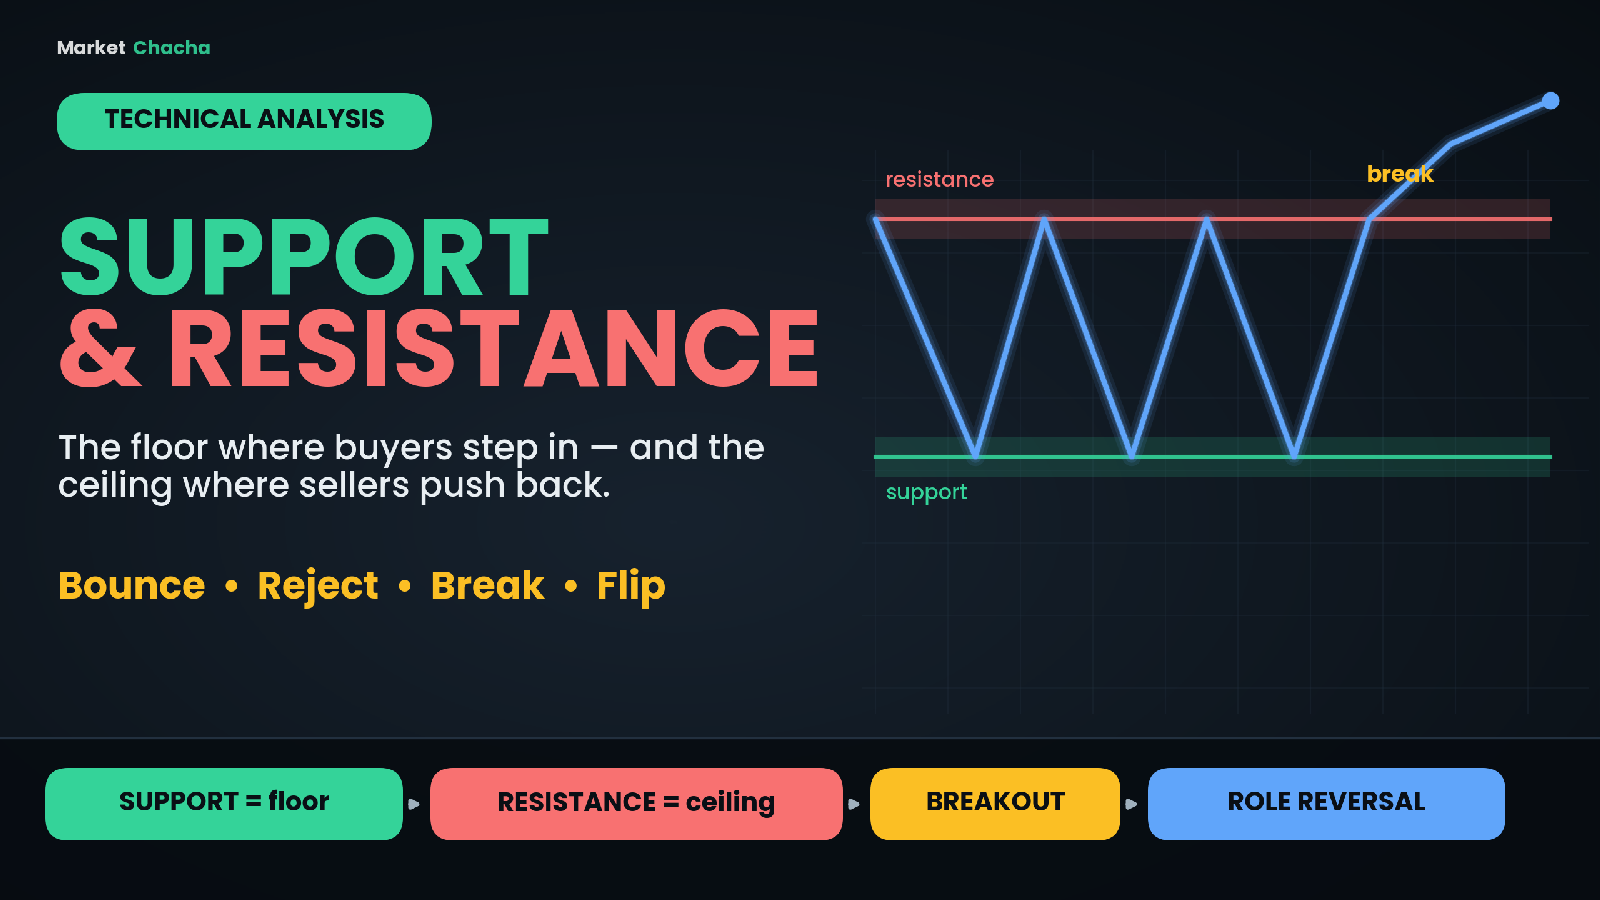
Support is a price zone where a falling market tends to stop and turn back up, because buyers step in faster than sellers can push the price down. Resistance is the opposite: a price zone where a rising market tends to stall and turn back down, because sellers take over from buyers. Put simply, support is the floor of a price range and resistance is the ceiling — and almost every other tool in technical analysis, from trendlines to breakouts, is built on top of these two ideas.
This guide explains what support and resistance really are, why they form, how to read them with a worked example, the powerful "role reversal" idea, how to tell a real breakout from a fakeout, how to draw them step by step, the mistakes beginners make, and how Indian traders apply the same concept to the Nifty and Sensex.
What support and resistance actually mean
A market is just an ongoing auction between buyers and sellers. Support marks a level where demand has repeatedly been strong enough to halt a decline — buyers consider the price "cheap" and step in, so the fall pauses and often reverses. Resistance marks a level where supply has repeatedly been strong enough to cap a rally — sellers consider the price "expensive" and offload, so the rise stalls and often reverses.
The crucial word is repeatedly. A single turning point is just a turning point. A level becomes meaningful support or resistance when price has reacted to it more than once, because that shared history is what makes traders watch it and act on it the next time price returns.
Why these levels form: supply, demand and memory
Support and resistance are really pictures of where buy and sell orders pile up. But there is also a human, psychological layer. Every time price visits a level, it splits traders into three groups: those who bought there, those who sold there, and those who watched and missed the move. Each group creates future orders. Buyers who bought at support want to add more if price returns; sellers who sold at resistance are relieved to see it come back so they can sell again; and those who missed out wait for a "second chance" at the same price. All three sets of orders cluster around the old level and tend to produce the same reaction again. That collective memory is why levels keep working until they don't.
Round numbers amplify this. Prices ending in round figures — 100, 500, 1,000, or a big index level like 24,000 — attract disproportionate attention simply because they are easy to remember and become informal targets. That is why round numbers so often act as psychological support or resistance even with no other reason behind them.
A worked example: reading a range on a chart
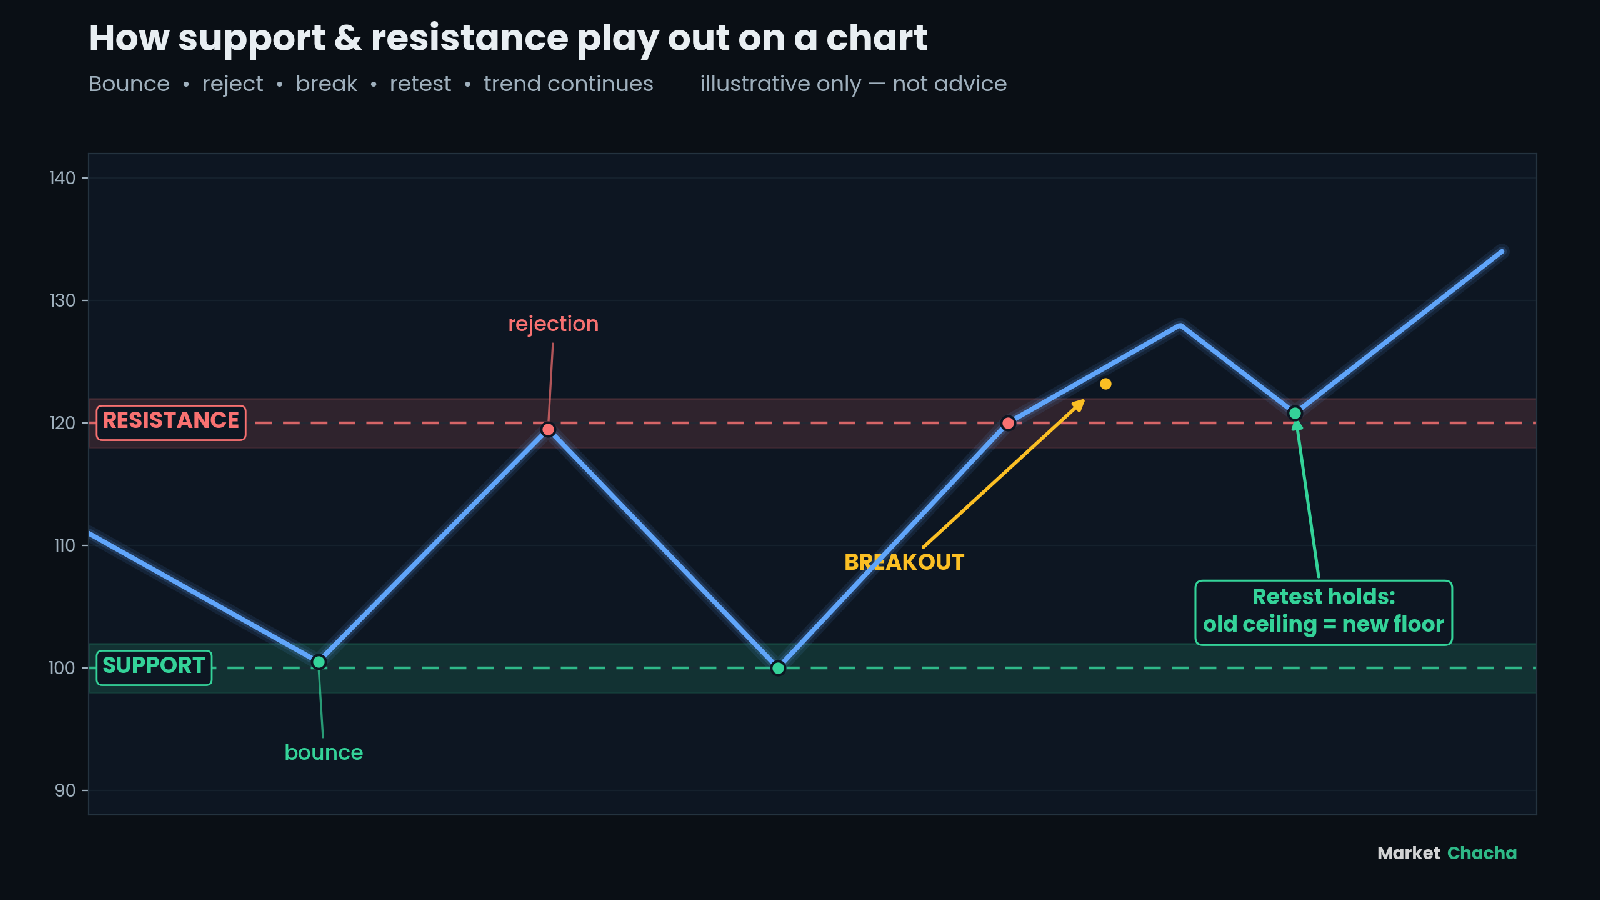
Imagine a stock that keeps trading between two levels. Every time it falls to around 100, buyers appear and it bounces. Every time it climbs to around 120, sellers appear and it drops back. After a couple of round trips, you can confidently mark support at 100 and resistance at 120 — the stock is "range-bound" between a floor and a ceiling.
Now watch what a trader does with that map. Near the floor, price at 101 offers a defined idea: if you expect the 100 support to hold, your "I'm wrong" level sits just below the zone, say 97. Risking about 4 points (101 down to 97) to aim for the 119 area near resistance is roughly an 18-point reward — a favourable ratio if the level holds. The point is not the trade; it is that support and resistance let you define risk and reward in advance instead of guessing.
Eventually the stock pushes through 120, closes above 122, pulls back to about 120, holds there, and then continues higher toward 134. That sequence — bounce, reject, bounce, break, retest, trend — is the everyday grammar of price. The chart below shows exactly this play unfolding.
Support and resistance are zones, not exact lines
Beginners draw a single, perfect line and then get frustrated when price pokes through it by a rupee or a dollar and reverses anyway. In reality, support and resistance are zones, not precise prices. Big buyers and sellers do not all act at one identical number, and prices routinely overshoot a level on a spike (a "wick") before snapping back. Treat a level as a band a few percent wide, and draw it with a rectangle rather than a hairline. If price dips into the zone and recovers, the level did its job — it did not "fail" just because it was not touched to the exact tick.
Role reversal: the polarity principle
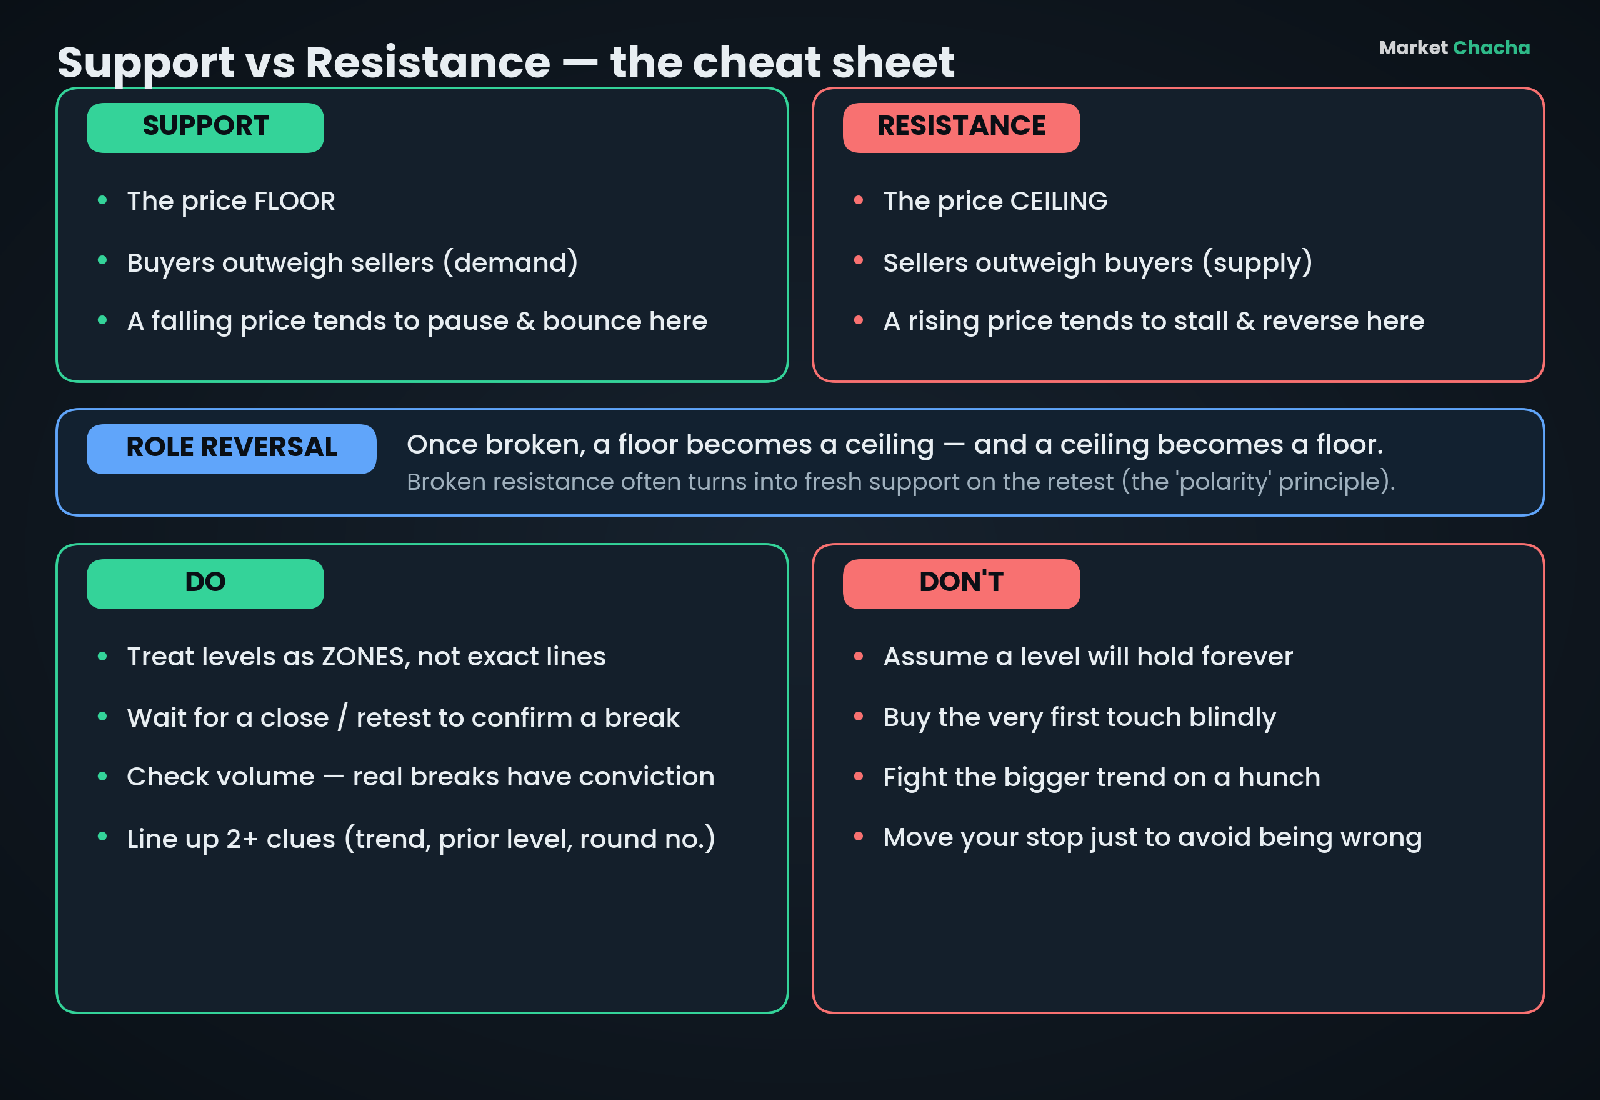
The single most useful idea in this whole topic is role reversal, also called the principle of polarity: once a level is decisively broken, it flips roles. Broken resistance tends to become new support, and broken support tends to become new resistance.
The reason is again memory. When price finally closes above a ceiling it had been rejected at, everyone who sold there now watches it turn into a floor — some who sold want to buy back, some who missed the breakout want in, and buyers defend the level to protect their new position. So when price falls back to the old ceiling, fresh demand appears and it holds as support. In the worked example, resistance at 120 became support at 120 after the breakout. When you see price break a level and then come back to "kiss" it and hold, that retest is polarity in action — and it is one of the more reliable behaviours in technical analysis.
Breakouts vs fakeouts: when a level gives way
Levels do not last forever. When something changes — news, earnings, a shift in the bigger trend — buyers become willing to pay up through resistance, or sellers dump through support, and the level breaks. The hard part is telling a genuine breakout from a fakeout (a false break that quickly reverses and traps everyone who chased it).
Two habits help. First, wait for a close beyond the zone rather than a brief intraday poke; a candle that pierces resistance but closes back inside the range is a warning, not a breakout. Second, look for conviction — real breaks are often accompanied by a jump in volume, showing that many participants agree. A break on thin volume that immediately fades is the classic fakeout. Many traders sidestep the whole problem by waiting for the retest: let price break out, come back to the level, and only act once the old level proves it now holds in its new role.
How to actually draw and use support and resistance (step by step)
You do not need indicators — just price and patience.
- Zoom out first. Start on a higher timeframe (daily or weekly). The levels that matter are visible from far away, not the tiny wiggles.
- Mark the obvious turns. Find the prices where the chart clearly reversed more than once. Ignore the noise; you want the levels a stranger would also circle.
- Draw zones, not lines. Use a rectangle covering the cluster of highs or lows, so small overshoots still count.
- Look for confluence. A level is stronger when more than one thing points to it — a prior swing, a round number, a moving average, or a trendline all landing together.
- Wait for a reaction. Let price come to your level and show its hand (a bounce, a rejection candle, a failed break) before doing anything.
- Define invalidation. Decide in advance the point at which the level is clearly broken, so you are never guessing in the moment.
The cheat sheet below sums up the do's and don'ts.
Common mistakes beginners make
- Drawing too many levels. If everything is support, nothing is. Keep only the handful of levels that clearly mattered.
- Treating a level as an exact price. Expecting a to-the-tick reaction leads to being stopped out by normal overshoot. Think zones.
- Ignoring the bigger trend and timeframe. Support is far more likely to hold in an uptrend than in a falling market. A daily level outranks a 5-minute one.
- Assuming a level holds forever. Every level eventually breaks. Support and resistance describe probabilities, not guarantees.
- Front-running the touch. Buying before price even reaches support, or chasing the first poke through resistance, skips the confirmation that makes the idea work.
- Moving your stop to avoid being wrong. Shifting your invalidation level just because price is testing it defeats the entire purpose of drawing the level.
How Indian traders use support and resistance
The concept is identical on the NSE and BSE — only the round numbers change. On the Nifty 50 and Sensex, large round figures act as powerful psychological levels: index milestones such as a round thousand on the Nifty or a round ten-thousand on the Sensex draw huge attention and often become short-term support or resistance simply because everyone is watching them. Index-heavy names and Bank Nifty behave the same way around their own round levels.
Indian intraday traders also lean on pivot points — support and resistance levels calculated from the previous session's high, low and close — which are just a formula-based way of estimating where today's floors and ceilings might sit. Whether you draw zones by eye or use pivots, the underlying logic is the same: find where buyers and sellers have repeatedly changed the direction of price, treat those areas as zones, and wait for price to show you a reaction before you act.
FAQ
What is the difference between support and resistance in simple terms? Support is the floor where a falling price tends to stop because buyers step in; resistance is the ceiling where a rising price tends to stall because sellers step in. Support sits below the current price, resistance above it.
How do I identify support and resistance levels on a chart? Zoom out to a daily or weekly chart and mark the prices where the market clearly reversed direction more than once. Draw those areas as zones (rectangles), not exact lines, and keep only the levels that obviously mattered.
Why does resistance become support after a breakout? Because of trader memory, or "polarity". Once price closes above an old ceiling, the people who sold there and those who missed the move create buying interest when price returns, so the old resistance holds as new support on the retest.
Is a breakout always real? No. A false break, or "fakeout", pierces a level briefly and then reverses, trapping traders who chased it. Waiting for a close beyond the level, a pickup in volume, or a successful retest helps separate a genuine breakout from a fakeout.
Should support and resistance be a line or a zone? A zone. Large buyers and sellers do not all act at one exact price, and prices routinely overshoot before reversing, so a band a few percent wide is far more realistic than a single hairline.
Do support and resistance work on the Nifty and Sensex? Yes — the concept is the same on any market. On Indian indices, big round numbers are especially strong psychological levels, and many intraday traders also use pivot points derived from the previous day's range.
Educational content only — not investment advice, and not a recommendation of any stock, index or strategy. Chart levels shown are illustrative. Markets are probabilistic and any level can break — always do your own research. [Sources: Investopedia, All Star Charts (principle of polarity), Vantage Markets Academy].
This article is for educational and informational purposes only. It is not financial advice, investment recommendation, or a solicitation to buy or sell securities. Investing involves significant risks. I am not a SEBI-registered investment advisor. Readers should consult their own financial advisor and conduct their own research before making any investment decisions.
Comments
Join the conversation
Sign in to join the conversation.
Follow replies, add your view, and take part in the discussion.
Sign in to commentLoading comments...