

Polycab India (POLYCAB): the full file — the numbers, the owners, and what the filings actually show
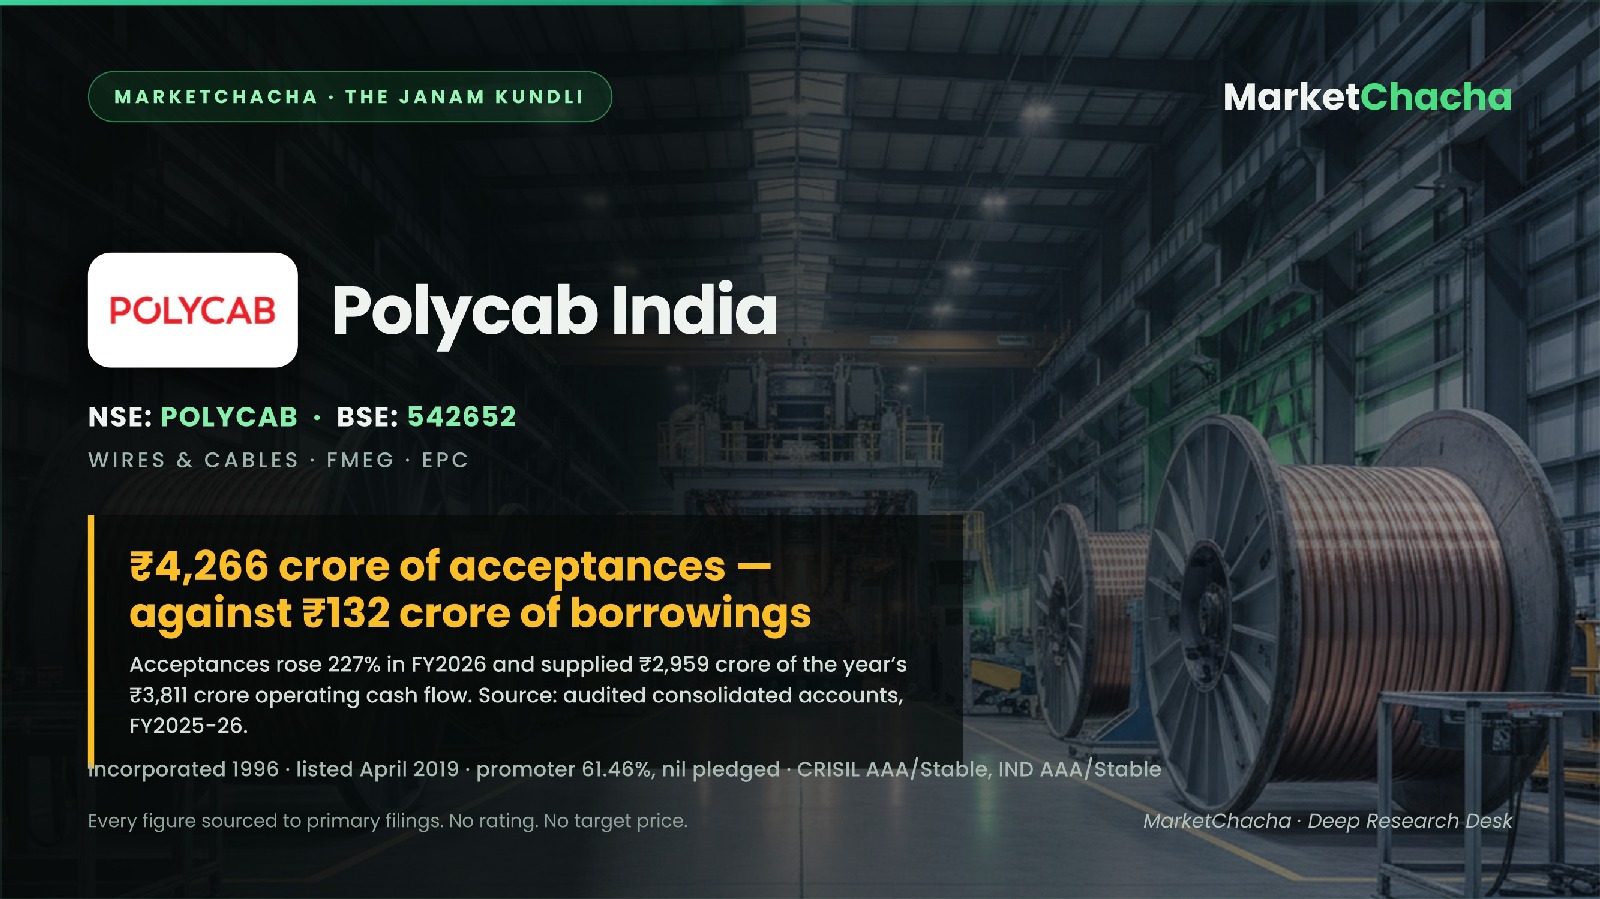
Polycab India makes wires and cables — about 87% of revenue — plus a consumer electricals range (fans, switches, lighting, pumps, solar) and a turnkey EPC business, and it sells almost all of it through roughly 3,900 dealers and distributors inside India. It is a 30-year-old family-controlled manufacturer that listed in 2019 and has compounded revenue at 26.9% a year over the last five. The record, stated neutrally: the accounts are audited without qualification, no promoter share is pledged, there is no offshore holding vehicle anywhere in the group, and the single biggest number that moved in FY2026 was not profit — it was a ₹2,959 crore increase in bank-settled trade payables called acceptances, which supplied 78% of the year's operating cash flow.
Origin — the company's birth certificate
Polycab was incorporated on 10 January 1996 in Mumbai as Polycab Wires Private Limited, converted to a public limited company on 29 August 2018 and was renamed Polycab India Limited by fresh certificate dated 13 October 2018. The CIN in the 2018 prospectus was U31300DL1996PLC266483, registered in New Delhi; today it is L31300GJ1996PLC114183, registered at Halol, Panchmahal, Gujarat. The date of that shift we could not pin down.
The promoters are the four Jaisinghani brothers — Inder T., Ajay T., Ramesh T. and Girdhari T. Before listing, the International Finance Corporation held 15%. Polycab listed on 16 April 2019 at ₹538 and closed its first day at ₹655. The FY2025-26 report is its 30th.
The business — what they actually sell
Three reported segments. Wires & Cables did ₹25,179 crore of external sales in FY2026 (87.1% of the total), up 33.3%, at a 13.6% segment margin. FMEG — fans, LED lighting, switches, switchgear, solar products, pumps, conduits, appliances — did ₹2,069 crore, up 25.1%, and swung from a ₹39 crore segment loss in FY2025 to a ₹55 crore profit. EPC, which designs and commissions projects on a turnkey basis, did ₹1,666 crore, down 13.2%, at a ₹166 crore result.
The mix is overwhelmingly domestic: revenue from customers outside India was ₹1,569 crore — 5.4% of the total, down from 6.0%, because domestic revenue grew 29.5% against exports' 16.7%. Within the export book the company reports North America 39%, South America 21%, Europe 16%, Middle East 16%.
Who actually buys from them
Unusually for an Indian manufacturer, Polycab discloses this. Its BRSR states that 80.16% of sales go to dealers and distributors (FY2025: 78.04%), that it sells through 3,915 dealers and distributors — down from 4,308 a year earlier — and that the top 10 of them account for 25.09% of dealer sales, up from 21.85%. So the channel is getting narrower and slightly more concentrated at the top, while total sales grew 29%. A benign reading: consolidating small dealers into larger ones is a common distribution strategy, and revenue per dealer rose sharply.
On the direct-customer question the accounts are explicit: "No single customer contributed 10% or more to the Group's revenue for the year." On the purchase side, purchases from trading houses were 3.81% of total purchases across 54 trading houses, with the top 10 of those accounting for 89.37%.
Where it is actually made — plants and supply chain
Polycab reports 26 manufacturing facilities and 35 warehouses and depots. The annual report names capacities at five clusters: Halol and Daman (wires and cables 6 million km, fans 6 million units, switches 10 million units, pipes and conduits 24,600 MT, metal boxes 3.6 million units), Roorkee (fans, 3 million units), Nashik (switchgears, 24.4 million units), Chennai (pipes and conduits, 4,800 MT) and Bangalore (metal boxes, 1.5 million units).
What is not disclosed: a plant-by-plant list of all 26 sites, the identity of any raw-material supplier, or any single-source dependency. Copper and aluminium dominate a cable maker's input cost and move the gross margin, but Polycab names no suppliers and does not split domestic from imported metal. That is a real gap, and Indian disclosure rules do not compel otherwise.
Five years of numbers
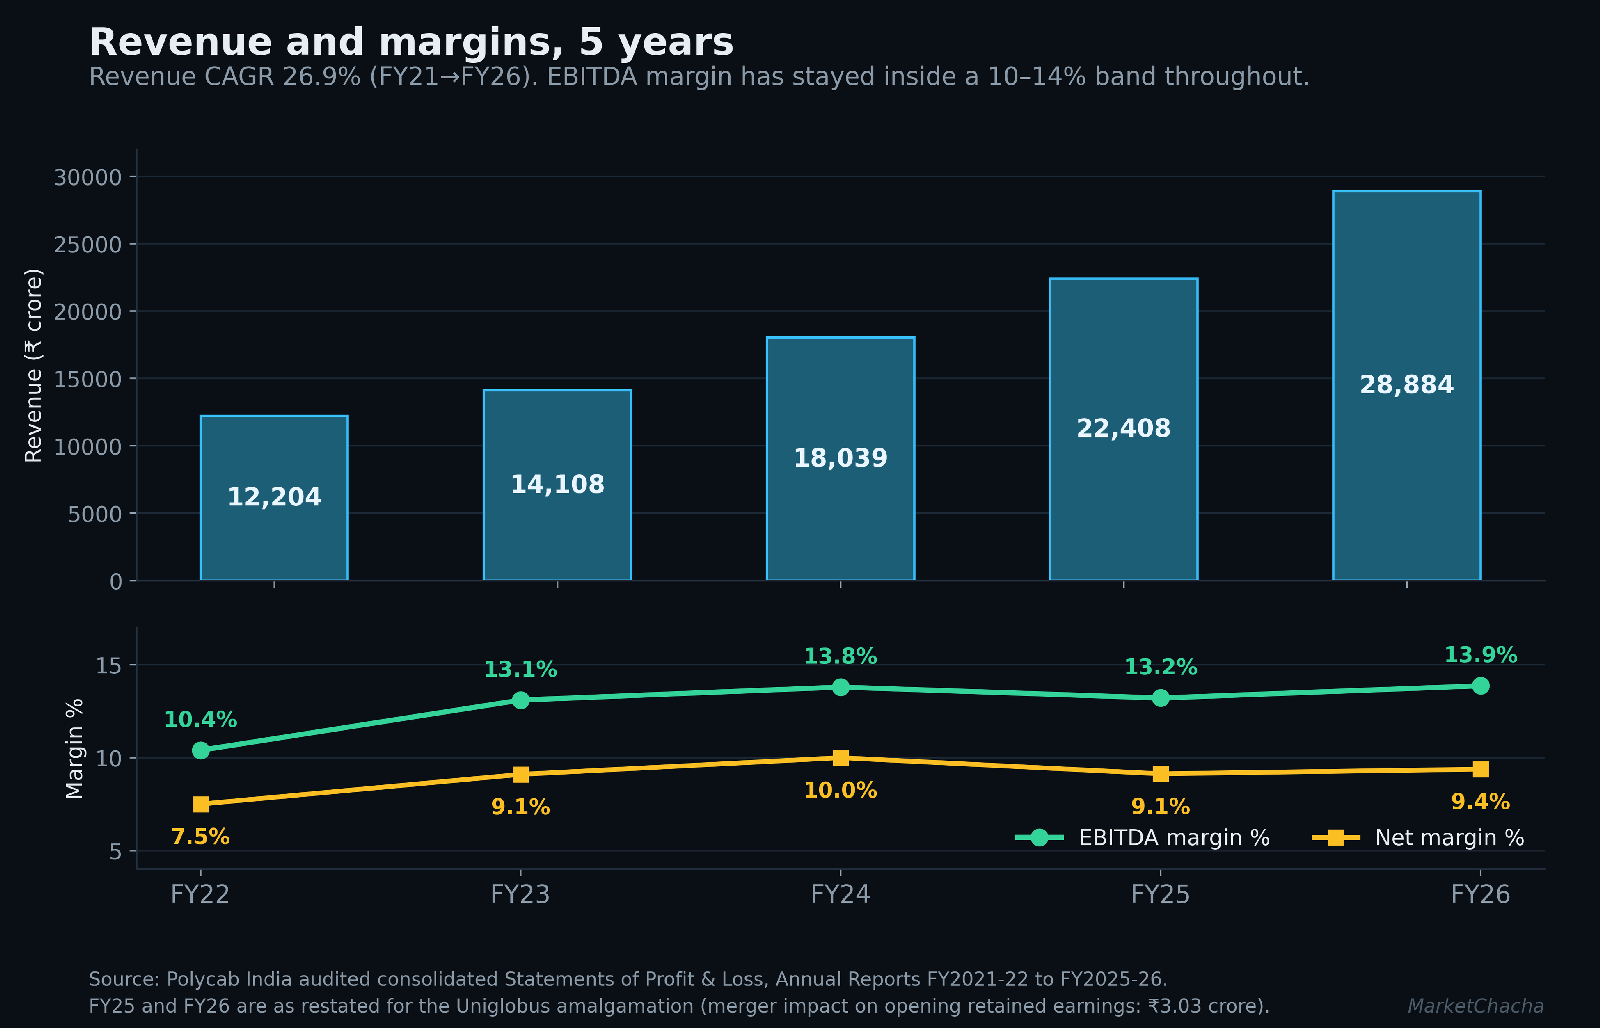
Polycab grew revenue from ₹8,792 crore in FY2021 to ₹28,884 crore in FY2026 — a 26.9% CAGR. Profit after tax went ₹886 crore to ₹2,708 crore, a 25.0% CAGR; EPS ₹59.15 to ₹177.53, a 24.6% CAGR. The share closed at ₹2,505.75 on 17 September 2021 and at ₹8,322.45 on 18 September 2026 — a five-year return of +232.1%, a 27.13% CAGR, almost exactly matching the revenue CAGR. From the ₹538 IPO price it is +1,447% over 7.42 years, a 44.6% CAGR. At ₹8,322 the stock trades at roughly 43.9x trailing earnings and 10.4x a book value of ₹798. KEI Industries is at 43.7x and 6.5x book; Havells at 41.2x and 7.3x. Polycab's ROCE is 33.2% against KEI's 20.0% and Havells' 24.9%.
Income statement, FY2026 vs FY2025 (consolidated, ₹ crore)
| Line | FY2026 | FY2025 | Change | % |
|---|---|---|---|---|
| Revenue from operations | 28,883.79 | 22,408.31 | +6,475.48 | +28.90% |
| Cost of materials + stock-in-trade + inventory change | 20,586.96 | 15,573.15 | +5,013.81 | +32.19% |
| Project bought-outs & subcontracting | 994.64 | 1,256.89 | −262.25 | −20.86% |
| Employee benefits | 879.42 | 736.73 | +142.69 | +19.37% |
| Other expenses | 2,417.04 | 1,881.31 | +535.73 | +28.48% |
| EBITDA | 4,005.73 | 2,960.24 | +1,045.49 | +35.32% |
| EBITDA margin | 13.87% | 13.21% | +66 bps | — |
| Other income | 236.25 | 207.64 | +28.61 | +13.78% |
| Finance costs | 243.04 | 168.93 | +74.11 | +43.87% |
| Depreciation & amortisation | 385.87 | 298.10 | +87.77 | +29.44% |
| Profit before tax | 3,613.08 | 2,700.85 | +912.23 | +33.78% |
| Tax (effective rate) | 904.65 (25.04%) | 655.31 (24.26%) | +249.34 | +38.05% |
| Profit for the year | 2,708.43 | 2,045.54 | +662.89 | +32.41% |
| Net margin | 9.38% | 9.13% | +25 bps | — |
| EPS, basic (₹) | 177.53 | 134.34 | +43.19 | +32.15% |
Balance sheet, FY2026 vs FY2025 (₹ crore)
| Line | FY2026 | FY2025 | Change | % |
|---|---|---|---|---|
| Net worth (owners) | 12,008.58 | 9,828.06 | +2,180.52 | +22.19% |
| Borrowings (current + non-current) | 132.49 | 109.00 | +23.49 | +21.55% |
| Acceptances | 4,265.62 | 1,306.24 | +2,959.38 | +226.56% |
| Trade payables | 1,798.81 | 1,429.52 | +369.29 | +25.83% |
| Other current liabilities | 1,287.11 | 307.55 | +979.56 | +318.50% |
| Inventories | 5,559.60 | 3,661.30 | +1,898.30 | +51.85% |
| Trade receivables (current + non-current) | 4,206.29 | 2,895.71 | +1,310.58 | +45.26% |
| Current investments | 3,404.82 | 1,749.04 | +1,655.78 | +94.67% |
| Property, plant & equipment | 3,505.07 | 2,791.33 | +713.74 | +25.57% |
| Capital work-in-progress | 1,139.26 | 708.14 | +431.12 | +60.88% |
| Total assets | 20,476.19 | 13,775.77 | +6,700.42 | +48.64% |
Four lines moved more than 40%: acceptances (+227%), other current liabilities (+319%), current investments (+95%), CWIP (+61%), with inventories (+52%) and receivables (+45%) just behind. Note also that FY2025 is presented restated for the Uniglobus amalgamation; the merger's impact on opening retained earnings was ₹3.03 crore, so the restatement is immaterial to the comparison.
Cash flow, FY2026 vs FY2025 (₹ crore)
| Line | FY2026 | FY2025 | Change |
|---|---|---|---|
| Operating profit before working-capital changes | 4,088.64 | 3,051.63 | +1,037.01 |
| Net working-capital movement | +604.99 | −609.95 | +1,214.94 |
| Income tax paid | −882.96 | −633.15 | −249.81 |
| Net cash from operations | 3,810.67 | 1,808.53 | +2,002.14 |
| Net cash used in investing | −2,849.71 | −1,239.31 | −1,610.40 |
| Net cash used in financing | −799.04 | −628.28 | −170.76 |
| Capex (PPE + intangibles + investment property) | 1,489.81 | 972.44 | +517.37 |
| Free cash flow (CFO − capex) | 2,320.86 | 836.09 | +1,484.77 |
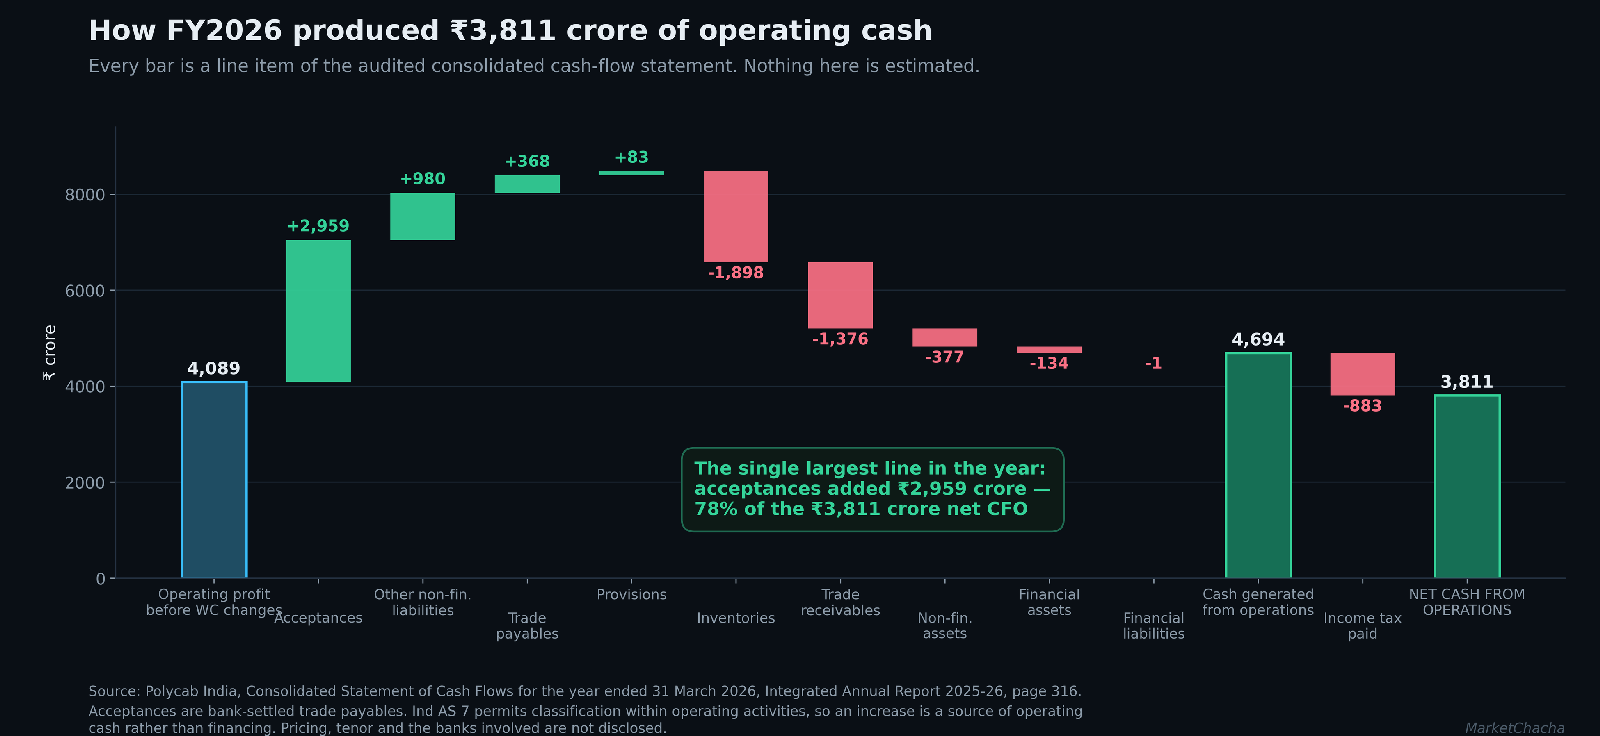
What drove it. Operating profit before working capital rose 34%, broadly tracking EBITDA. The rest is working capital, which swung from a ₹610 crore drain to a ₹605 crore source — a ₹1,215 crore reversal, inside which inventories consumed ₹1,898 crore and receivables ₹1,376 crore while acceptances contributed ₹2,959 crore and other non-financial liabilities ₹980 crore. On earnings quality: the PBT increase is almost entirely operating — EBITDA added ₹1,045 crore of the ₹912 crore gain, with depreciation and finance costs taking some back; other income added only ₹29 crore and was 6.5% of PBT (FY2025: 7.7%). The profit is clean; it is the cash line that carries the caveat.
The latest quarter, decoded
| ₹ crore | Q1 FY27 (Jun-26) | Q4 FY26 (Mar-26) | QoQ | Q1 FY26 (Jun-25) | YoY |
|---|---|---|---|---|---|
| Revenue from operations | 8,209.73 | 8,864.48 | −7.39% | 5,905.98 | +39.01% |
| Total material cost | 6,252.01 | 6,786.75 | −7.88% | 4,318.78 | +44.76% |
| Employee benefits | 261.48 | 193.10 | +35.41% | 218.90 | +19.45% |
| Advertisement & sales promotion | 32.82 | 51.98 | −36.86% | 15.02 | +118.58% |
| EBITDA | 1,136.20 | 1,161.31 | −2.16% | 857.60 | +32.49% |
| EBITDA margin | 13.84% | 13.10% | — | 14.52% | — |
| Other income | 104.92 | 60.42 | +73.65% | 79.95 | +31.23% |
| Finance costs | 80.02 | 74.64 | +7.21% | 51.26 | +56.12% |
| Depreciation & amortisation | 102.87 | 97.80 | +5.19% | 85.70 | +20.03% |
| Profit before tax | 1,058.22 | 1,049.29 | +0.85% | 800.59 | +32.18% |
| Profit for the period | 796.65 | 785.60 | +1.41% | 599.70 | +32.84% |
| EPS, basic (₹) | 52.09 | 52.18 | −0.17% | 39.36 | +32.34% |
The decode. Year on year the quarter is strong and clean: revenue +39%, EBITDA +32%, PAT +33%, margin down 68 basis points. Quarter on quarter the bridge reconciles exactly and says something different. EBITDA fell ₹25.1 crore, depreciation cost ₹5.1 crore and finance costs ₹5.4 crore; against that, other income rose ₹44.5 crore, or 73.7%. Those four sum to +₹8.9 crore — precisely the reported PBT increase. The entire quarter-on-quarter rise in pre-tax profit came from non-operating income; operating earnings fell. EPS slipped 0.17% despite PAT rising 1.41%, on minority interests and ESOP dilution.
By segment: Wires & Cables fell 7.2% QoQ at a stable 13.3% margin; EPC fell 39.6% QoQ and 11.4% YoY; FMEG rose 14.8% QoQ and 67.6% YoY with margin moving 2.10% → 4.41% → 7.97%. The benign reading of the other-income line: the treasury book nearly doubled during FY2026, so finance income of ₹90.5 crore against ₹49.8 crore is what a larger cash pile mechanically produces. It is still not operating profit.
Who owns it — and where those owners are registered
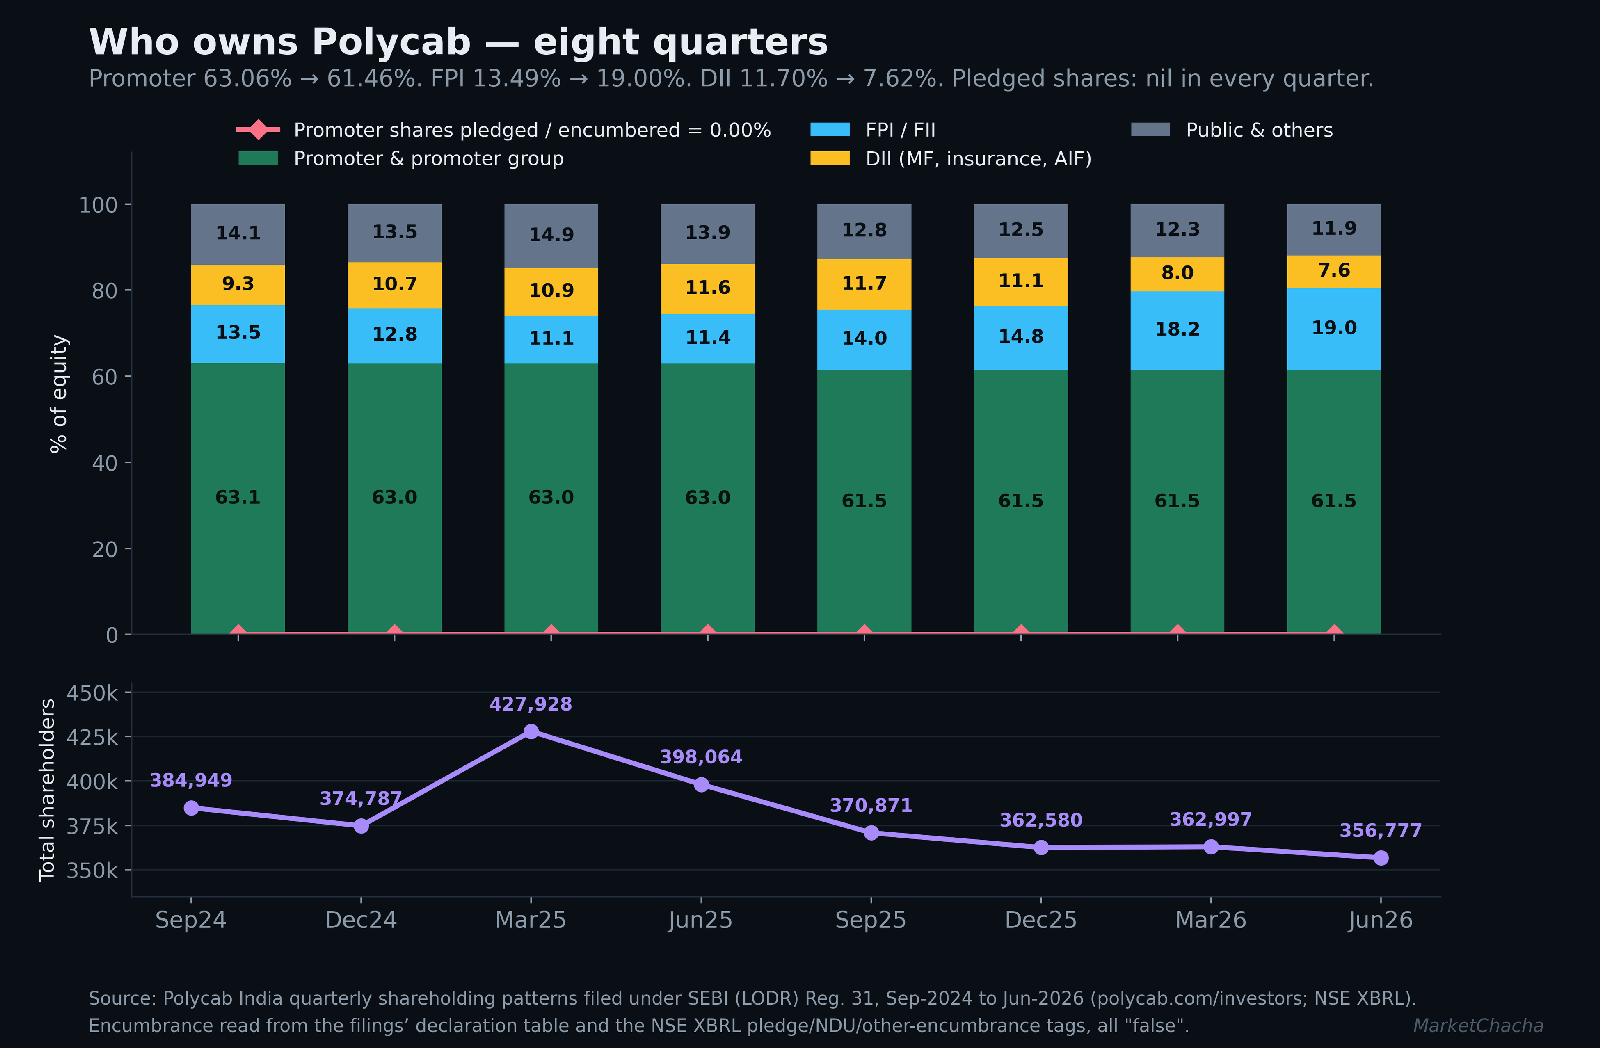
At 30 June 2026 the promoter and promoter group held 9,25,82,842 shares, 61.46%, across 31 holders, down from 68.60% at December 2019. Two things about that holding are worth checking, and both check directly from the filings.
First, no promoter share is pledged or otherwise encumbered — 0.00%, in every one of the last eight quarterly filings. The June 2026 filing answers pledge, non-disposal undertaking and other encumbrance with "No" to all three, and the NSE XBRL tags read false on all three. For a promoter-controlled Indian large cap that is the single most useful line to be able to verify, and it is clean.
Second, the sell-down is identifiable. Promoter holding fell 63.01% → 61.52% in the September 2025 quarter, a reduction of 2,226,057 shares, and the filing-to-filing difference reconciles exactly across seven named promoters: Inder T. Jaisinghani −583,182; Ajay T. and Girdhari T. −469,518 each; Ramesh T. −446,785; Nikhil R. −136,393; Bharat A. −113,661; Aarti Ajay Jaisinghani −7,000. Media reported block deals on 25 September 2025 at about ₹7,458 a share, roughly ₹1,740 crore; we could not verify the tickets from an exchange source, so treat price and counterparties as reported. An earlier reduction of 2,919,500 shares landed in the September 2024 quarter alongside a 28 June 2024 block deal of 40.5 lakh shares at ₹6,708, for which the exchanges disclosed no buyers or sellers. Promoter holding has been flat at 92,582,842 shares since 31 December 2025; the 61.50% → 61.46% drift since is ESOP dilution of the denominator, not selling.
Institutionally, FPIs went 13.49% → 19.00% across the eight quarters while DIIs went 11.70% → 7.62%. Shareholder count fell from 427,928 (March 2025) to 356,777 (June 2026), a 17% decline.
On jurisdictions. At March 2026 there were 824 FPI holders holding 18.21% and not one is individually disclosed, because the SEBI format names only holders above 1% — and that format carries no country-of-registration field in any case. So there is no named offshore holder whose jurisdiction we could report. The latest quarter with verified name-level detail is December 2025, where the only three names above 1% in the whole public table were an individual, Anil Hariram Hariani, at 2.98%, and two domestic index funds. The promoter group's foreign sub-total is zero in every quarter.
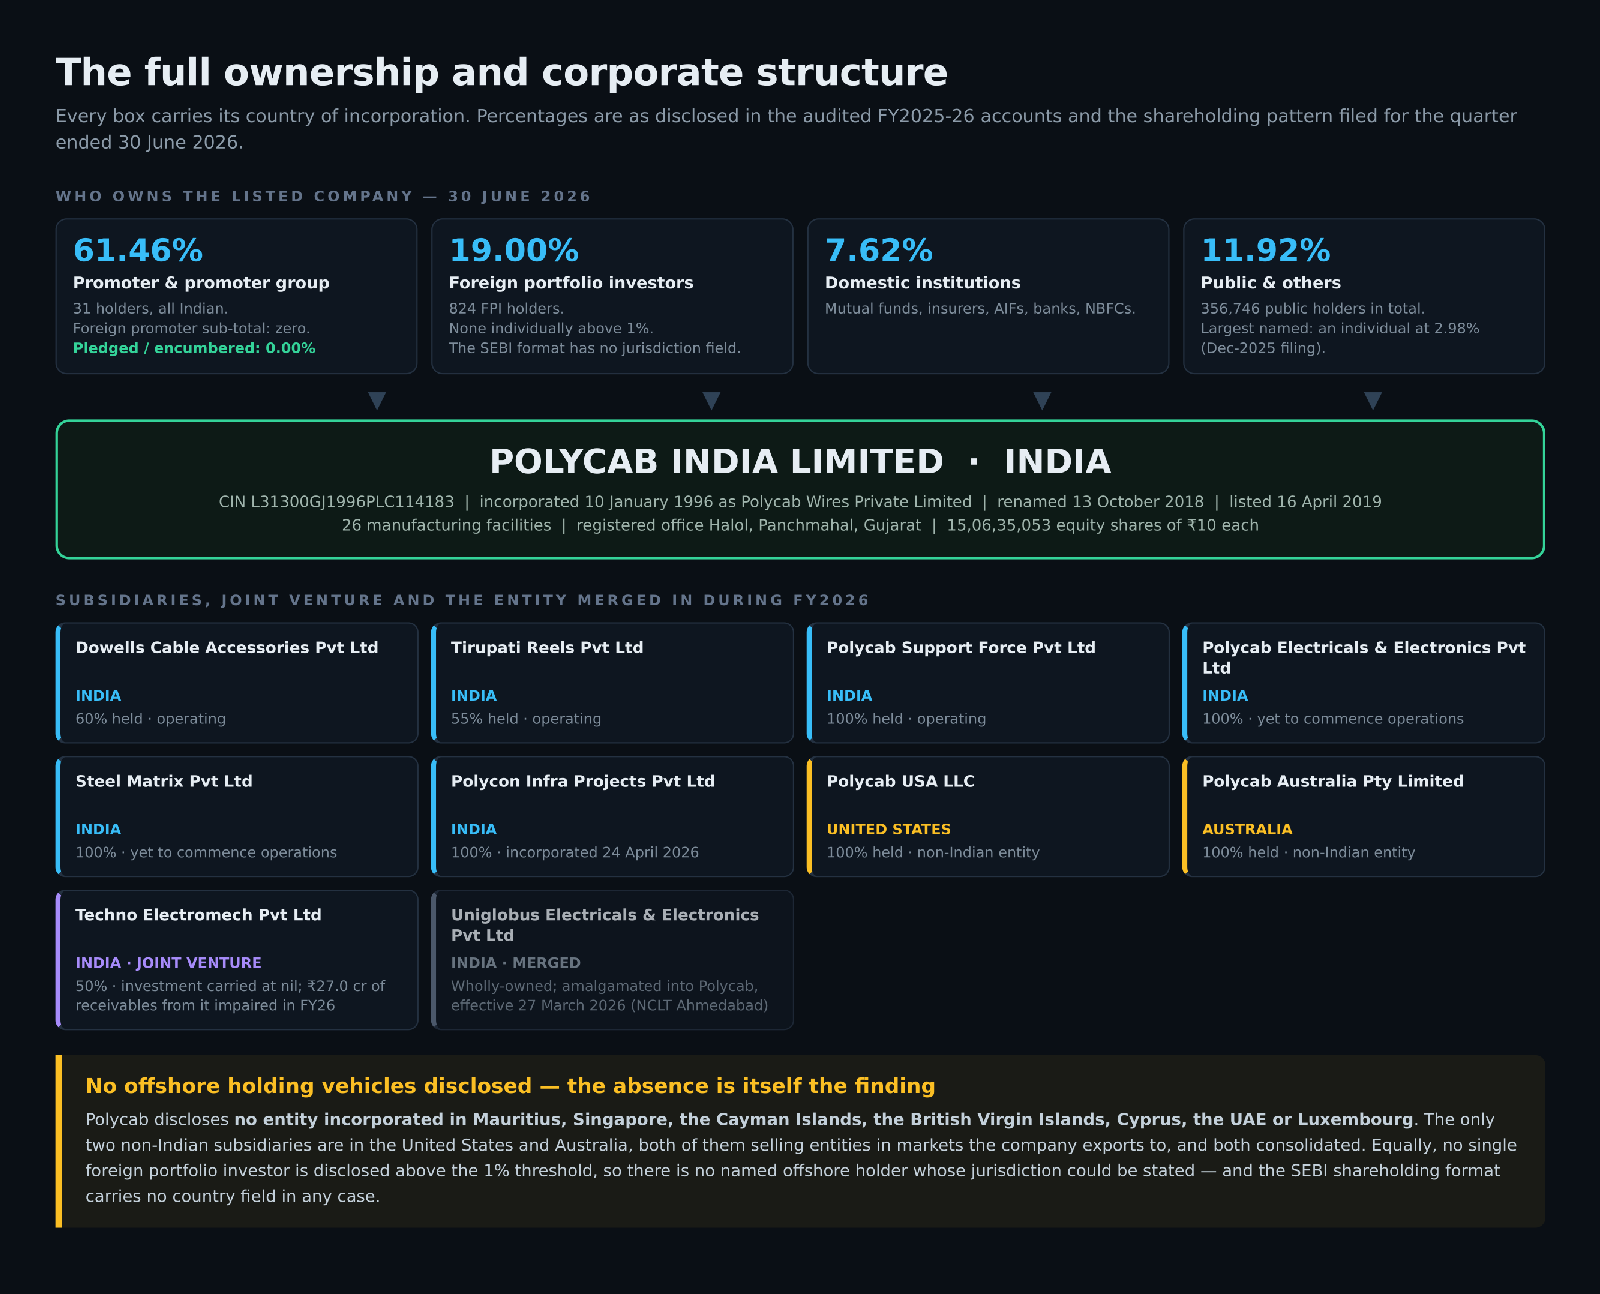
The group structure carries the same answer. Polycab discloses eight subsidiaries and one joint venture. Six subsidiaries and the JV are Indian. The two that are not are Polycab USA LLC (United States) and Polycab Australia Pty Limited (Australia) — both wholly owned, both in markets the company exports to, both consolidated. There is no entity in Mauritius, Singapore, the Cayman Islands, the British Virgin Islands, Cyprus, the UAE or Luxembourg. Offshore holding structures are legal and extremely common in Indian listed groups; they get disclosed because the ultimate beneficial owner of such a vehicle is often not publicly identifiable. Polycab does not have one, and a clean, essentially domestic structure is a verified finding rather than an omission.
Capital history — every time they raised money
The shortness of this section is the point. Since listing in April 2019 Polycab has done no bonus issue, no stock split, no rights issue, no QIP, no preferential allotment, no warrants and no buyback. The FY2026 report says it directly: "the Company did not raise any funds through preferential allotment or qualified institutions placement." Every shareholding filing answers "No" on convertible securities and warrants, and the secretarial audit lists the SEBI Buyback Regulations among those not applicable.
The IPO raised ₹1,345.26 crore at ₹538 — a ₹400 crore fresh issue plus a ₹945.26 crore offer for sale. IFC was an "Investor Selling Shareholder" there, then sold down 9.48% (Dec-2019) → 5.57% (Dec-2020) → 2.54% (Mar-2021), falling below the 1% disclosure threshold in the June 2021 quarter. The four bonus issues all predate listing, the last 1:1 in October 2014. Face value remains ₹10.
The only new shares since listing are ESOPs: 148,829,753 (December 2019) to 150,635,053 (30 June 2026) — roughly 1.2% cumulative dilution in six and a half years, with 958,787 options outstanding. Dividends were ₹30 per share for FY2024, ₹35 for FY2025 and ₹47 proposed for FY2026, a payout of about 26%.
Who runs it, and the wider web
The board at 31 March 2026 is nine: four executive non-independent, five independent non-executive, two of them women. Inder T. Jaisinghani is Chairman & Managing Director (a director since December 1997); Bharat A. and Nikhil R. Jaisinghani were re-designated from Whole-time Director to Joint Managing Director on 16 January 2026; Vijay Pratap Pandey is Executive Director. There is no separate CEO. R. S. Sharma ceased as an Independent Director on 19 September 2025 on completing his second term.
The governance table shows the four executive promoter directors with a dash in every column — nil directorships in other listed or deemed public companies. The report's own note excludes private, foreign and Section 8 companies from that count, so it is not a statement that they hold none; we did not query MCA. The independent directors' other listed boards are disclosed: Sutapa Banerjee five, Manju Agarwal three, Sumit Malhotra two, T. P. Ostwal and Bhaskar Sharma one each.
Auditor: B S R & Co. LLP (firm registration 101248W/W-100022), signing partner Sreeja Marar, re-appointed on 10 May 2024 for a second five-year term to the 2029 AGM. No resignation, no mid-term change; the FY2026 opinion is unmodified on both standalone and consolidated accounts and the Rule 11(g) audit-trail reporting is clean. The report records that the auditor "has issued an unqualified opinion in the preceding three financial years" with "no adverse remarks / concerns from statutory auditors since listing." Contingent liabilities are negligible for this size of balance sheet: about ₹5.6 crore of disputed tax matters plus ₹78 crore of EPCG and Advance Licence export obligations.
One KMP change. Gandharv Tongia ceased as Executive Director and CFO at the close of 27 October 2025. Niyant Maru joined as Executive President – Finance on 17 October 2025 and was designated CFO from 28 October, initially on a fixed nine-month interim term, extended on 6 May 2026 to 16 April 2027. The Company Secretary, Manita Carmen A. Gonsalves, has been in post since January 2021. Naming a successor before the incumbent departs is an orderly transition; the interim-then-extended framing is simply what the filings say.
The regulatory and surveillance record
SEBI: we searched the enforcement database across every published order sub-section for "polycab" and "Jaisinghani", with positive controls to confirm the search engine was working. Every query returned "No record(s) available." The only Polycab documents on sebi.gov.in are the 2018–19 IPO filings, and the company's governance report states no penalty has been imposed by the exchanges or SEBI on any capital-markets matter in three years. SEBI does not publish show-cause notices, so absence from the database is not proof none exists.
Exchange surveillance: POLYCAB appears in neither NSE's ASM list (146 long-term plus 79 short-term securities) nor NSE's GSM list (77 entries, stamped as-on 17 September 2026). BSE's live scrip record for code 542652, read at 13:02 on 18 September 2026, returns empty ASM and GSM fields and a null periodic-call-auction flag — we could not load BSE's published list page itself, so that half rests on the per-scrip fields.
Credit ratings: CRISIL reaffirmed Crisil AAA/Stable and Crisil A1+ on ₹9,721 crore of facilities on 17 November 2025, having upgraded from AA+/Positive on 14 October 2024. India Ratings upgraded to IND AAA/Stable on 1 August 2025 and reaffirmed IND A1+. There are no downgrades in five years and no "Issuer Not Cooperating" tag — both agencies publish full dated rationales. A commercial-paper programme rated A1+ was withdrawn in August 2023 and none is outstanding. We found no ICRA or CARE rationale; the company lists only these two.
NCLT: the only scheme Polycab is party to is the amalgamation of its wholly-owned subsidiary Uniglobus, sanctioned by NCLT Ahmedabad on 27 February 2026 and effective 27 March 2026 — a Sections 230–232 merger, not insolvency. Separately, an operational creditor's IBC petition was reported dismissed as not maintainable on 15 December 2025 because the amount in default fell below the ₹1 crore threshold after adjustments; we have only a secondary report and IBBI's database returns no record, so we label it unverified. Polycab has never been subject to CIRP or a moratorium.
The December 2023 income-tax search — and, more usefully, how it ended. Polycab disclosed to the exchanges on 22 December 2023 that "the Income Tax Department has initiated a search today... at some of the premises/plants related to the Company," filed continuing intimations, and announced on 30 December 2023 that officials "have concluded their search operations today." On 10 January 2024 the Press Information Bureau published a release titled "Income Tax Department conducts search operations in Mumbai" describing preliminary findings in respect of an unnamed "group engaged in the manufacturing of wires and cables". The release names no company — a point Polycab itself made in its 11 January 2024 clarification, which added that it had received no written communication and that there was "no material adverse impact on the financial position of the Company." Those are the Department's stated preliminary findings about an unnamed party, and we report them as nothing more than that.
What almost no coverage carried is the resolution, and it sits in the audited FY2025-26 accounts (consolidated Note 38): "The aggregate income tax demand relating to AY 2014-15 to AY 2023-24 amounting to ₹525.63 million, along with interest of ₹175.58 million, arising pursuant to a search action conducted in December 2023, has been reduced to Nil in accordance with the order passed by the CIT(A). The Income Tax Department has preferred an appeal against the said order." A separate demand for AY 2024-25 of ₹567.78 million plus ₹8.02 million interest is under the company's own appeal. Both matters remain live on appeal; neither is carried in the contingent-liability table, which shows only ₹3.71 million of disputed income-tax demand. CRISIL published a credit bulletin on 2 January 2024 noting the events and did not change the rating; it upgraded to AAA ten months later.
Forensic checks — what the accounts show
| Check | What we found | A benign explanation |
|---|---|---|
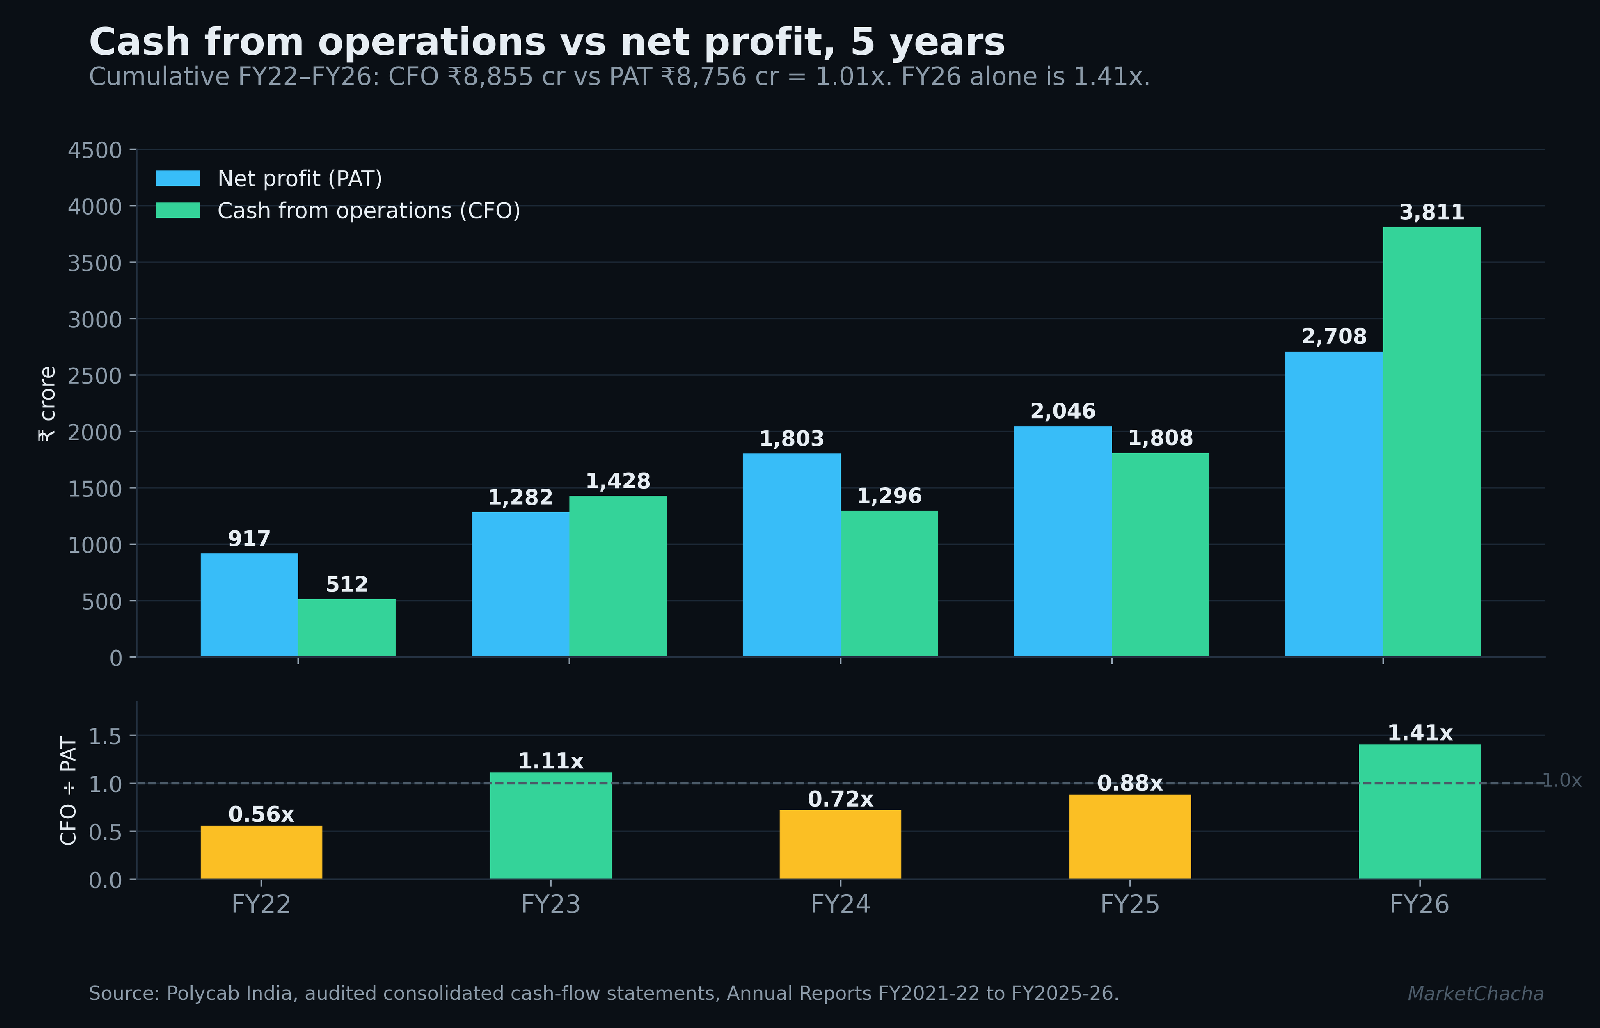
| 1. Cumulative CFO ÷ PAT, 5 years | ₹8,855 cr ÷ ₹8,756 cr = 1.01x. By year: 0.56, 1.11, 0.72, 0.88, 1.41. Strip out FY26's acceptances increase and the five-year ratio is 0.67x. | 1.01x over five years is healthy. Lumpiness is normal for a working-capital-heavy manufacturer growing 27% a year. |
| 2. Acceptances | ₹1,306 cr → ₹4,266 cr, +226.6%, against total borrowings of ₹132 cr. The ₹2,959 cr increase is 78% of the year's ₹3,811 cr net CFO. Had acceptances been flat, cash generated from operations would have been ₹1,734 cr instead of ₹4,694 cr, and net CFO about ₹851 cr (46,936 − 29,594 − 8,830, in ₹ million). | Acceptances are bank-settled trade payables — standard supply-chain finance, legal and widely used, and a AAA-rated buyer obtains them at low cost. Ind AS 7 permits classifying them in operating activities. It matters because a release of this size boosts CFO in the year it happens and cannot repeat at the same scale. |
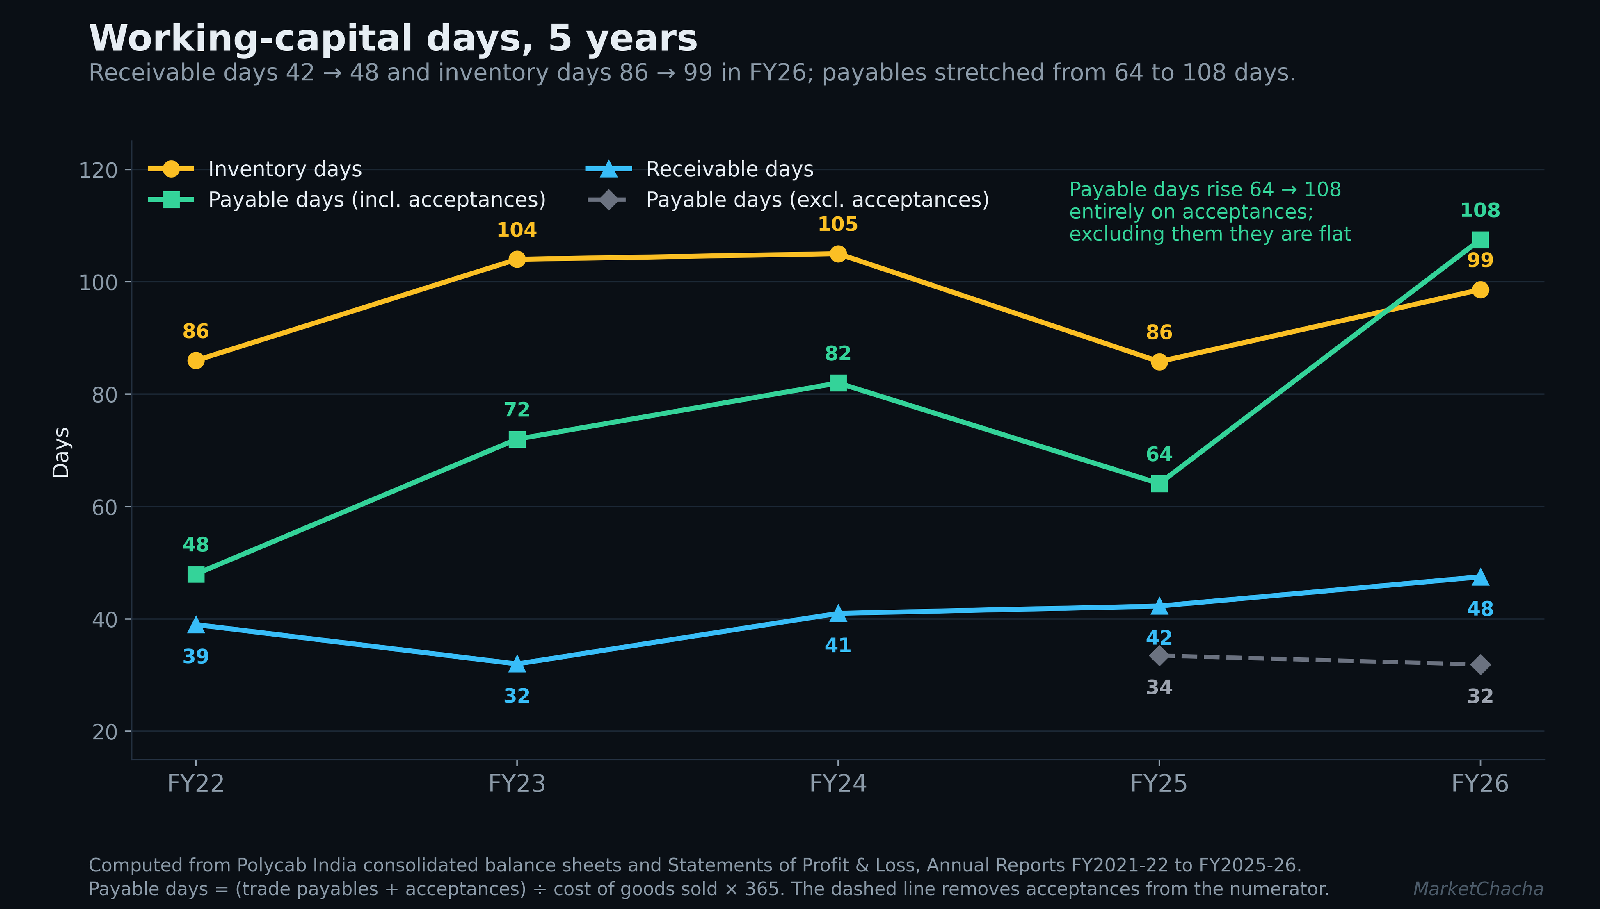
| 3. Payable days | 64 → 108 days including acceptances. Excluding acceptances: 34 → 32 days — flat. So the entire stretch is the acceptances line. The company's own BRSR reports 75 days vs 61 on its different formula. | Scale brings buying power, and a company with a ₹4,287 cr treasury has every reason to pay suppliers through the banking system rather than from cash. |
| 4. Receivable & inventory days | Receivables 42 → 48 days (53 including the non-current portion, which itself rose 50% to ₹448 cr). Inventory 86 → 99 days. Both grew faster than the 29% revenue growth. | Project business carries longer receivables and a 29% revenue year needs inventory built ahead of it. The cash conversion cycle still fell, 64 to 39 days. |
| 5. Cash pile vs income earned | Treasury (cash + bank + current investments) ₹2,520 cr → ₹4,287 cr. Finance income ₹205 cr. Implied yield on average treasury: 6.03%. | A normal Indian debt-fund and deposit yield — the cash is earning what cash should earn. |
| 6. Implied interest rate on debt | Finance cost ₹243 cr against average borrowings of ₹121 cr gives a nonsensical 201%. Against borrowings plus acceptances plus lease liabilities (average ₹3,005 cr) it is 8.09%. | The naive ratio is meaningless precisely because the real financing sits in acceptances, not borrowings. 8.09% is a sensible corporate rate. This is why "almost debt free" needs the acceptances footnote. |
| 7. Related-party transactions | Sales to related parties 0.23% of revenue (FY25: 0.79%); purchases 0.90% of materials cost (FY25: 1.33%). Per the BRSR, 1.48% of purchases and −0.30% of sales. But: loans and advances to related parties were 55.49% of total loans and advances (FY25: 25.25%), and the group carries ₹115.9 cr of receivables plus a ₹10 cr loan from its 50% JV Techno Electromech, whose attributable net worth is negative ₹17.0 cr and whose carrying value is nil. | The percentages are trivially small against revenue and the 55% figure sits on a very small base. The company also disclosed that it impaired ₹27.0 cr of the JV receivable in FY2026 (FY2025: nil) — the transparent treatment. |
| 8. Auditor | B S R & Co. LLP throughout; re-appointed 2024 to 2029. No resignation, no mid-term change, no qualification in five years. Audit trail clean. | — |
| 9. Subsidiaries & jurisdictions | 8 subsidiaries, 1 JV. Zero entities in Mauritius, Singapore, Cayman, BVI, Cyprus, UAE or Luxembourg. The only non-Indian entities are in the United States and Australia. | — |
| 10. Dilution & allotments | No preferential allotment, QIP, rights issue, warrant or buyback since listing. ESOPs only: ~1.2% cumulative dilution in six and a half years. | — |
| 11. Promoter pledge | 0.00% pledged or encumbered in all eight quarters examined. Promoter stake 68.60% (Dec-2019) → 61.46% (Jun-2026), with the reductions traceable to identified quarters. | Selling into a rising market to diversify family wealth is ordinary. The pledge line is the one that carries risk, and it is nil. |
| 12. Capex vs depreciation & asset turnover | Capex 3.86x depreciation (FY25: 3.26x); ₹1,230 cr of capital commitments still outstanding. Asset turnover fell 1.63x → 1.41x. EPC segment assets rose 58% while EPC revenue fell 13%. | Adding capacity ahead of demand always shows up as falling asset turnover first. EPC assets include contract assets and project inventory that build before revenue is recognised. |
| 13. Other income as % of PBT | 6.5% in FY26 (FY25: 7.7%) — low, and falling. But in Q1 FY27 other income rose 73.7% QoQ and accounted for the whole of the 0.85% QoQ PBT increase. | A treasury that nearly doubled mechanically produces more finance income. Annually immaterial; in one quarter it flattered the optics. |
What we could not verify
- The terms of the acceptances. Pricing, tenor and the banks providing the facilities are disclosed nowhere in the accounts. For a ₹4,266 crore balance that is the most consequential gap in this file.
- Suppliers, input sourcing and plant-level detail. No supplier is named, no single-source dependency disclosed, no domestic-versus-imported split for copper and aluminium given, and capacities are published for five clusters rather than all 26 facilities.
- Bulk and block deal tickets. NSE's historical deal endpoints are region-blocked and BSE's decommissioned, so the September 2025 and June 2024 deal prices and counterparties are as reported in media. The promoter holding changes themselves are verified from the filings.
- Promoter name-to-holding pairs for the March and June 2026 filings — the March PDF extracts with a misaligned name column and the June filing is an image scan. Category totals for both are reliable; name-level detail is verified only to 31 December 2025.
- Private, foreign and Section 8 directorships of the executive promoter directors, which the annual report's nil count expressly excludes; we did not query MCA. Likewise whether any SEBI show-cause notice exists — SEBI does not publish them.
- BSE's published ASM list document (403, JavaScript-rendered), the full India Ratings press release, and the NCLT order of 15 December 2025 on the IBC petition — secondary or alternative sources only. Also the date the registered office moved from Delhi to Gujarat, and the per-seller split of the 2019 offer for sale.
What would change the picture
Five concrete, checkable things, in order of how much they would move the file.
- The acceptances line in the FY2027 balance sheets. If it holds near ₹4,266 crore, FY2027 CFO loses the ₹2,959 crore tailwind and reverts towards operating profit before working capital. If it keeps rising, the question is how far; if it falls, it becomes a cash outflow. This one number explains next year's cash flow better than any other.
- Receivable and inventory days. 48 and 99 respectively; both moved the wrong way in FY2026. Another leg up alongside slowing revenue is the thing to watch.
- The EPC segment. Revenue down 13% in FY2026 and 40% quarter on quarter while segment assets rose 58%. Either those assets convert to revenue, or they do not.
- The next shareholding pattern — the pledge declaration, nil for eight quarters running, and whether promoter share count moves off 92,582,842.
- The income-tax appeals: the Department's appeal against the CIT(A) order reducing the AY2015–AY2024 demand to nil, and the company's own on AY2024-25. Both surface in the FY2027 accounts. Also whether the CFO's term, running to 16 April 2027, is made permanent. Our calendar carries the results dates.
For context on the sector: we covered KEI Industries and UltraTech's entry into wires, ran the same kundli on Sterlite Technologies, and looked at Diamond Power Infrastructure in the same space.
FAQ
What are "acceptances" and why do they matter here? A trade payable settled through a bank: the bank pays the supplier, the company repays the bank. Under Ind AS it sits in operating liabilities, not borrowings — so a company can carry ₹4,266 crore of them and still be described as almost debt free on ₹132 crore of borrowings. Entirely legal and widely used. It matters because the ₹2,959 crore increase flowed through operating cash flow as a source, supplying 78% of FY2026's ₹3,811 crore.
Are any Polycab promoter shares pledged? No. Every quarterly shareholding filing from September 2024 to June 2026 declares nil pledge, nil non-disposal undertaking and nil other encumbrance, and the NSE XBRL tags read false on all three.
Does Polycab have offshore subsidiaries? Two non-Indian ones: Polycab USA LLC and Polycab Australia Pty Limited. There is no entity in Mauritius, Singapore, Cayman, BVI, Cyprus, the UAE or Luxembourg, and no FPI holder is individually disclosed above 1%.
What happened with the December 2023 income-tax search? The company disclosed the search on 22 December 2023 and its conclusion on 30 December. A Press Information Bureau release of 10 January 2024 set out preliminary findings about an unnamed wires-and-cables group. The audited FY2025-26 accounts state the AY2014-15 to AY2023-24 demand of ₹525.63 million plus ₹175.58 million interest was reduced to nil by the CIT(A), with the Department in appeal, and a separate AY2024-25 demand of ₹567.78 million under the company's own appeal.
Is Polycab under any exchange surveillance measure, and has it diluted shareholders? It appears in neither NSE's ASM nor GSM list as at 17 September 2026, and BSE's live scrip record shows empty ASM and GSM fields and no periodic call auction as at 18 September. On dilution: no bonus, split, rights issue, QIP, preferential allotment, warrant or buyback since April 2019; share count rose from 148.83 million to 150.64 million entirely through ESOP exercise, about 1.2% in six and a half years.
Sources
- Polycab India, Integrated Annual Report 2025-26 (audited consolidated and standalone financial statements, auditor's report, Form AOC-1, BRSR, corporate governance report, Notes 37–40)
- Unaudited consolidated financial results and segment information for the quarter ended 30 June 2026, with B S R & Co. LLP limited review report, filed 16 July 2026
- Shareholding pattern, quarter ended 30 June 2026 · 31 March 2026 · 31 December 2025 · 30 September 2025 · 30 June 2025 · 31 March 2025 · 31 December 2024 · 30 September 2024 · December 2019 and December 2020
- NSE shareholding-pattern XBRL, quarter ended 30 June 2026 (pledge / NDU / other-encumbrance tags)
- SEBI-filed prospectus, November 2018 (incorporation history, name changes, pre-IPO capital structure, IFC as Investor Selling Shareholder)
- Reg. 30 intimation, 22 December 2023 — initiation of income-tax search
- Reg. 30 intimation, 30 December 2023 — conclusion of search operations
- Company clarification to the exchanges, 11 January 2024
- Press Information Bureau, Ministry of Finance, Release ID 1994969, 10 January 2024 — "Income Tax Department conducts search operations in Mumbai" (names no company)
- CRISIL Ratings rationale, 17 November 2025 — Crisil AAA/Stable, Crisil A1+ · CRISIL credit bulletin, 2 January 2024
- Reg. 30 intimation, 1 August 2025 — India Ratings upgrade to IND AAA/Stable
- Reg. 30 intimation, 27 March 2026 — scheme of amalgamation of Uniglobus becomes effective
- NSE Additional Surveillance Measure list and NSE Graded Surveillance Measure list, read 17–18 September 2026 — POLYCAB absent from both
- SEBI enforcement orders index — searched for "polycab" and "Jaisinghani" across all order sub-sections; no records
- Polycab India investor relations filing archive · Screener.in consolidated financials (five-year series, cross-checked against the annual reports)
Independent research for education and discussion only. Not investment advice, not a recommendation, and not a rating — we issue no buy/sell calls and no target prices. Every figure is sourced from the primary documents linked above; figures can be restated and we can make mistakes, so always verify against the original. Nothing here alleges wrongdoing by any company or individual: where a fact raises a question we state the fact, cite it, and give the benign explanation alongside. Offshore holding structures, pledging and preferential allotments are all legal and common — they are disclosed here as facts, not as accusations.
This article is for educational and informational purposes only. It is not financial advice, investment recommendation, or a solicitation to buy or sell securities. Investing involves significant risks. I am not a SEBI-registered investment advisor. Readers should consult their own financial advisor and conduct their own research before making any investment decisions.
Comments
Join the conversation
Sign in to join the conversation.
Follow replies, add your view, and take part in the discussion.
Sign in to commentLoading comments...