

What is the P/E ratio — and how do you actually read it? (Trailing vs forward, PEG & earnings yield explained)
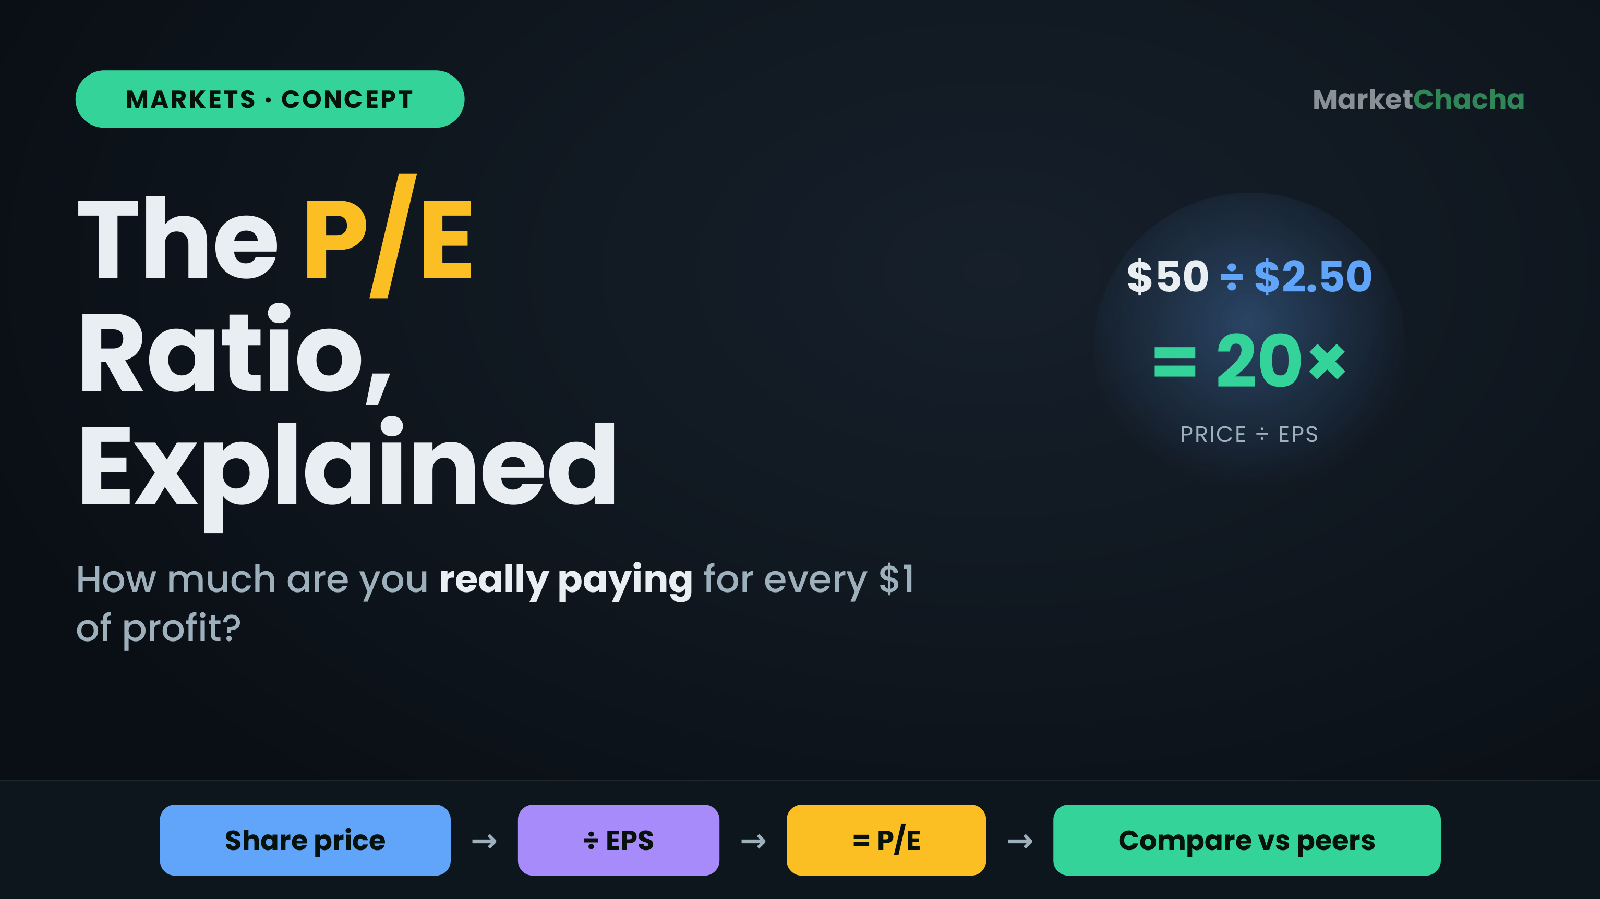
The price-to-earnings (P/E) ratio is the single most-quoted number in investing, and it answers one simple question: how much are you paying for every ₹1 (or $1) of a company's annual profit? You calculate it by dividing the share price by the earnings per share (EPS). A stock trading at $50 with EPS of $2.50 has a P/E of 20 — meaning investors are paying $20 for each $1 the company earns in a year. This guide breaks down exactly what the P/E ratio is, how to calculate it, the difference between trailing and forward P/E, the earnings yield and PEG ratio, when the number is misleading, and how to actually use it without getting fooled.
What the P/E ratio actually is
The formula is deliberately simple: P/E = Share Price ÷ Earnings Per Share (EPS). EPS is a company's net profit over a period divided by the number of shares outstanding. So the P/E ratio takes what the market is willing to pay for one share and measures it against how much profit that one share represents.
Read literally, a P/E of 20 says: "at the company's current level of profit, it would take about 20 years of earnings to add up to today's share price." That is a rough intuition, not a promise — earnings change every year — but it captures the idea. A higher P/E means the market is paying up, usually because it expects profits to grow strongly in the future. A lower P/E means the market is paying less per unit of current profit, which can signal either a bargain or a business the market is worried about.
A worked example (the arithmetic)
Suppose "Acme Ltd." earned $250 million in net profit last year and has 100 million shares outstanding. Its EPS is $250m ÷ 100m = $2.50 per share. If the share currently trades at $50, then:
- P/E = $50 ÷ $2.50 = 20
You are paying 20 times Acme's annual earnings. Now compare it to "Beta Ltd.", which also trades at $50 but earned only $1.25 per share. Beta's P/E = $50 ÷ $1.25 = 40. Same price, but you are paying twice as much per dollar of profit for Beta. That doesn't automatically make Beta "worse" — the market may expect Beta's earnings to grow far faster — but it tells you the market's expectations for Beta are much higher, so Beta has more to prove.
What a "high" or "low" P/E really tells you
A P/E on its own is meaningless — it only means something in comparison. The three fair comparisons are: (1) the company versus its own history, (2) the company versus close competitors in the same industry, and (3) the company versus the broad market index. A software company on a P/E of 35 might be cheap next to its peers on 50, while a bank on a P/E of 35 would look wildly expensive next to peers on 10.
Why do fast-growing companies command high P/Es? Because the P/E reflects future expectations, not just today. If you believe a company will double its earnings in three years, then today's "40x" quietly becomes "20x" on those future earnings — so investors pay up front for growth they expect to arrive. The risk is obvious: if that growth disappoints, the high P/E collapses and the share price falls hard.
Trailing vs forward P/E
This is the distinction that trips up most beginners. There are two versions of the same ratio, and they use different earnings:
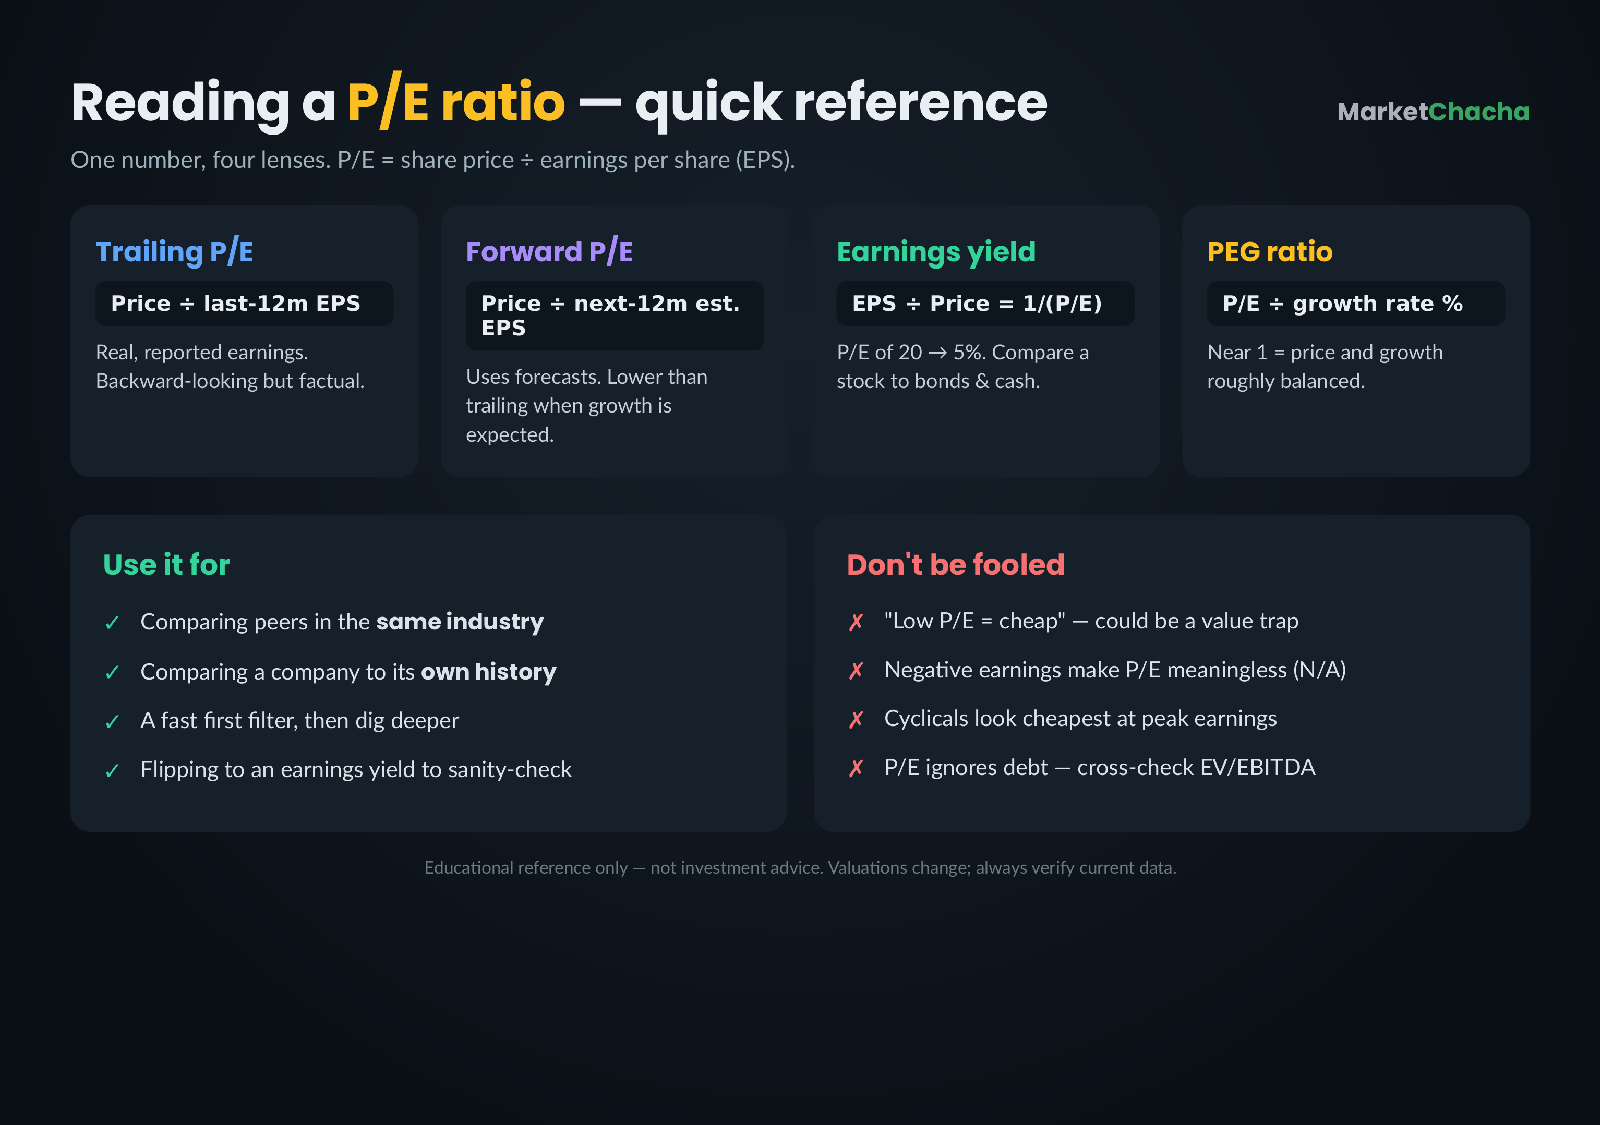
- Trailing P/E (TTM): price divided by the actual earnings per share over the last 12 months. It uses real, reported numbers — nothing estimated — so it is factual, but backward-looking.
- Forward P/E: price divided by analysts' estimated EPS for the next 12 months. It looks ahead, which is what investors care about, but it relies on forecasts that can be wrong.
For a growing company, the forward P/E is usually lower than the trailing P/E, because next year's expected earnings are higher (bigger denominator = smaller ratio). If a stock's forward P/E is much lower than its trailing P/E, the market is pricing in strong earnings growth — and you are trusting the forecast. Always check which version a headline is quoting before you compare two companies; comparing one firm's trailing P/E to another's forward P/E is apples to oranges.
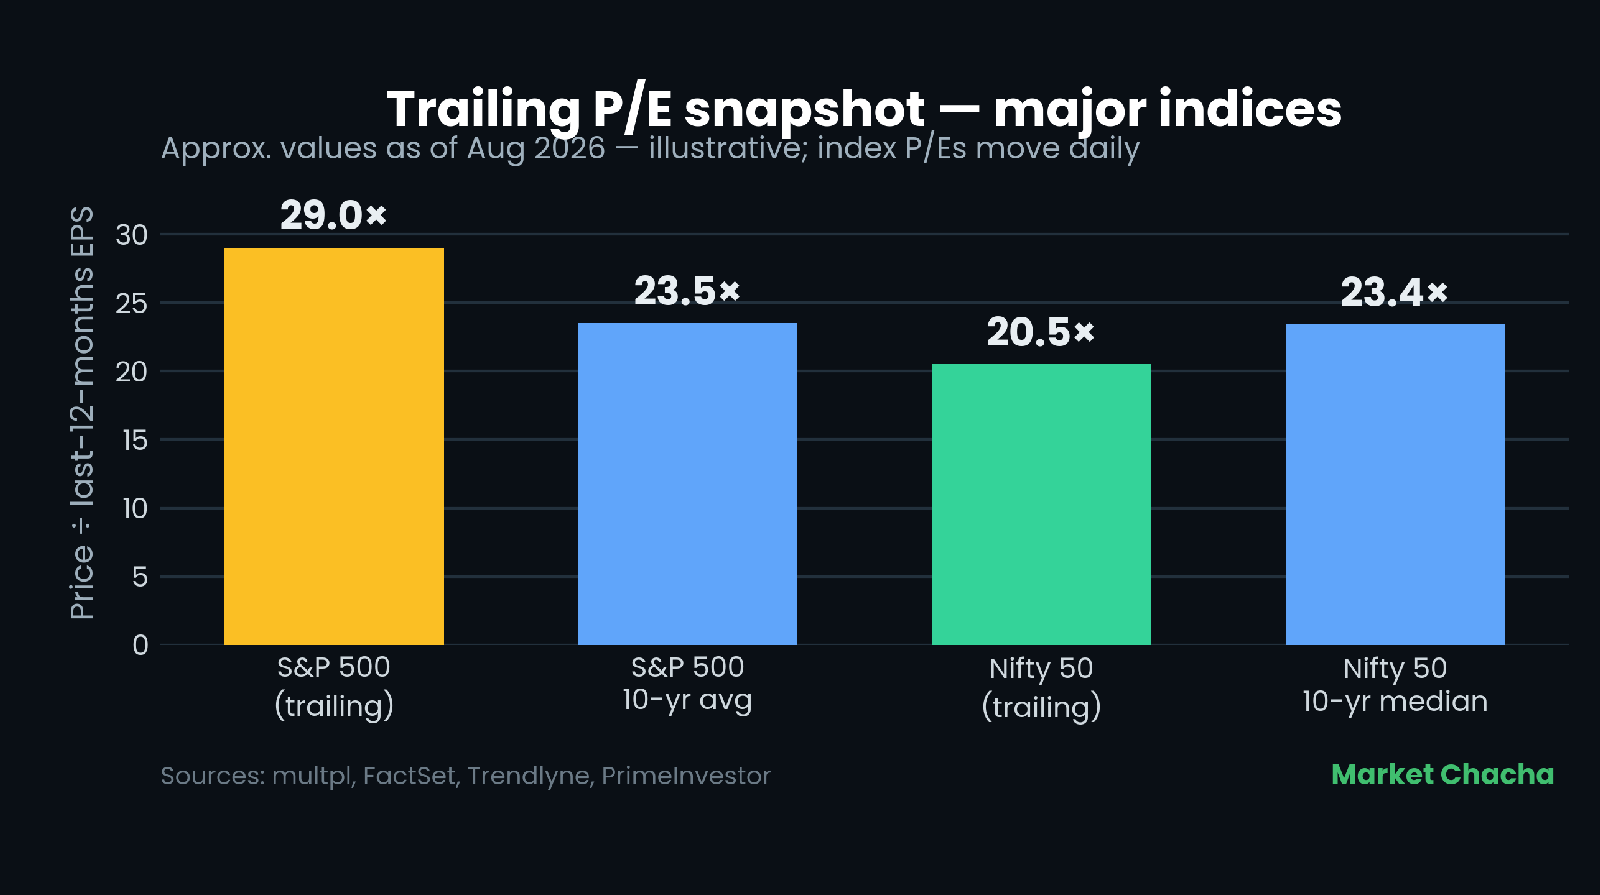
Index P/Es give useful context. As of August 2026, the S&P 500's trailing P/E sits around 28–30 (above its 10-year average of roughly 23), while India's Nifty 50 trades near 20–21 (a touch below its own 10-year median of about 23), according to multiple valuation trackers. Numbers like these move daily and are only a snapshot — but they show that "expensive" and "cheap" are relative to history and to each market.
Earnings yield: flipping the P/E over
If you turn the P/E upside down, you get the earnings yield: EPS ÷ Price, expressed as a percentage. Acme's P/E of 20 becomes an earnings yield of 1 ÷ 20 = 5%. This is powerful because it lets you compare a stock to a bond or a savings rate on the same footing. If a stock's earnings yield is 5% while a government bond yields 4.5%, you can weigh the extra return against the extra risk of owning equity. A very high P/E automatically means a very low earnings yield — a P/E of 50 is just a 2% earnings yield, which is why frothy valuations leave little cushion.
The PEG ratio: adjusting P/E for growth
Because a high P/E can be justified by high growth, investors often use the PEG ratio to put the two side by side: PEG = P/E ÷ annual EPS growth rate (in %). A company with a P/E of 30 growing earnings at 30% a year has a PEG of 30 ÷ 30 = 1.0. The rough rule of thumb, popularised by investor Peter Lynch, is that a PEG near 1 suggests the price and the growth are roughly in balance; below 1 may be attractive, above 2 may be pricey. Treat it as a lens, not a verdict — the growth rate you plug in is itself an estimate, and small changes swing the answer a lot.
When the P/E ratio lies
The P/E is easy to misuse. Watch for these traps:
- Negative or near-zero earnings: if a company lost money, EPS is negative and the P/E is meaningless (often shown as "N/A" or a nonsensical huge number). Many young, fast-growing firms have no usable P/E at all.
- Cyclical companies: for miners, carmakers and commodity producers, earnings swing wildly. Their P/E often looks lowest at the top of a boom (peak earnings) and highest at the bottom of a bust — the opposite of what a beginner expects. This is the classic "value trap."
- One-off items: a company that sold a factory or booked a legal settlement can show a temporarily inflated or depressed EPS, distorting the P/E for a year.
- Debt is invisible to P/E: two companies with the same P/E can carry very different debt loads. The P/E only looks at equity value and net profit, so a highly indebted firm can look deceptively cheap. This is why analysts also use EV/EBITDA, which accounts for debt.
- Accounting differences: P/E is based on reported net profit, which can be shaped by depreciation policy, tax quirks and non-cash charges — so cross-border comparisons need extra care.
How to actually use the P/E ratio
Used sensibly, the P/E is a fast first filter, not a final answer. A practical routine looks like this:
- Compare like with like. Only stack a company's P/E against peers in the same industry and against its own multi-year range. Never compare a bank to a software firm.
- Check trailing and forward together. A big gap between them tells you how much growth (or decline) the market is pricing in.
- Flip it to an earnings yield so you can sanity-check the stock against bonds and cash rates.
- Layer in growth with PEG, then ask whether the assumed growth is realistic.
- Cross-check with other metrics — free cash flow, debt-to-equity, EV/EBITDA and margins — before concluding anything. A single ratio never tells the whole story.
Common mistakes beginners make
The most common error is treating a low P/E as automatically "cheap" and a high P/E as automatically "expensive." A low P/E often reflects a shrinking or troubled business, while a high P/E can be entirely fair for a company compounding earnings quickly. The second mistake is comparing P/Es across unrelated industries, where normal ranges differ enormously. The third is ignoring the denominator: if earnings are inflated by a one-off gain, a "low" P/E is an illusion. And the fourth is forgetting that P/E says nothing about debt, cash flow quality, or how those earnings were produced.
How this works in India
The mechanics are identical on Indian markets — the P/E is still price ÷ EPS. You will see it quoted for individual NSE and BSE stocks and for the headline indices. As of August 2026 the Nifty 50 traded on a trailing P/E near 20–21, versus a 10-year median around 23, so the index looked roughly fairly valued to slightly cheap on that one measure. Indian investors also watch the Nifty P/B (price-to-book) and dividend yield alongside it. A few India-specific cautions: many high-growth new-economy listings trade at very high or "N/A" P/Es because profits are thin or negative; PSU and cyclical stocks (metals, energy) show the same peak-earnings/low-P-E trap described above; and sector norms differ sharply — FMCG and consumer names structurally carry higher P/Es than banks or commodity producers. Compare an Indian stock to its Indian sector peers, not to a US tech giant.
FAQ
What is a good P/E ratio? There is no universal "good" number — it depends entirely on the industry, the company's growth rate and the market. A P/E is only useful compared to peers in the same sector and to the company's own history. A P/E of 15 can be expensive for a slow-growth utility and cheap for a fast-growing tech firm.
What does a high P/E ratio mean? It usually means the market expects strong future earnings growth and is willing to pay up for it. High P/Es carry more risk: if the expected growth doesn't materialise, the price can fall sharply.
What is the difference between trailing and forward P/E? Trailing P/E uses the actual earnings from the last 12 months (real but backward-looking). Forward P/E uses analysts' estimated earnings for the next 12 months (forward-looking but based on forecasts that can be wrong).
Can a company have a negative P/E ratio? Technically the maths gives a negative number when earnings are negative, but a negative P/E is treated as meaningless and usually shown as "N/A." Loss-making companies simply don't have a usable P/E, so investors look at other measures like price-to-sales.
What is the earnings yield and how is it related to P/E? The earnings yield is the P/E flipped over: EPS ÷ price, as a percentage. A P/E of 20 equals a 5% earnings yield. It lets you compare a stock's return to bonds and savings rates on the same basis.
Is a low P/E always a bargain? No. A low P/E can signal a genuinely cheap stock, but it often reflects a declining business, a cyclical company at peak earnings, or a one-off boost to profit. Always check why the P/E is low before assuming it's a deal.
Educational content only — not investment advice, and not a recommendation of any stock, index or product. Company and index valuations change constantly; always check current data and do your own research. [Sources: multpl (S&P 500 P/E), FactSet Earnings Insight, Trendlyne (Nifty 50 P/E), PrimeInvestor (Nifty P/E history)]. Always do your own research.
This article is for educational and informational purposes only. It is not financial advice, investment recommendation, or a solicitation to buy or sell securities. Investing involves significant risks. I am not a SEBI-registered investment advisor. Readers should consult their own financial advisor and conduct their own research before making any investment decisions.
Comments
Join the conversation
Sign in to join the conversation.
Follow replies, add your view, and take part in the discussion.
Sign in to commentLoading comments...