

What is dividend yield — and what does the payout ratio actually tell you? (Beginner's In-Depth Guide)
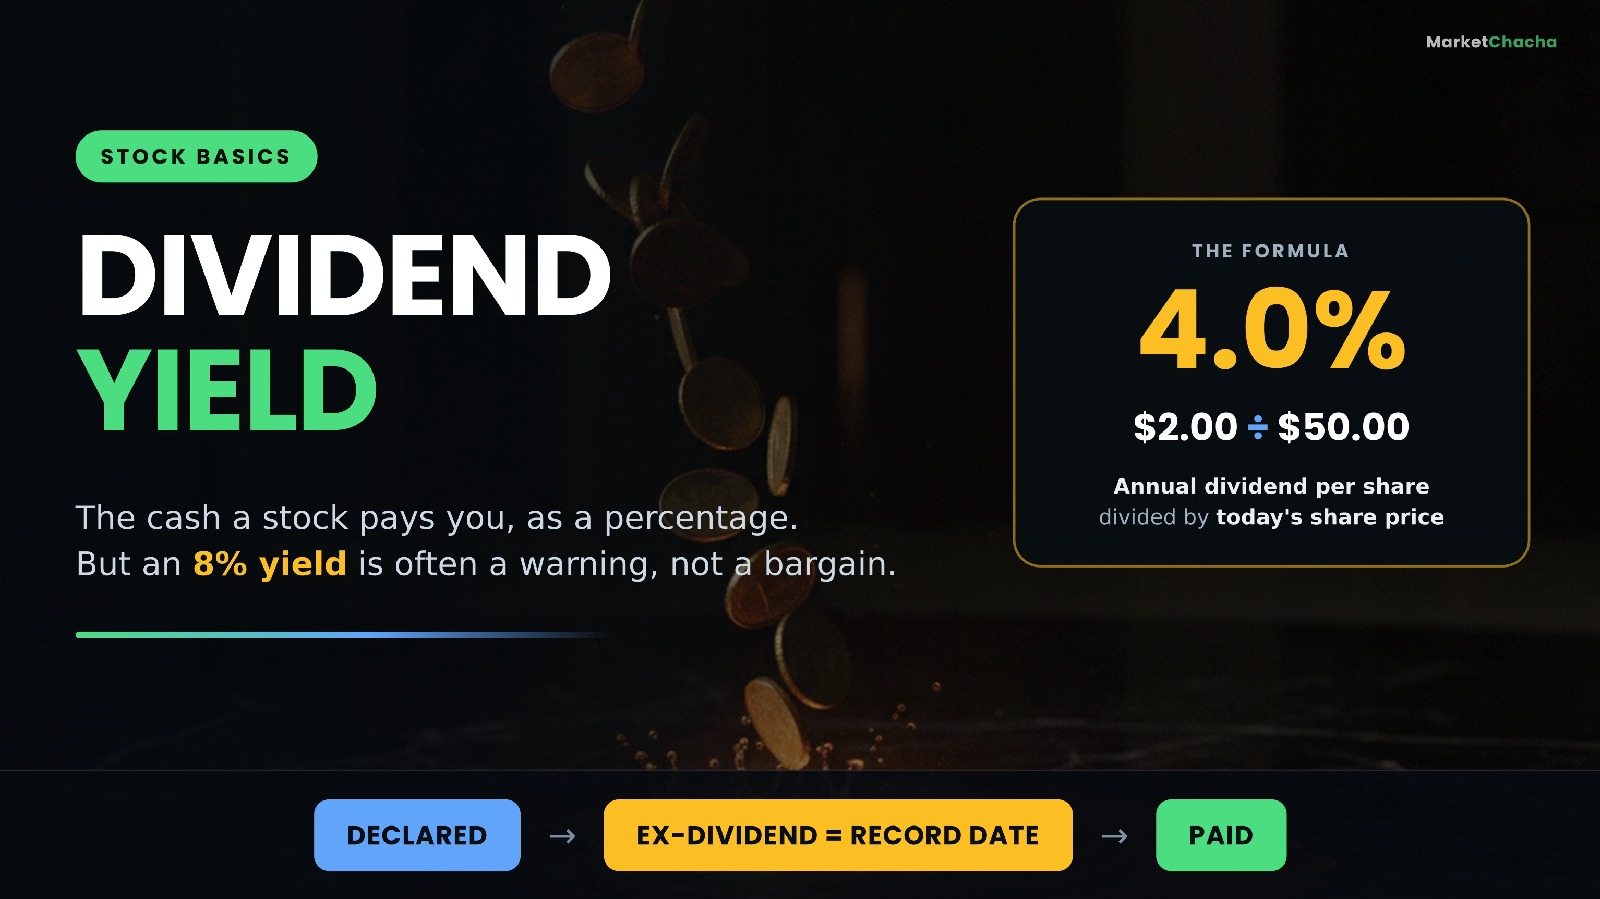
Dividend yield is simply the cash a company pays you per share over a year, divided by what one share costs today. If a stock trades at $50.00 and pays $2.00 a year in dividends, the yield is $2.00 ÷ $50.00 = 4.0%. The payout ratio is the companion number: it tells you what slice of the company's earnings that dividend is eating. Yield tells you what you get; the payout ratio tells you whether the company can keep giving it.
This guide walks through both numbers with the arithmetic spelled out — how to calculate them, why a yield can rise without the company doing anything, the "yield trap" that catches beginners, the four dates that decide whether you actually get paid, and how all of it maps to Indian stocks.
What is dividend yield, and how do you calculate it?
A dividend is a cash payment a company sends to shareholders out of its profits. It is not interest and it is not guaranteed — a board declares each dividend, and it can raise, cut or scrap it at any time. Dividend yield turns that cash payment into a percentage so you can compare it across companies of wildly different share prices.
The formula: Dividend yield = (annual dividend per share ÷ current share price) × 100
Worked example. Say a company — call it Company A — trades at $50.00 a share and pays $0.50 every quarter. Four quarters of $0.50 is $2.00 a year per share. So:
- Dividend yield = $2.00 ÷ $50.00 = 0.04 = 4.0%
- If you own 100 shares, that is 100 × $2.00 = $200 a year, arriving as $50 per quarter
- Your 100 shares cost 100 × $50.00 = $5,000, and $200 ÷ $5,000 = 4.0% — the same number, which is the point of expressing it as a yield
Notice what the formula does not include: any change in the share price. Yield is only the cash leg. Your actual return is the dividend plus or minus what the share price does — that combination is called total return, and it can easily be negative in a year when you collected every dividend.
What does the payout ratio actually tell you?
The payout ratio answers a different question: where is this money coming from?
Payout ratio = dividend per share ÷ earnings per share (EPS) — or, measured at the company level, total dividends paid ÷ net income. The two normally give you very nearly the same number.
Sticking with Company A: it pays $2.00 a share and earns $4.00 a share. Payout ratio = $2.00 ÷ $4.00 = 50%. Half the profit goes out to shareholders as cash; the other half stays in the business to fund growth, pay down debt, or sit as a cushion.
Now suppose earnings fall to $1.60 a share but the company keeps paying $2.00. Payout ratio = $2.00 ÷ $1.60 = 125%. The company is paying out more than it is earning, funding the gap from cash reserves, borrowing, or asset sales. That is not automatically fatal — a single write-off can crush EPS for one year without touching the actual cash coming in — but a payout ratio above 100% is a question you must answer before you rely on that dividend.
A useful cross-check is the cash-flow payout ratio: dividends paid ÷ free cash flow. Earnings include non-cash accounting charges; dividends are paid in real cash. If a company's dividend looks fine against EPS but consumes nearly all of its free cash flow, the earnings-based ratio is flattering it.
There is no single "correct" payout ratio, and this is where beginners go wrong. A mature utility, a tobacco company or a REIT will structurally run high payouts because they have little to reinvest in — US REITs are in fact required to distribute the bulk of their taxable income to keep their tax status. A fast-growing software company may pay nothing at all and be doing exactly the right thing with its cash. Compare payout ratios within an industry, never across them.
The dividend yield trap: why a rising yield can be a warning
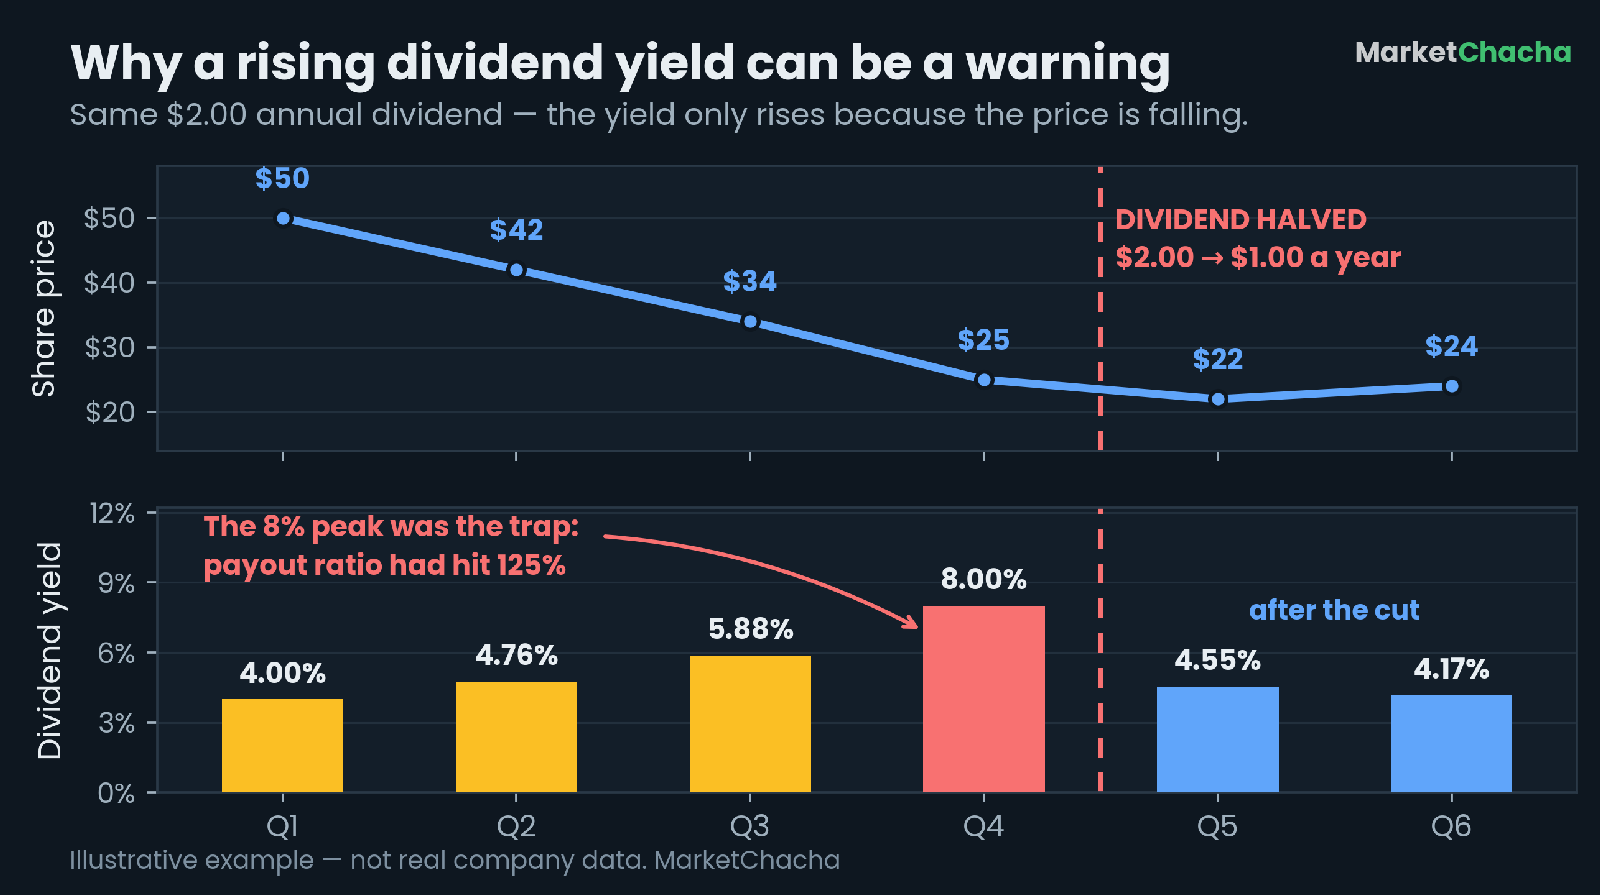
Here is the part that costs beginners money. Look at the formula again — the dividend is on top, the price is on the bottom. If the price falls and the dividend stays the same, the yield goes up automatically. The company has done nothing generous. The market has simply marked the shares down.
Watch it happen with Company A, which is paying $2.00 a year throughout:
- Price $50.00 → yield $2.00 ÷ $50.00 = 4.00%
- Price $42.00 → yield 4.76%
- Price $34.00 → yield 5.88%
- Price $25.00 → yield 8.00%
An 8% yield looks like a gift. But by that point earnings have fallen to $1.60 a share, so the payout ratio is 125% — the dividend is no longer covered. The board halves the dividend to $1.00. At a price of $22.00 the yield is now $1.00 ÷ $22.00 = 4.55%, and the investor who bought at $25 for the "8% yield" is holding a stock down 12% that pays half of what they expected.
That is a yield trap: a yield that is high because the denominator collapsed, not because the numerator is generous. The payout ratio is the single best early warning, because it looks at the dividend against what the business actually earns rather than against a share price the market is busy re-rating.
Trailing yield vs forward yield vs yield on cost
Two websites can show the same stock with two different yields, and neither is wrong — they are measuring different things.
- Trailing yield (TTM): the dividends actually paid over the last twelve months ÷ today's price. Backward-looking and factual.
- Forward / indicated yield: the most recent dividend rate annualised (a $0.50 quarterly payment × 4 = $2.00) ÷ today's price. Forward-looking and an estimate — it assumes the rate holds.
- Yield on cost: the current annual dividend ÷ the price you paid. If you bought at $25 and the dividend is now $2.00, your yield on cost is 8%, even though a new buyer at $50 gets 4%. It is a personal statistic, not a valuation measure — never use it to compare two stocks.
Special or one-off dividends distort trailing yield badly. A company that paid a one-time $5.00 special dividend will show a headline trailing yield that will not repeat. Always check whether the last twelve months included anything unusual.
The four dates that decide whether you actually get paid
Owning the stock "around" the dividend is not enough. Four dates matter:
- Declaration date — the board announces the dividend, the amount, and the dates below.
- Ex-dividend date — the cut-off. Buy the stock on the ex-dividend date and the dividend belongs to the seller, not you. To receive it you must buy before the ex-dividend date — in practice, the last trading day before it.
- Record date — the date the company checks its share register to see who owns the shares.
- Payment date — when the cash actually reaches your account, typically a few weeks later.
An important change here catches out older guides. Because US settlement moved to T+1 on 28 May 2024, FINRA amended Rule 11140 so that the ex-dividend date is now the record date itself when the record date is a business day (previously it was one business day earlier). Source: FINRA Regulatory Notice 24-04. If you read an article saying the ex-date is always one day before the record date, it predates that change.
Does the share price really drop on the ex-dividend date?
In theory, yes — and for a straightforward reason. On the ex-dividend date the buyer no longer gets that cash, and the company is about to hand real money out of its bank account. A share is worth slightly less without it, so all else equal the price should open lower by roughly the dividend amount.
In practice you often cannot see it. A $0.50 dividend on a $50 stock is a 1% adjustment, and ordinary trading moves a stock by more than that on a quiet day. This is why the popular "dividend capture" idea — buy just before the ex-date, collect the dividend, sell straight after — is far less clever than it sounds: you are trying to pocket a payment that the price is simultaneously giving back, while paying transaction costs and, in a taxable account, likely failing the holding-period test that makes the dividend tax-favoured.
On that last point, in the US the IRS treats a dividend as qualified (taxed at long-term capital gains rates of 0%, 15% or 20%) only if you held the common stock for more than 60 days during the 121-day period beginning 60 days before the ex-dividend date. Fail that and it is an ordinary dividend, taxed at your regular income rate — up to 37%. Source: IRS Publication 550. Dividends inside a 401(k) or IRA are not taxed year to year at all.
Common mistakes beginners make
- Screening for the highest yield. The top of a yield screen is disproportionately populated by companies the market expects to cut. Yield is a starting question, not an answer.
- Ignoring the payout ratio. Yield without coverage is a number with no support under it.
- Comparing yields across sectors. A 1% yield from a growth company and a 5% yield from a utility are not competing claims about quality.
- Forgetting buybacks. Many companies return cash by repurchasing shares instead. Dividend yield plus buyback yield is sometimes called total shareholder yield, and judging a company on dividends alone misses half the picture.
- Treating dividends as interest. A bond coupon is a contractual obligation. A dividend is a board decision that can be cut to zero with one announcement.
- Confusing dividend yield with total return. Collecting 5% while the stock falls 20% is a losing year.
How to actually check a dividend, step by step
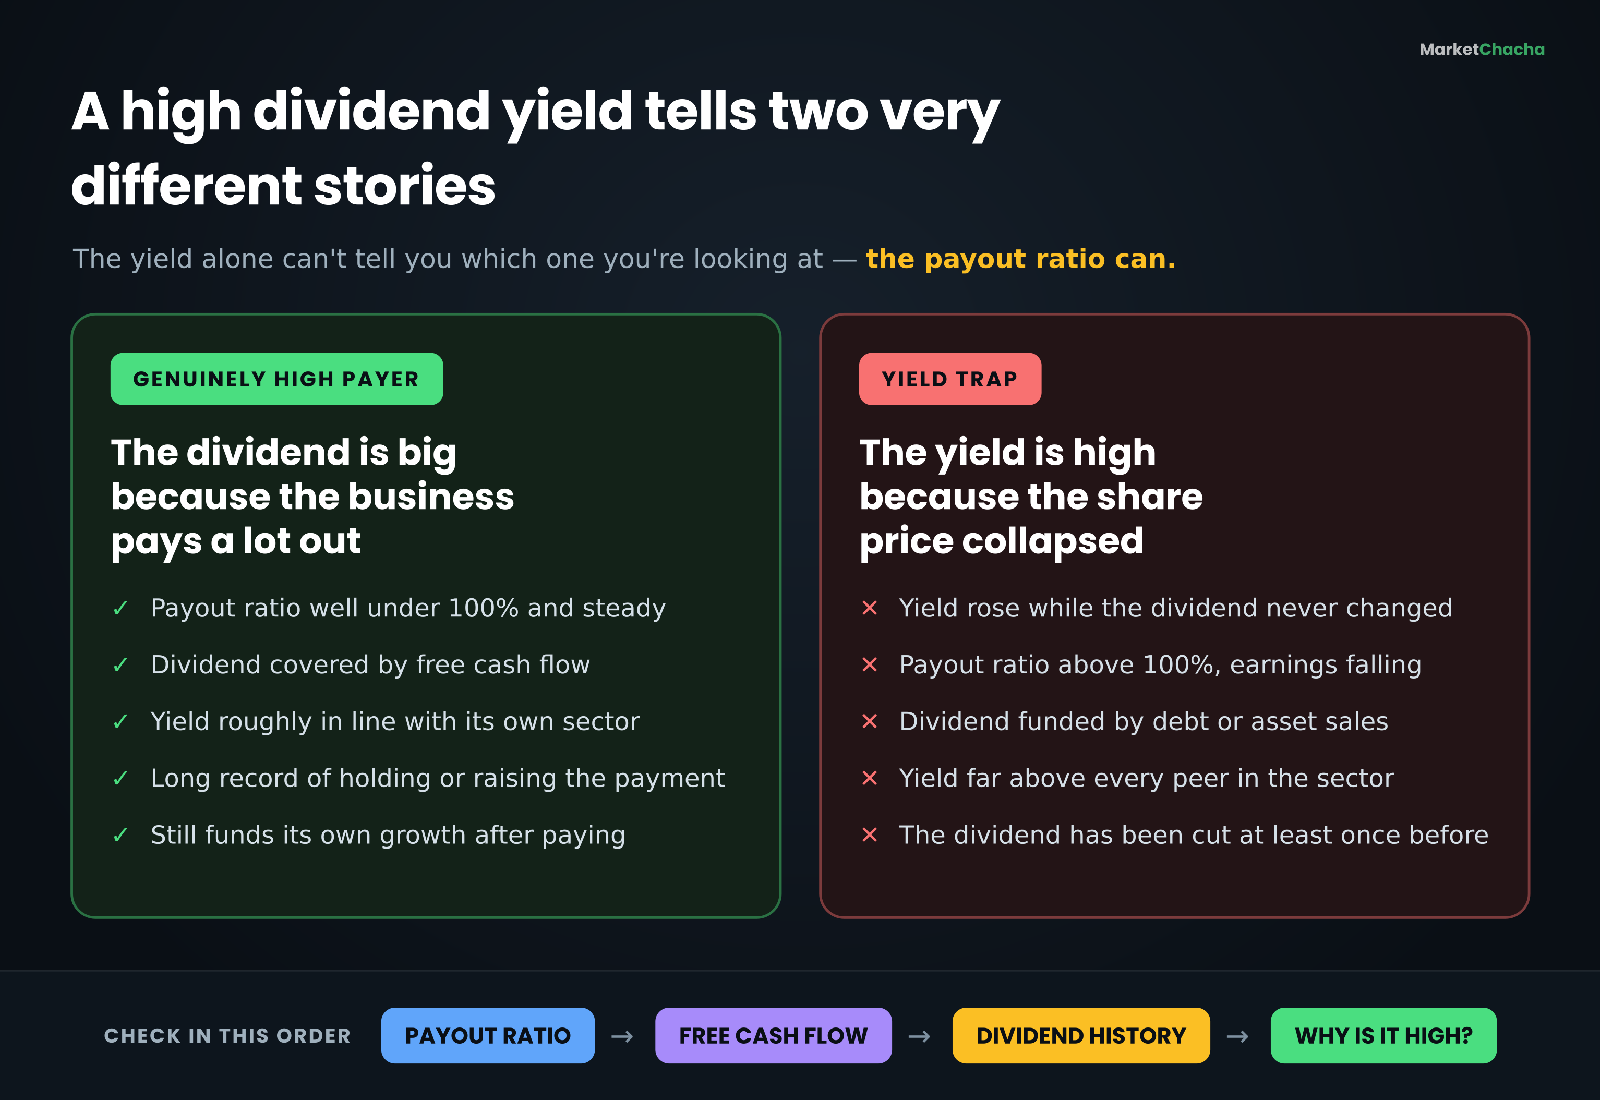
- Find the annual dividend per share. Add the last four quarterly payments, or take the current quarterly rate × 4 — and note which one you used, because they give different answers.
- Strip out specials. Remove any one-off payment before you annualise.
- Divide by today's price to get the yield.
- Calculate the payout ratio against EPS, then cross-check it against free cash flow.
- Look at the dividend history. Has the payment been steady, rising, or cut before? A company that has cut once will cut again more readily than one that never has.
- Ask why the yield is high. Trace it: is the dividend unusually large, or has the price fallen? Pull up a one-year price chart and answer that directly.
- Check the balance sheet. Dividends funded by rising debt are borrowed, not earned.
For context on what "normal" looks like at the index level: the S&P 500's dividend yield was around 1.04%–1.05% in early September 2026, close to the lowest readings on record, per multpl and Slickcharts. That is largely because US companies have shifted so much shareholder return into buybacks, and because index prices have risen faster than dividends. A single stock yielding 6% is therefore roughly six times the market — worth understanding, not automatically worth owning.
How this works in India
The arithmetic is identical: dividend per share ÷ share price. Indian dividends are usually quoted by companies as a percentage of face value, which trips people up constantly. A company declaring a "300% dividend" on a share with a face value of ₹2 is paying ₹6 per share — not 300% of anything you paid. If the share trades at ₹500, the actual yield is ₹6 ÷ ₹500 = 1.2%. Always convert the declaration into rupees per share before you calculate a yield.
The Nifty 50's dividend yield has run in the region of 1.2%–1.3% through mid-2026 (per nifty-pe-ratio.com and Trendlyne) — broadly comparable to the US, and low for the same reason: Indian index earnings have grown, but prices have grown faster. Higher yields cluster in PSUs, utilities and commodity names, and Nifty has a dedicated dividend-focused index for that segment.
On dates, India runs on a T+1 settlement cycle too, and the effect is the same: the ex-date and the record date fall on the same day, so you must hold the shares by the end of the previous trading day to be eligible (Zerodha Support).
Tax is where India differs most sharply. Since FY 2020-21 the Dividend Distribution Tax was abolished and dividends are taxable in the shareholder's own hands at their applicable slab rate — there is no equivalent of the US "qualified dividend" concession. Companies deduct TDS at 10% under Section 194 once dividends paid to you in a financial year cross ₹10,000 (a threshold Budget 2025 doubled from ₹5,000, effective 1 April 2025), and at 20% if the company does not have your PAN; the TDS is an advance, adjustable against your final liability when you file (ClearTax, Tax2win). The practical consequence: for an Indian investor in the 30% slab, a 4% dividend yield is closer to 2.8% after tax (before surcharge and cess), which is exactly why the payout ratio and the durability of the dividend matter more than the headline yield.
FAQ
What is a good dividend yield? There is no universal number — it depends entirely on the sector and on whether the dividend is covered by earnings. A yield far above its own industry average is usually a signal that the market expects a cut, not that you have found a bargain.
How do I calculate dividend yield myself? Divide the annual dividend per share by the current share price and multiply by 100. A stock at $80 paying $0.60 a quarter pays $2.40 a year, so the yield is $2.40 ÷ $80 = 3.0%.
Do I get the dividend if I buy on the ex-dividend date? No. Buying on the ex-dividend date means the seller keeps that dividend. You must own the shares before the ex-dividend date — in practice, buy by the end of the previous trading day.
What does a payout ratio over 100% mean? The company paid out more in dividends than it earned in that period, covering the difference from cash, borrowing or asset sales. It can be temporary if a one-off charge depressed earnings, but it is not sustainable indefinitely and warrants investigation.
Why did my stock's price drop right after the dividend? On the ex-dividend date the shares no longer carry the right to that payment and the cash is leaving the company, so the price adjusts down by roughly the dividend amount. Normal trading usually masks the effect.
Is dividend yield the same as return? No. Yield is only the cash income. Your total return is the dividend plus any change in the share price, and it can be negative even in a year when every dividend was paid.
Educational content only — not investment, tax or insurance advice, and not a recommendation of any product or security. All company figures used above are illustrative. Rates, thresholds and rules change — always check current terms and current tax law before acting. [Sources: IRS Publication 550, FINRA Regulatory Notice 24-04, Fidelity — Qualified Dividends, multpl, Slickcharts, ClearTax — Section 194, Tax2win, Zerodha Support] Always do your own research.
This article is for educational and informational purposes only. It is not financial advice, investment recommendation, or a solicitation to buy or sell securities. Investing involves significant risks. I am not a SEBI-registered investment advisor. Readers should consult their own financial advisor and conduct their own research before making any investment decisions.
Comments
Join the conversation
Sign in to join the conversation.
Follow replies, add your view, and take part in the discussion.
Sign in to commentLoading comments...