

What is a Bullish (and Bearish) Engulfing Candlestick Pattern? The Two-Candle Reversal Explained (Beginner's In-Depth Guide)
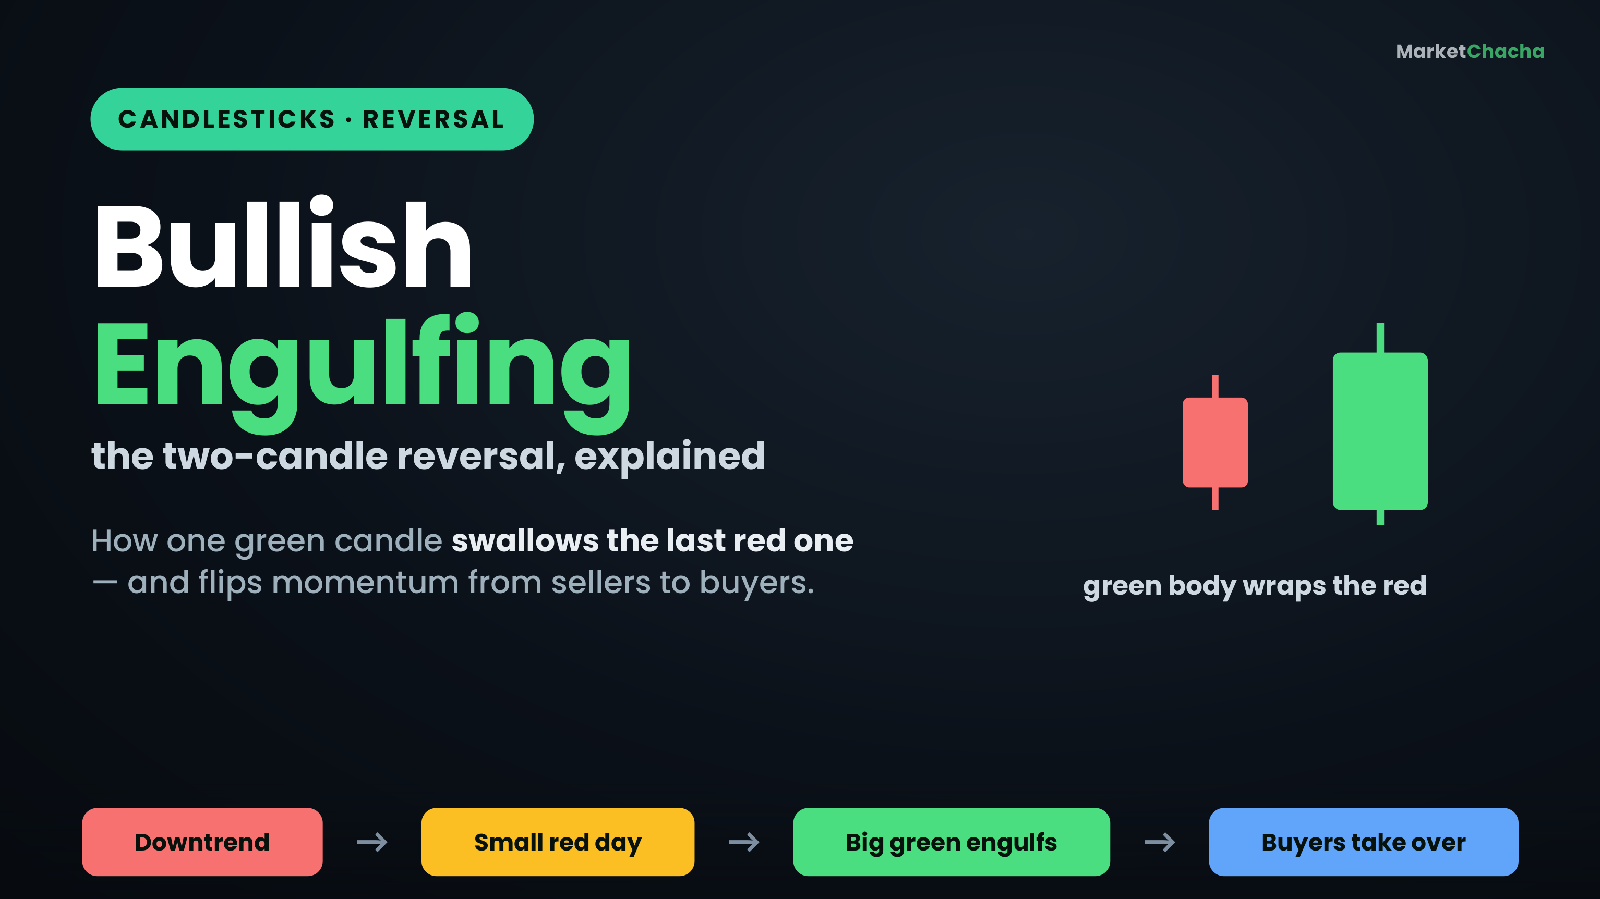
A bullish engulfing is a two-candle reversal pattern in which a small down (red) candle is followed by a larger up (green) candle whose real body completely covers — "engulfs" — the body of the candle before it. It signals that after a slide lower, buyers have suddenly overwhelmed sellers. Its mirror twin, the bearish engulfing, is a large red candle that swallows a prior small green one after a rise, hinting that sellers have seized control. This in-depth guide explains exactly how each pattern is built, walks through the numbers with a worked example, unpacks the crowd psychology that makes them tick, and shows what separates a real signal from a trap.
What "engulfing" actually means
Every candlestick has two parts: the thick real body (the distance between the open and the close) and the thin wicks or shadows (the high and low extremes). An engulfing pattern is about the bodies only. Under the classic Japanese-candlestick definition popularised by Steve Nison, the second candle's real body must fully cover the first candle's real body — the shadows are essentially ignored.
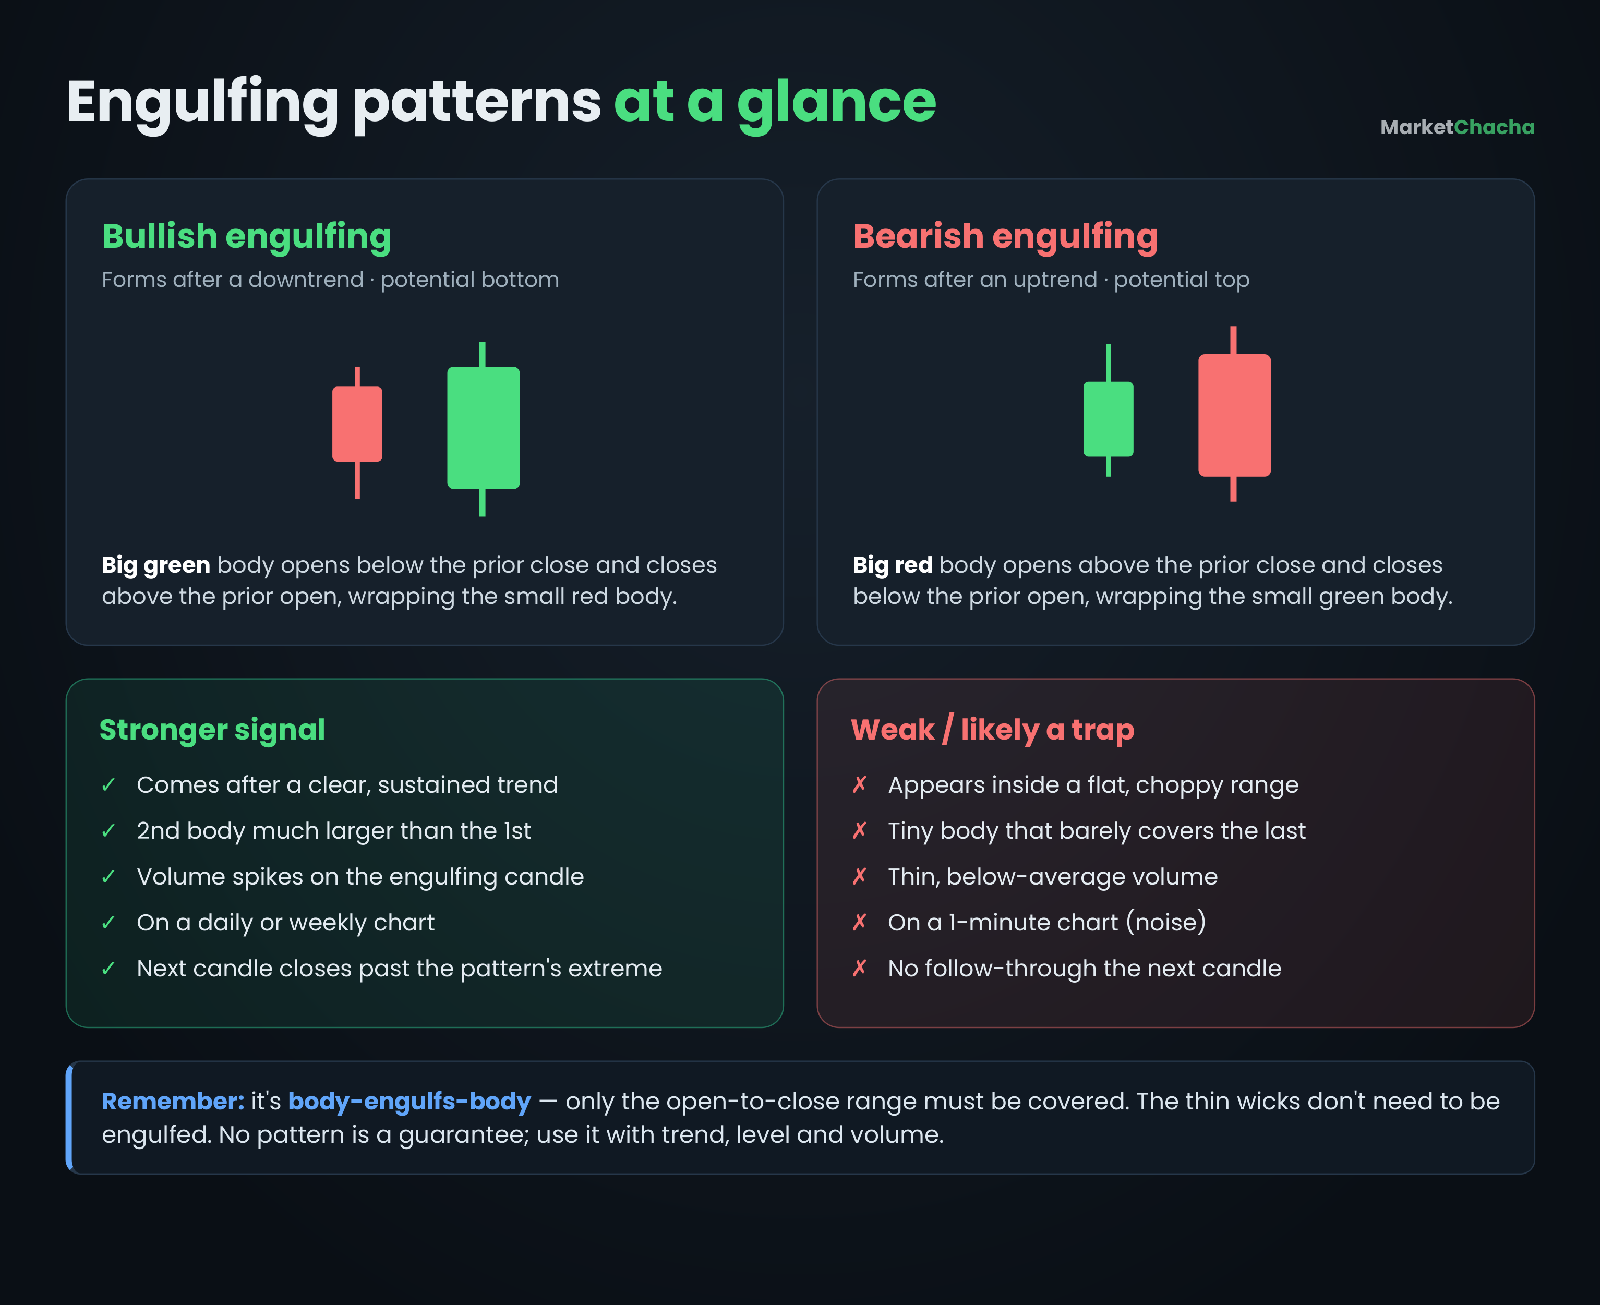
Two rules define the pattern. First, the two candles are opposite colours — a red candle followed by a green one (bullish), or a green candle followed by a red one (bearish). Second, the second body is bigger and wraps around the first: its open sits beyond one end of the prior body and its close sits beyond the other end. If a candle's body only partly overlaps the previous one, it is not an engulfing pattern — the wrap has to be complete.
Bullish engulfing: buyers erase the prior candle
A bullish engulfing appears at the bottom of a downtrend or at a support level. Candle 1 is a modest red candle that continues the decline. Candle 2 opens at or below candle 1's close (often with a small gap down), sellers try to push the price even lower — and then buyers flood in and drive the close up above candle 1's open. The result: a big green body that completely surrounds the small red body that came before it.
The visual message is blunt. Sellers were in charge, then in a single session buyers not only stopped the fall but reversed the entire prior candle and closed higher than where that candle had even begun. Momentum has, at least for now, changed hands.
A worked example (with the actual numbers)
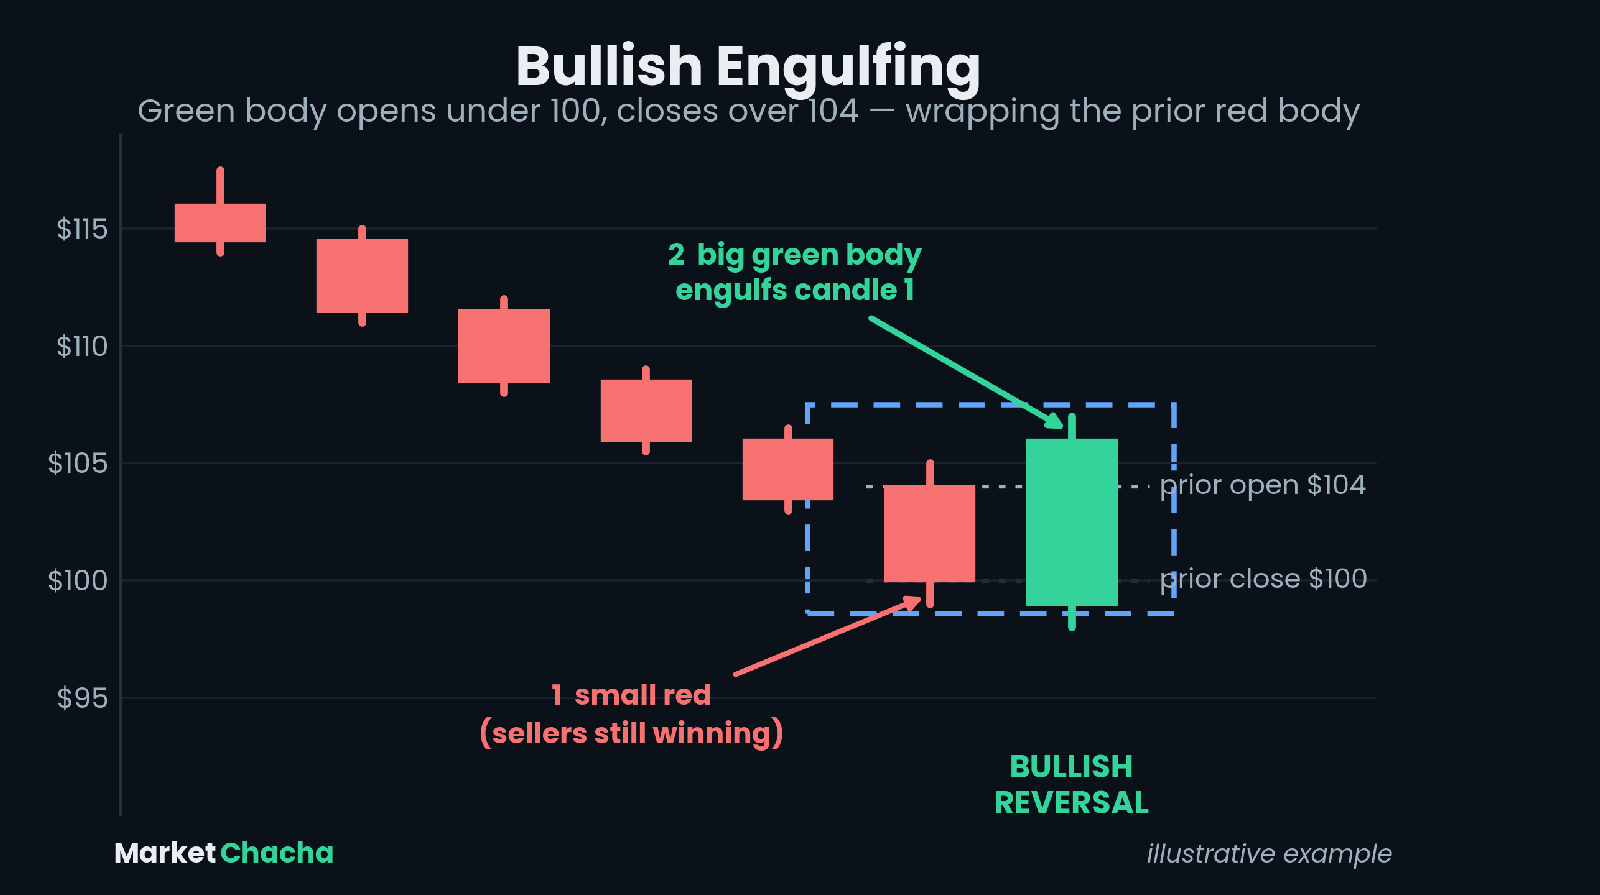
Imagine a stock drifting down toward $100 support. Watch two days:
- Day 1 (red): opens at $104, closes at $100. Its real body spans $100 to $104 — a normal down day.
- Day 2 (green): opens at $99 (a touch below Day 1's $100 close, so sellers looked to be winning again), but buyers take over and it closes at $106.
Now compare the bodies. Day 2's body runs from $99 to $106. Day 1's body ran from $100 to $104. Because $99 is below $100 and $106 is above $104, Day 2's body completely engulfs Day 1's body. That is a textbook bullish engulfing. In plain English: the entire prior day's decline was wiped out in one session — and then some. Anyone who sold near the lows is now offside, and their buying-back can add fuel to the move.
Bearish engulfing: the mirror image at the top
The bearish engulfing is the same idea flipped upside down, and it appears after an uptrend or at resistance. Candle 1 is a small green candle continuing the rally. Candle 2 opens at or above candle 1's close, buyers try to extend the gains, but sellers slam it down to close below candle 1's open — a large red body swallowing the prior green one.
Using mirror numbers: Day 1 (green) opens $100 and closes $104; Day 2 (red) opens $105 and closes $99. Day 2's body ($105 down to $99) fully engulfs Day 1's body ($100 to $104). The rally's most recent up-day has been erased in a single red candle — a classic warning that the uptrend may be running out of buyers.
Why the pattern works: the story in two candles
An engulfing candle is really a handoff of control compressed into one bar. On the bullish version, the prior candle shows sellers still nudging price lower. The engulfing candle opens even weaker — bears feel confident — and then buyers appear in size and don't stop until the price is above where the whole prior session started. The large body signals conviction: it took real, one-sided buying pressure to travel that far. Traders who were short into the low now face losses, and some will buy to cover, which pushes price further in the new direction. That reflexive squeeze is a big part of why the pattern can mark a turn.
What makes an engulfing signal stronger
Not every engulfing candle is worth the same. Reliability improves when several of these line up:
- A clear prior trend. The pattern is a reversal signal — so there must be something to reverse. An engulfing candle in the middle of a flat, choppy range is mostly noise.
- A large engulfing body. The bigger the second candle relative to the first (and to recent candles), the more decisive the shift.
- Above-average volume on the engulfing candle, which shows the takeover was backed by broad participation rather than a thin, random tick.
- Higher timeframes. A daily or weekly engulfing carries more weight than a one-minute one, because it summarises a full session of collective decision-making.
- Follow-through confirmation. Many traders wait for the next candle to close beyond the engulfing candle's extreme before trusting the signal.
How reliable is "reliable"? In Thomas Bulkowski's Encyclopedia of Candlestick Charts, the bearish engulfing acted as a reversal in roughly four out of five cases in a large historical sample — respectable, but far from a guarantee. Even the best candlestick patterns fail a meaningful share of the time, which is exactly why context and confirmation matter.
Common mistakes beginners make
- Demanding that the wicks be engulfed too. The classic rule is body-engulfs-body. A pattern where the second body covers the first body is valid even if the prior candle's shadow pokes out; requiring the whole range to be swallowed makes you miss most genuine signals.
- Trading engulfings with no trend. Without a prior move, there is nothing to reverse, and the "signal" is just two random opposite candles.
- Ignoring size. A tiny green candle engulfing an even tinier red one is technically a pattern but tells you almost nothing.
- Treating it as certainty. No candlestick pattern is a promise. A sizeable fraction fail, so the pattern is a clue, not a conclusion.
- Confusing it with a harami. An engulfing is a big candle wrapping a small prior one. A harami is the reverse — a small candle sitting inside the previous large body. They mean different things.
How to actually read it (without over-trusting it)
Think of an engulfing candle as one input among several, not a trigger on its own. It is most informative when it forms at a level that already matters — a support zone for a bullish engulfing, a resistance zone for a bearish one — and when volume and the following candle agree. Traders commonly treat the low of a bullish engulfing (or the high of a bearish one) as the point that would invalidate the read: if price closes back through it, the momentum shift the pattern implied has failed. That is a way of framing risk, not a recommendation to trade.
The healthiest mindset is probabilistic. A well-formed engulfing pattern, in the right place, with volume and confirmation, tilts the odds — it does not fix the outcome. Combine it with the broader trend, key levels and your own risk rules rather than acting on the two candles alone.
FAQ
What is a bullish engulfing candlestick pattern in simple terms? It is a two-candle signal where a big green (up) candle's body completely covers the previous small red (down) candle's body, after a decline. It suggests buyers have taken control and the price may be turning up.
Does the engulfing candle have to cover the wicks too? No. In the classic Japanese-candlestick definition, only the real body (open-to-close) needs to be engulfed. The thin wicks/shadows are ignored, so a valid pattern can leave the prior candle's shadow sticking out.
What is the difference between a bullish and bearish engulfing pattern? A bullish engulfing is a green candle engulfing a prior red one after a downtrend (a potential bottom). A bearish engulfing is a red candle engulfing a prior green one after an uptrend (a potential top). They are mirror images.
How reliable is the engulfing pattern? It is one of the more respected two-candle reversals, but it is not a guarantee — historical studies show it fails a meaningful fraction of the time. Reliability rises with a clear prior trend, a large body, strong volume, a higher timeframe and follow-through on the next candle.
What timeframe works best for engulfing patterns? Daily and weekly charts are generally considered more reliable than very short intraday charts, because each candle reflects a fuller session of buying and selling rather than short-lived noise.
Is an engulfing pattern the same as a harami? No — they are opposites. An engulfing pattern is a large candle that wraps around a small prior one. A harami is a small candle contained inside the previous large candle's body.
Educational content only — not investment advice, and not a recommendation to buy or sell any security. Chart patterns are probabilistic signals that regularly fail; they are not predictions. Sources: Investopedia — Bullish Engulfing, Steve Nison, Japanese Candlestick Charting Techniques, and Thomas Bulkowski, Encyclopedia of Candlestick Charts. Always do your own research.
This article is for educational and informational purposes only. It is not financial advice, investment recommendation, or a solicitation to buy or sell securities. Investing involves significant risks. I am not a SEBI-registered investment advisor. Readers should consult their own financial advisor and conduct their own research before making any investment decisions.
Comments
Join the conversation
Sign in to join the conversation.
Follow replies, add your view, and take part in the discussion.
Sign in to commentLoading comments...