

What is the debt-to-equity ratio — and how much debt is too much? (Beginner's In-Depth Guide)
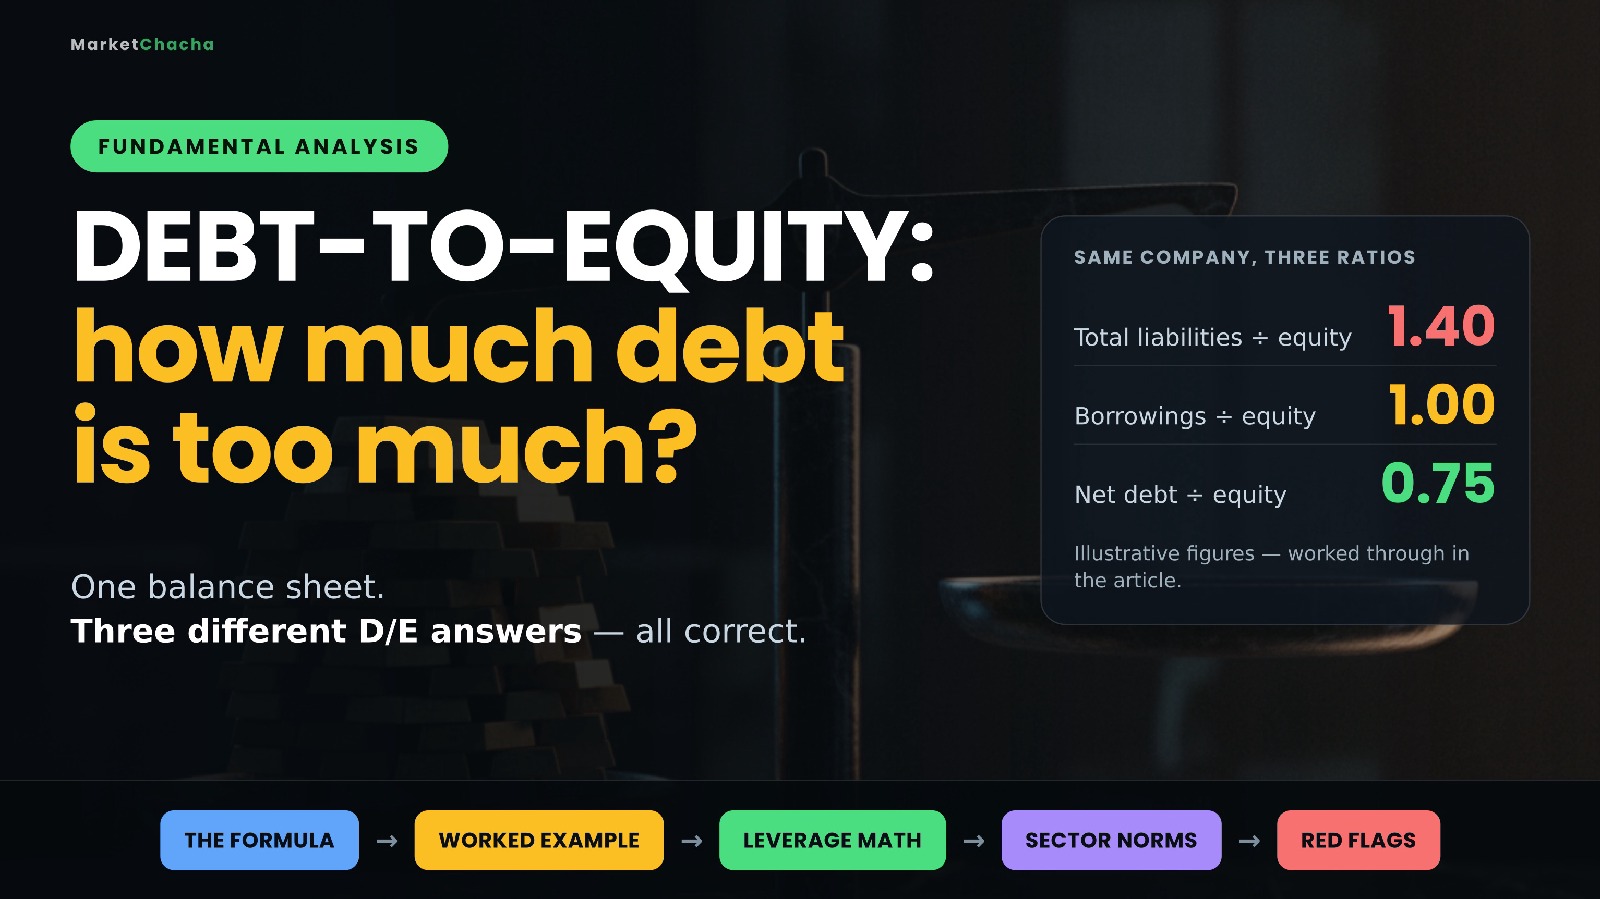
The debt-to-equity ratio (D/E) tells you how much of a business is funded by borrowed money versus money the shareholders own. It is one division: what the company owes, divided by shareholders' equity. A D/E of 1.0 means lenders and shareholders have put in roughly the same amount; 0.3 means the company is mostly owner-funded; 3.0 means there is three times as much debt as equity behind the business. Debt is not automatically bad — it is the cheapest way to grow when things go well, and the fastest way to fail when they don't.
This guide covers the formula and why two websites can give you two different D/E figures for the same company, a full worked example, the arithmetic of why leverage cuts both ways, what counts as "normal" by industry, and the three companion ratios that stop D/E from misleading you.
The formula — and why the same company can have three different D/E ratios
The denominator is never in dispute: total shareholders' equity, the bottom-line "net worth" of the company, which is share capital plus retained earnings (roughly, total assets minus total liabilities).
The numerator is where people quietly disagree. There are two mainstream definitions, and both are legitimate:
- Total liabilities ÷ equity. Everything the company owes — borrowings, but also trade payables, accrued expenses, deferred tax and provisions. This is the definition used by, among others, CMC Markets.
- Total debt ÷ equity. Only interest-bearing borrowings: short-term loans, the current portion of long-term debt, bonds and — depending on the analyst — lease liabilities, which IFRS 16 and Ind AS 116 now place on the balance sheet. Wall Street Prep defines total debt as "short-term borrowings, long-term debt, and any debt-like items on the company's balance sheet."
CMC Markets is explicit that the choice is a real fork in the road: "Some analysts prefer to use only interest-bearing debt rather than total liabilities. This variation excludes items like accounts payable and accrued expenses." Both are defensible. Total liabilities captures every obligation; interest-bearing debt isolates the financing decision management actually made.
There is a third common variant, net debt-to-equity, which subtracts cash and cash equivalents from debt first, on the logic that a company sitting on a large cash pile could repay some of its borrowings tomorrow if it chose to.
A worked example: one balance sheet, three answers
Take an illustrative manufacturer. Its balance sheet shows:
- Trade payables and accrued expenses: $30m
- Short-term borrowings and current portion of long-term debt: $20m
- Long-term debt: $80m
- Other liabilities (deferred tax, provisions): $10m
- Total liabilities: $140m
- Shareholders' equity: $100m
- Cash and equivalents: $25m
Now run the three calculations:
- Total liabilities ÷ equity = $140m ÷ $100m = 1.40
- Interest-bearing debt ÷ equity = ($20m + $80m) ÷ $100m = 1.00
- Net debt ÷ equity = ($100m − $25m) ÷ $100m = 0.75
Same company, same day, three ratios ranging from 0.75 to 1.40 — and none of them is wrong. This is the single most useful thing a beginner can learn about D/E: before you compare two companies, check that the number came from the same definition. Comparing one screener's 1.40 against another's 1.00 is comparing nothing at all.
Why companies borrow at all: the leverage arithmetic
Debt is not there to make accountants nervous. It is there because equity is generally more expensive than debt, because interest is usually tax-deductible while dividends are not, and because borrowing lets a fixed amount of shareholder money control a larger business. The mechanic is worth seeing as numbers.
Imagine two identical businesses, each with $200m of assets earning the same operating profit. Steady Co is funded entirely by $200m of equity — D/E of 0.00. Levered Co is funded by $100m of equity plus $100m of debt at 8% interest, so it pays $8m of interest a year — D/E of 1.00. Tax is ignored throughout, which if anything understates the advantage of debt.
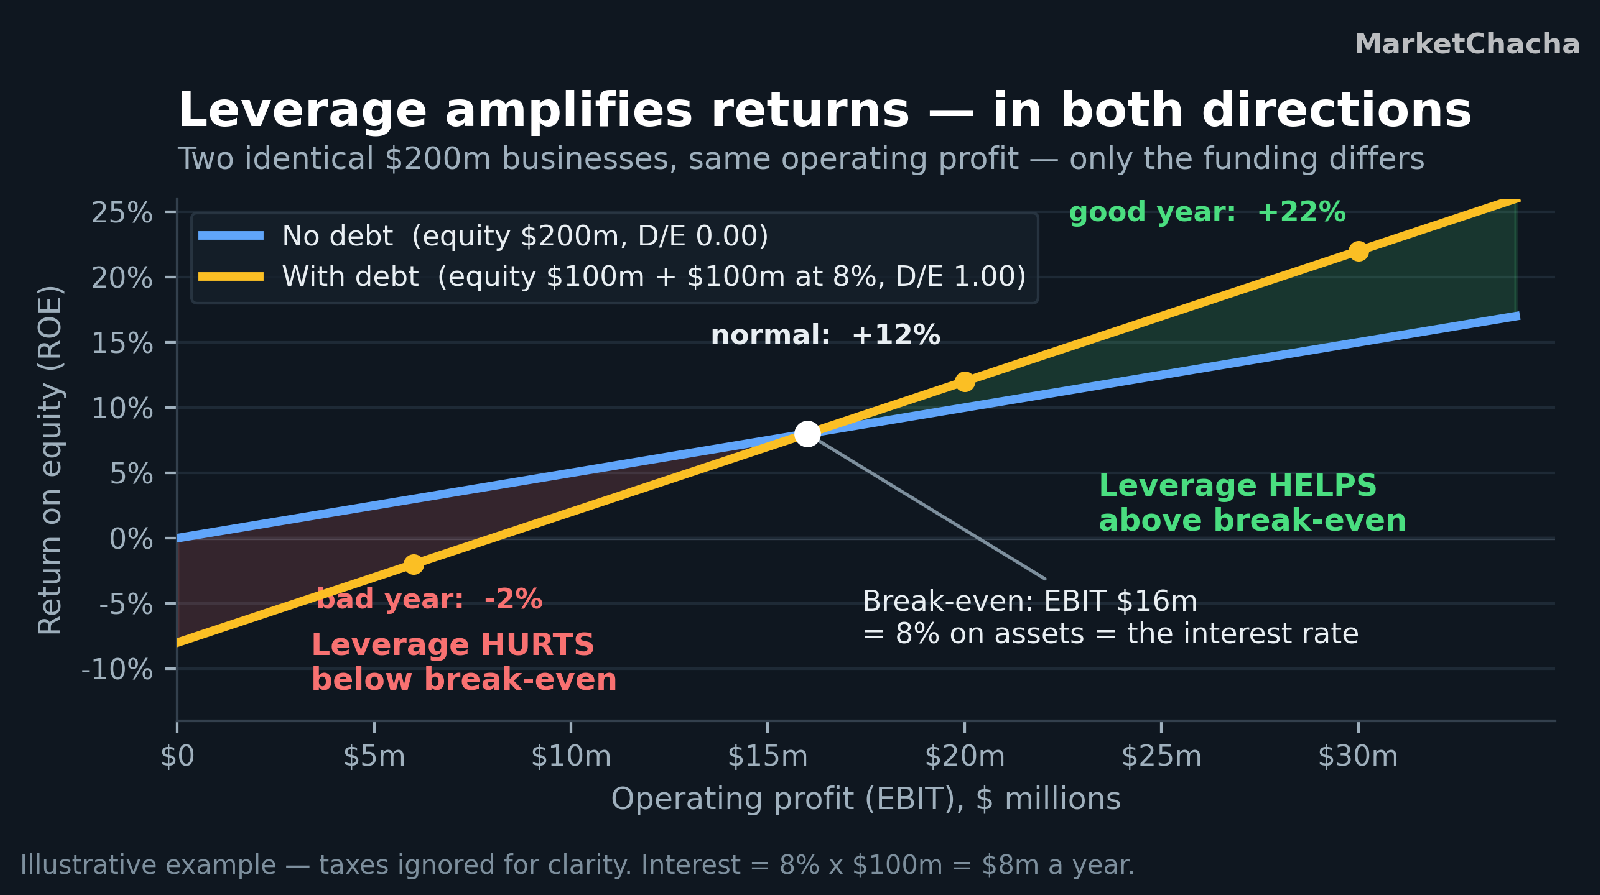
- A good year, EBIT $30m. Steady Co earns 30 ÷ 200 = 15.0% on equity. Levered Co earns (30 − 8) ÷ 100 = 22.0%.
- A normal year, EBIT $20m. Steady Co: 20 ÷ 200 = 10.0%. Levered Co: (20 − 8) ÷ 100 = 12.0%.
- A bad year, EBIT $6m. Steady Co still earns 6 ÷ 200 = 3.0%. Levered Co earns (6 − 8) ÷ 100 = −2.0% — a loss, on a business that was still profitable at the operating line.
The crossover point is the whole lesson. The two lines meet at EBIT of $16m, which is exactly an 8% return on the $200m of assets — the same 8% the debt costs. Leverage adds to shareholder returns only when the business earns more on its assets than it pays on its borrowings. Below that, every rupee or dollar of debt subtracts. And the interest bill does not shrink in a bad year; it is contractual, which is precisely why leverage turns a mild downturn into a loss.
What is a "good" debt-to-equity ratio?
There is no universal number, and anyone who gives you one is skipping the important part. What is normal depends almost entirely on the industry, because industries differ in how predictable their cash flows are and how much hard collateral they own. Capital City Training's guide puts typical FTSE 350 gearing below 50%, with equity investors starting to pay attention above 100%.
CMC Markets publishes these indicative ranges on a total-liabilities basis (retrieved September 2026), which are useful as orientation rather than as thresholds:
- Technology: roughly 0.0 to 0.5 — asset-light, volatile revenue, little to pledge as collateral
- Manufacturing and retail: roughly 0.5 to 1.5
- Utilities: roughly 1.0 to 2.0 — regulated, highly predictable cash flows support more debt
- Financial services: 2.0 to 10.0 and above
That last line is not a warning sign; it is the business model. A bank's "debt" is largely customer deposits, which are its raw material. Capital City Training gives HSBC as an example of a bank running above 11x. Banks and non-bank lenders are supervised through capital-adequacy rules instead, so D/E is simply the wrong tool for them.
D/E alone is not enough: the three numbers that finish the story
D/E is a snapshot of the balance sheet. It says nothing about whether the company can actually service that debt out of profits — and servicing, not size, is what causes defaults. Three companion ratios do the rest of the work — the card below numbers all four together, with D/E as the first.
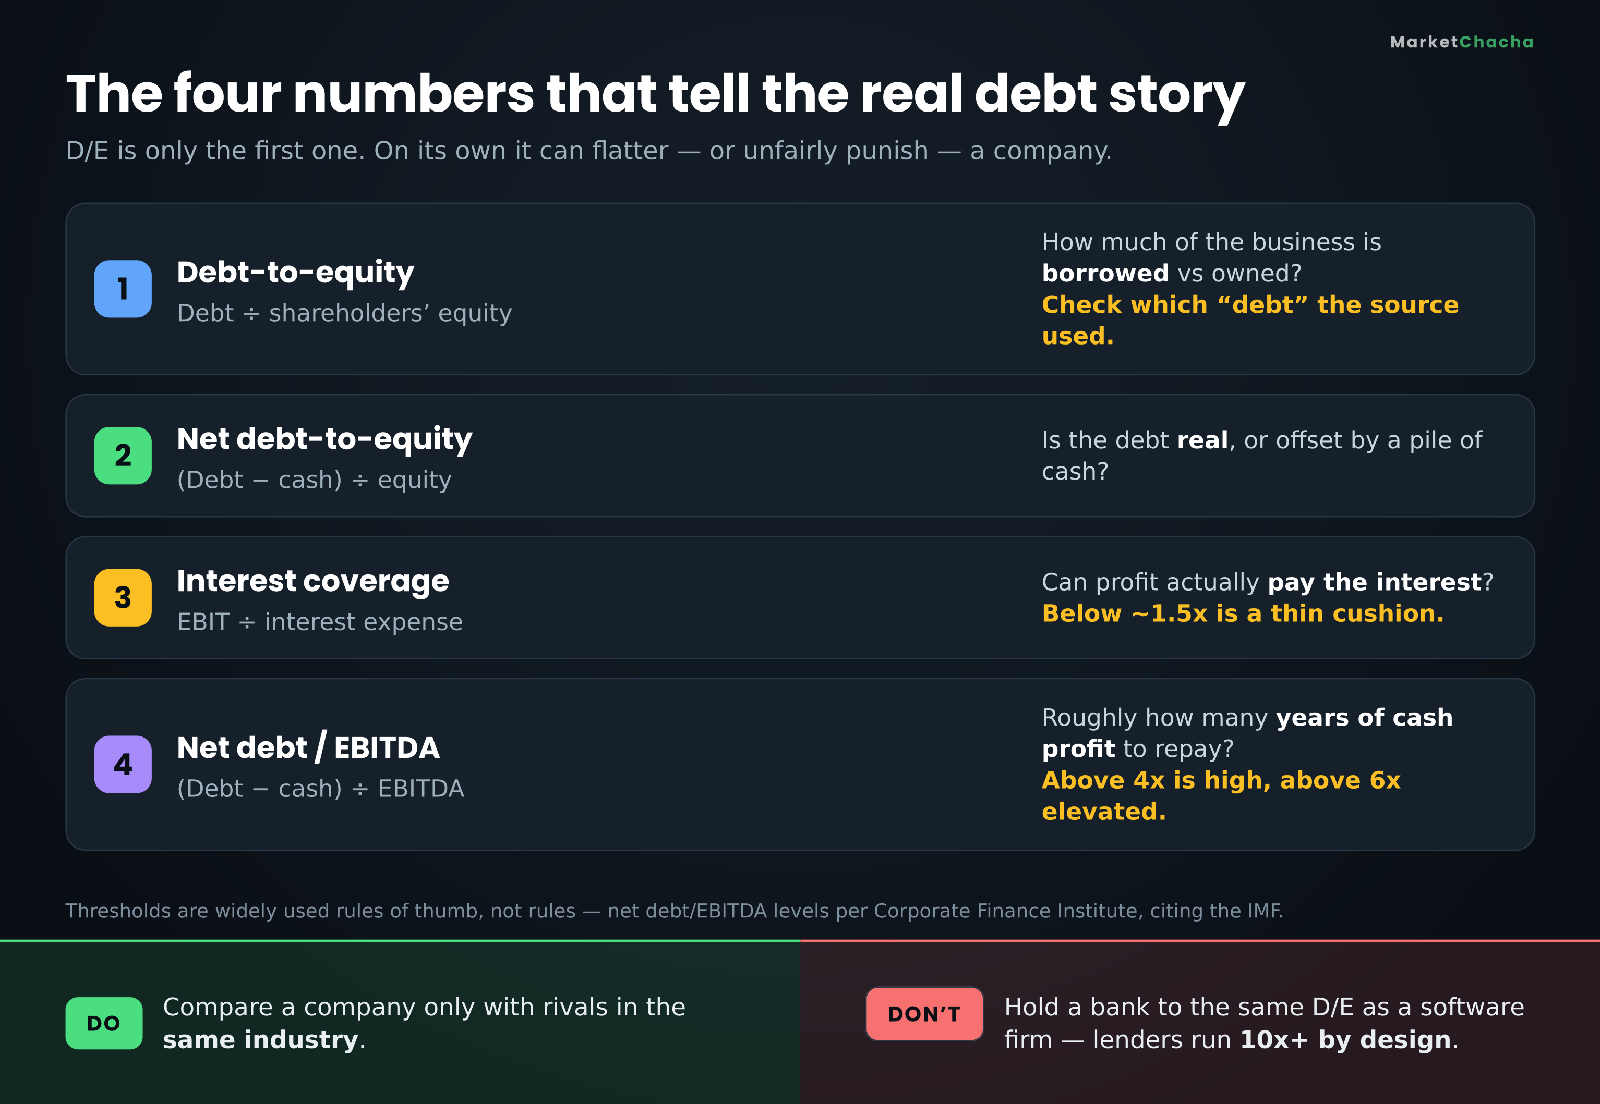
Interest coverage is operating profit divided by interest expense — how many times over the profits cover the interest bill. Wall Street Prep describes the EBIT version as the conservative, most commonly used measure. In our example above, Levered Co's coverage is 3.75x in the good year, 2.5x in the normal year, and 0.75x in the bad year — below 1.0x, meaning operating profit no longer covers the interest at all. Below roughly 1.5x, the cushion is thin.
Net debt-to-EBITDA asks roughly how many years of cash operating profit it would take to clear the debt. Corporate Finance Institute, citing the IMF, notes that ratios above 4 are high and above 6 are elevated. It is the ratio credit analysts reach for first, and it is far more comparable across companies than D/E because it does not depend on the accounting quirks of the equity line.
Net debt itself — total debt minus cash — answers whether the borrowing is real. A company with $100m of debt and $95m of cash is in a very different position from one with $100m of debt and nothing in the bank, even though both may report the same D/E.
Where the debt-to-equity ratio quietly misleads you
- Buybacks shrink the denominator. When a company buys back its own shares it pays out cash and reduces equity — Financial Edge Training's worked example shows equity falling from 280,000 to 265,000 after a 15,000 buyback. Debt unchanged, equity smaller, D/E higher. A rising D/E can mean rising risk, or it can just mean the company returned cash to shareholders.
- Negative equity breaks the maths entirely. Years of losses, or buybacks larger than accumulated retained earnings, can push equity below zero. The ratio then comes out negative and is meaningless — not "very low risk". Ignore it and go straight to interest coverage and net debt/EBITDA.
- Leases. Under IFRS 16 and Ind AS 116, lessees put almost all leases on the balance sheet as a right-of-use asset and a lease liability. That means a retailer with hundreds of leased stores now reports large liabilities that used to be invisible footnotes. Whether a given screener counts lease liabilities as "debt" varies.
- Equity is a historical-cost number. Book equity reflects what was paid for assets years ago, not what they are worth now. A company with decades-old but valuable land can look far more leveraged on paper than it really is.
- Pension deficits and guarantees. Capital City Training suggests calculating D/E twice where pension liabilities are material — once with, once without.
How to check a company's debt in five minutes
- Open the balance sheet, not a summary box. Find short-term borrowings, current portion of long-term debt, long-term debt and lease liabilities. Add them up. That is your debt figure, and now you know exactly what is in it.
- Divide by total shareholders' equity. That is your D/E. Subtract cash first for the net version.
- Go to the income statement for interest expense and divide operating profit by it. Coverage under about 1.5x deserves an explanation.
- Compare only with direct competitors — same industry, same accounting standard, same definition of debt.
- Look at the trend across three to five years. A steady 1.2 is a business model. A ratio that has gone 0.4, 0.7, 1.3 in three years is a story you need to understand.
- Read the debt note in the annual report for maturity dates and covenants. A company with a manageable ratio but a large repayment due next year has a timing problem the ratio cannot show.
Common mistakes beginners make
- Comparing D/E across industries. A utility at 1.8 may be safer than a software firm at 0.9.
- Assuming zero debt is best. A debt-free company earning 25% on its assets is arguably leaving shareholder returns on the table. Zero debt is a choice, not a virtue.
- Mixing definitions. Comparing a total-liabilities D/E with an interest-bearing D/E, or a standalone figure with a consolidated one.
- Treating D/E as a valuation tool. It measures risk and financing structure, not whether a share is cheap.
- Ignoring the maturity wall. Total debt matters less than when it has to be repaid and at what interest rate it will be refinanced.
How this looks in Indian markets
The mechanics are identical; the labels and the traps differ slightly. Most Indian screeners show a line simply called "Debt", which usually means borrowings rather than total liabilities — check the site's own definition before comparing its number with one from elsewhere. Ind AS 116, effective for Indian companies from 1 April 2019, brought leases onto the balance sheet in the same way IFRS 16 did globally, so lease-heavy sectors such as retail, aviation and hospitality show materially larger liabilities than they did before, with exemptions only for short-term and low-value leases.
Two India-specific checks are worth adding. First, standalone versus consolidated: a parent's standalone balance sheet can look conservative while debt sits in subsidiaries, so always read the consolidated statements. Second, promoter share pledging is a separate risk that never appears in the company's D/E at all — it is borrowing by the promoters against their shareholding, disclosed in the shareholding pattern, and it can force selling that hits the share price regardless of how healthy the company's own balance sheet is.
Finally, the same sector caveat applies with force: banks and NBFCs run high leverage by design and are regulated on capital-adequacy ratios rather than D/E, so screening Indian financials on debt-to-equity will simply return a list of every lender in the market.
FAQ
What is a good debt-to-equity ratio? There is no single good number — it depends on the industry. Indicative ranges are roughly 0.0-0.5 for technology, 0.5-1.5 for manufacturing and retail, and 1.0-2.0 for utilities, with financial firms far higher by design. Compare a company only with direct competitors.
Is a debt-to-equity ratio of 1.5 bad? Not on its own. It means the company has 1.5 times as much debt as equity, which would be unremarkable for a utility and aggressive for a software company. Check interest coverage and net debt/EBITDA before drawing a conclusion.
Does the debt-to-equity ratio include accounts payable? It depends which definition is used. The total-liabilities version includes payables and accrued expenses; the interest-bearing-debt version excludes them. This is why the same company can show two very different ratios on two different websites.
Why do banks have such high debt-to-equity ratios? Because customer deposits and borrowings are a bank's raw material, not a sign of distress — large banks can run above 10x. Banks are supervised through capital-adequacy rules instead, so D/E is not a meaningful screen for them.
Can the debt-to-equity ratio be negative? Yes, when shareholders' equity is negative after sustained losses or very large buybacks. A negative D/E is not a sign of safety — it means the ratio has broken down and you should use interest coverage and net debt/EBITDA instead.
What is the difference between debt-to-equity and net debt-to-equity? Net debt-to-equity subtracts cash and cash equivalents from debt before dividing. It shows how much borrowing would remain if the company used its cash pile to repay debt, which is often a fairer picture for cash-rich businesses.
Educational content only — not investment, tax or insurance advice, and not a recommendation of any product or company. All company figures in this article are clearly labelled illustrative examples, not real financial statements. Accounting standards, industry norms and rules of thumb change — always check the company's own filings before relying on any figure. [Sources: Wall Street Prep — Debt to Equity Ratio, Wall Street Prep — Interest Coverage Ratio, CMC Markets — Debt-to-equity ratio, Capital City Training — Debt-Equity Ratio, Corporate Finance Institute — Net Debt/EBITDA, Financial Edge — Share Buybacks, ClearTax — Ind AS 116 Leases]. Always do your own research.
This article is for educational and informational purposes only. It is not financial advice, investment recommendation, or a solicitation to buy or sell securities. Investing involves significant risks. I am not a SEBI-registered investment advisor. Readers should consult their own financial advisor and conduct their own research before making any investment decisions.
Comments
Join the conversation
Sign in to join the conversation.
Follow replies, add your view, and take part in the discussion.
Sign in to commentLoading comments...