

What is the Head and Shoulders Pattern? The Neckline, the Break & the Measured Target (Beginner's In-Depth Guide)
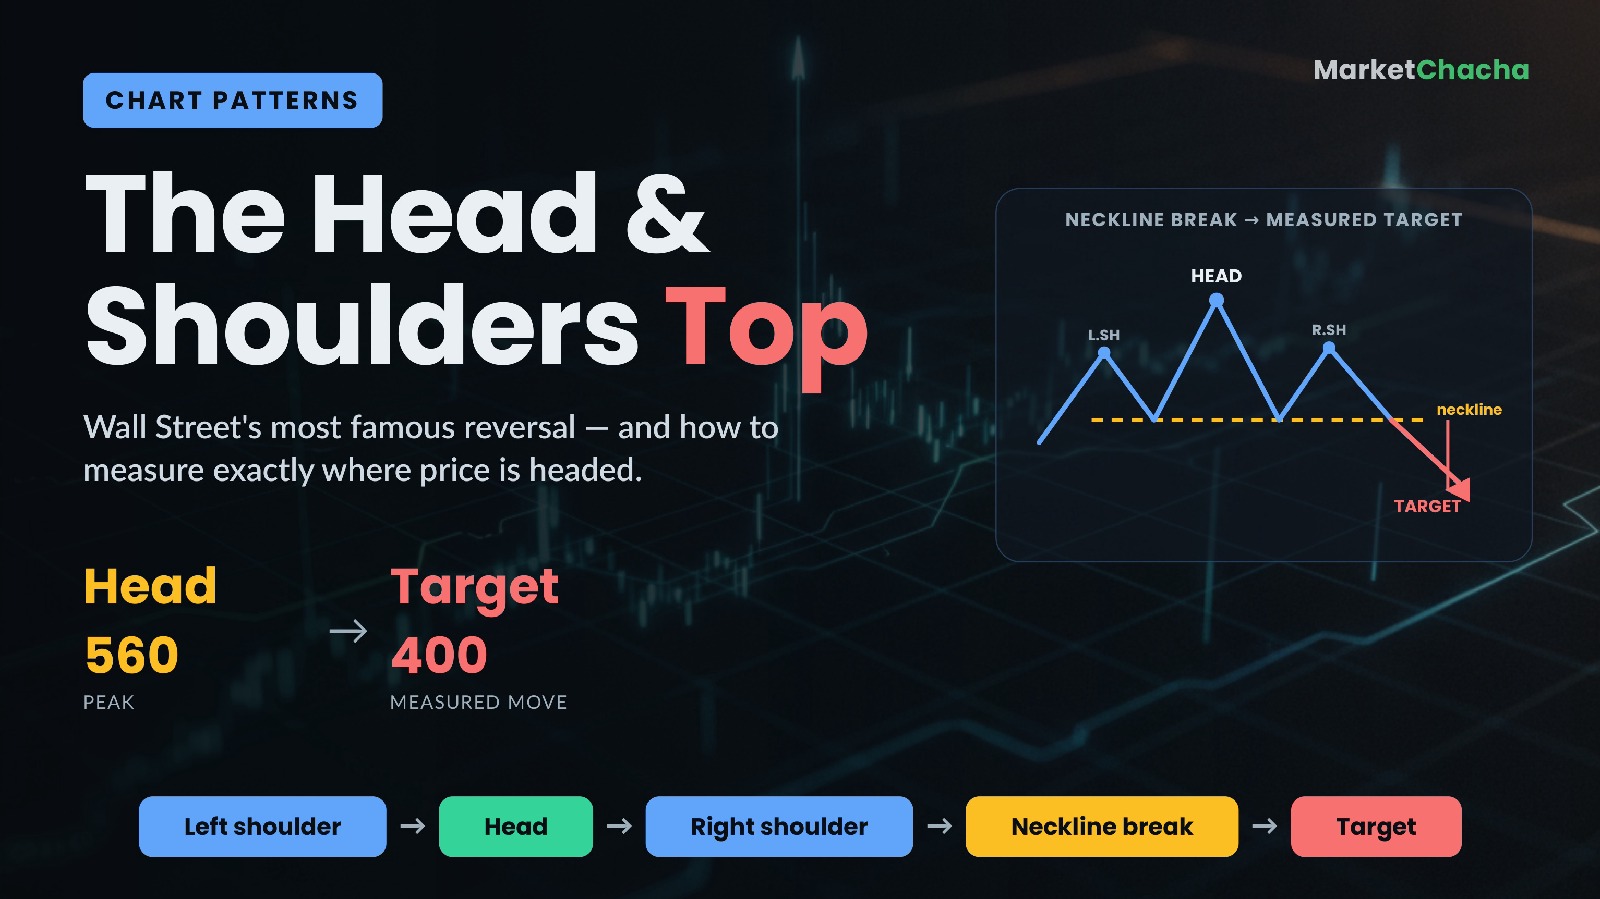
A head and shoulders pattern is a chart shape that warns an existing trend may be about to reverse. In its classic "top" form it appears after a rally as three peaks in a row — a smaller peak (the left shoulder), a taller peak (the head), and another smaller peak (the right shoulder) — all sitting on a shared support line called the neckline. When price finally closes below that neckline, the uptrend is considered broken and traders expect a move lower. This guide walks through every part of the pattern, shows the exact arithmetic used to estimate a price target, explains the role of volume, covers the bullish mirror image (the inverse head and shoulders), and lists the mistakes beginners make most often.
The three parts: left shoulder, head, right shoulder
Picture a stock that has been climbing for months. It makes a new high and then pulls back — that first peak and dip is the left shoulder. Buyers step in again and push price to an even higher high before it falls back once more — that taller middle peak is the head. Buyers try a third time, but this time they run out of steam and price tops out below the head, making a lower high roughly level with the first peak — that is the right shoulder. So the defining skeleton is simple: a peak, a higher peak, then a lower peak. The two shoulders are ideally similar in height, but they do not have to be perfectly symmetrical — they can differ in width and height. What matters is that the head is clearly the highest of the three and the right shoulder is a lower high.
Why it signals a reversal
The shape tells a story about supply and demand. Each peak is an attempt by buyers to drive price higher. The head is the last time they succeed in making a new high. When the next rally (the right shoulder) fails to reach the head, it is a visible sign that buying pressure is fading while sellers are becoming more willing to sell at lower prices. The pattern is only meaningful after a genuine prior uptrend — without an existing trend to reverse, three bumps on a chart mean nothing. Think of the neckline as the floor that has been holding price up on each dip. As long as that floor holds, bulls are still in control. The moment price decisively breaks through it, the balance has tipped toward sellers.
The neckline: the only line that really matters
The neckline is drawn by connecting the two reaction lows — the dip after the left shoulder and the dip after the head. It is the pattern's trigger line: the head and shoulders is not "complete" and the trend is not considered reversed until price closes beyond it. A neckline can be horizontal, slope up, or slope down, and the slope matters — a downward-sloping neckline is generally read as more bearish because price is already making lower lows as the pattern forms. One more useful behaviour: once broken, old support often flips into new resistance. Price sometimes rallies back up to retest the broken neckline from below (a "throwback" or "return move") before continuing lower. That retest can offer a second, lower-risk entry — but it does not always happen, so waiting for it can also mean missing the move.
A worked example: measuring the target
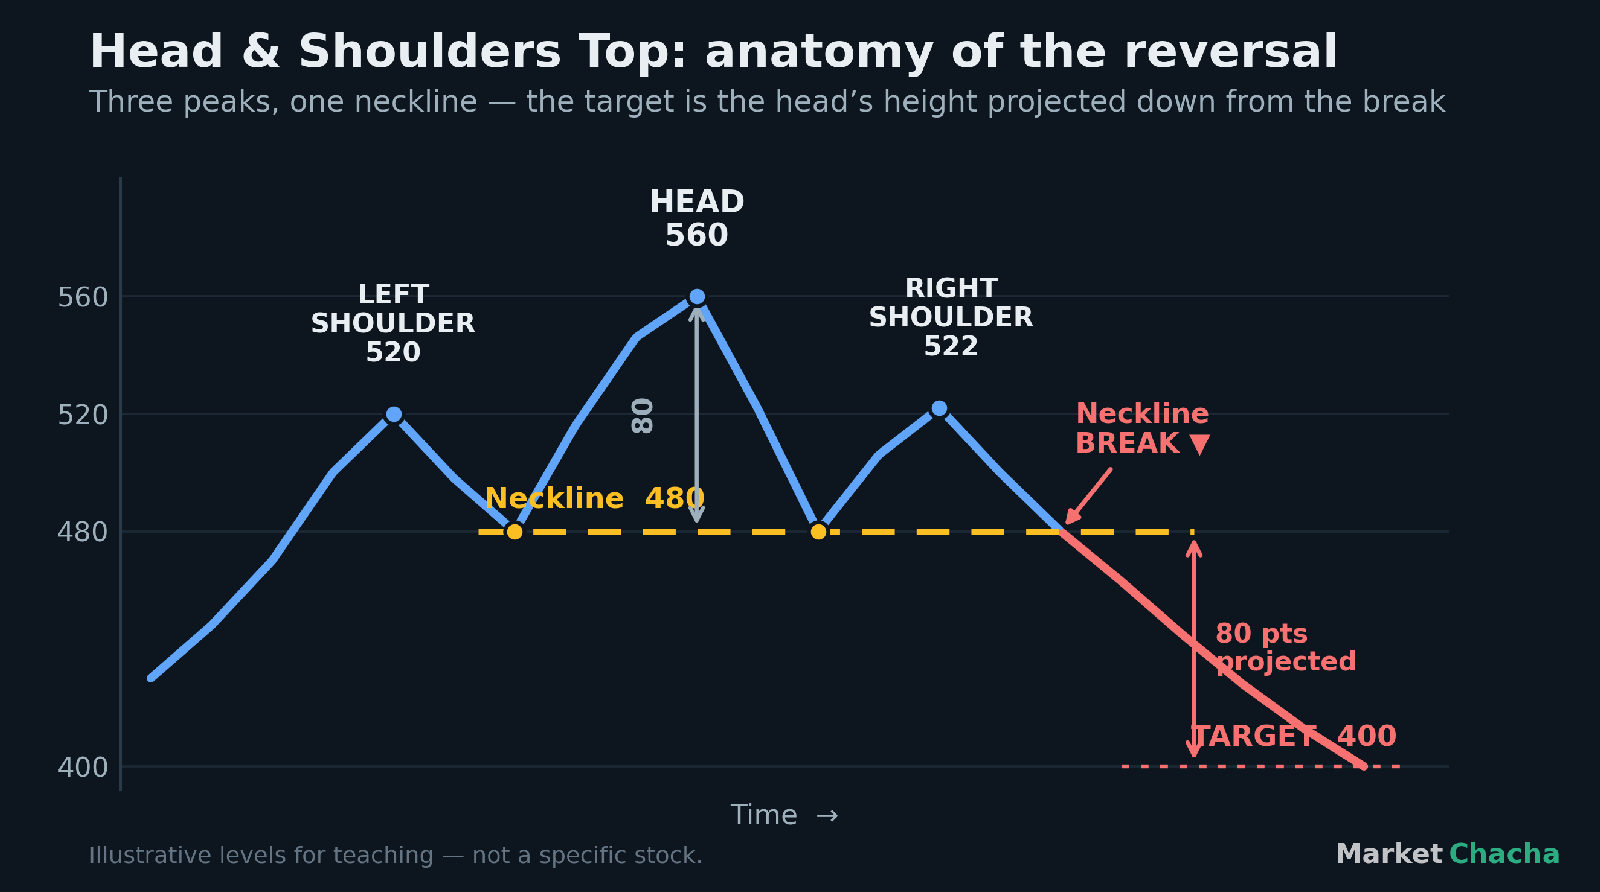
The pattern is popular partly because it comes with a built-in way to estimate how far price might fall. The rule: measure the height from the top of the head straight down to the neckline, then project that same distance downward from the point where price breaks the neckline. Using the numbers in the diagram above:
- Left shoulder peaks near 520; price dips to the neckline around 480.
- The head peaks at 560; price dips back to the neckline near 480 again.
- The right shoulder peaks at 522 (a lower high), then price rolls over.
- Height of the head above the neckline = 560 − 480 = 80 points.
- Price closes below the neckline at 480. Measured target = 480 − 80 = 400.
So the pattern projects a decline from the 480 breakout toward roughly 400. Two honest caveats: this is an estimate, not a promise — the classic teaching is to treat the target as a rough guide and watch for prior support levels, moving averages, or Fibonacci retracements that may halt the fall earlier. And measured moves work both as encouragement and as a reality check: if the potential reward to the target is small relative to where you'd place a protective stop, the trade may not be worth taking.
Volume: the tell that separates real from fake
Volume is the pattern's lie-detector. In a textbook head and shoulders top, trading volume is typically highest on the left shoulder, a little lower on the head, and lower still on the right shoulder — a quiet warning that fewer buyers are chasing each new push higher. The confirmation traders most want to see is a surge in volume on the neckline break: heavy selling as the floor gives way suggests real conviction rather than a random dip. When the break happens on thin, unconvincing volume, many analysts treat the signal as weaker and more prone to failing. Volume will not be perfect on every real-world chart, but a break with expanding volume is far more trustworthy than a quiet one.
The inverse head and shoulders (the bullish mirror)
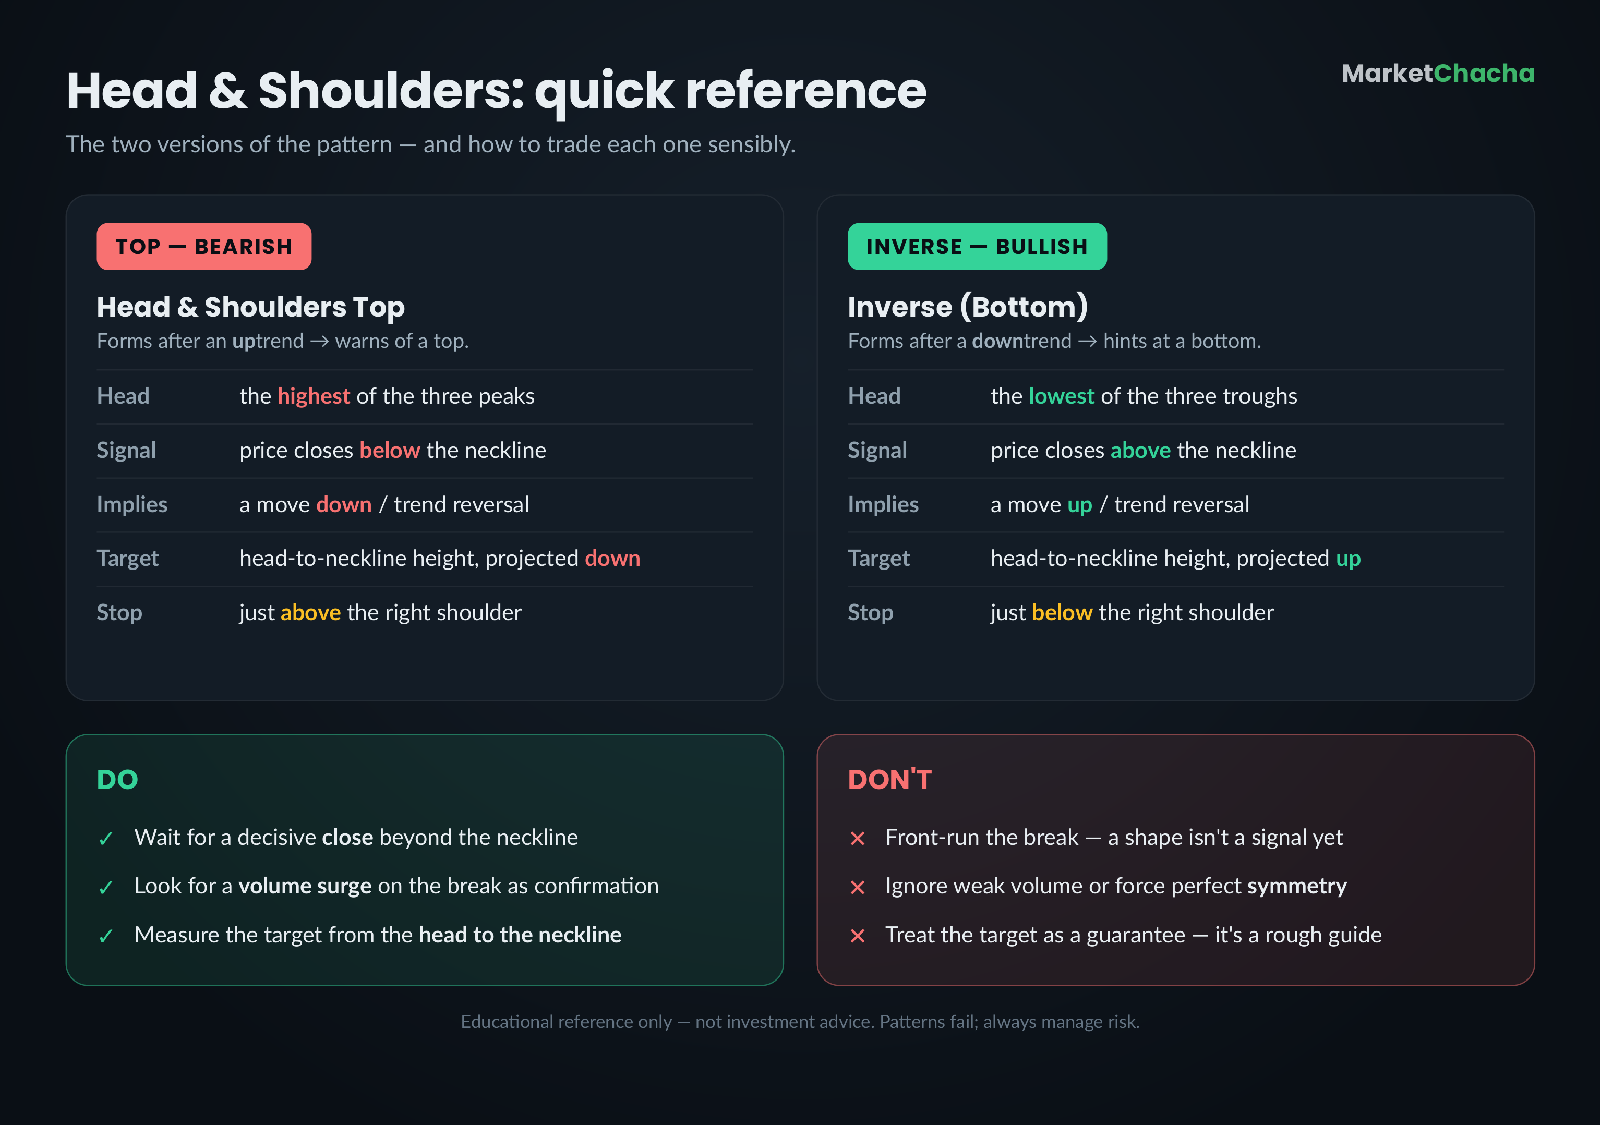
Flip the whole picture upside down and you get the inverse head and shoulders, also called a head and shoulders bottom. It forms after a downtrend and hints at a bottom. Instead of three peaks you get three troughs: a left shoulder low, a deeper low (the head), and a higher low (the right shoulder), joined by a neckline drawn across the two intervening highs. The signal fires when price closes above the neckline, ideally on rising volume, and the measured target is projected upward by the same head-to-neckline distance. Everything you learned about the top applies in reverse — which is why traders often learn them as a single pattern with two directions. The reference card below summarises both side by side.
How to actually trade it (sensibly)
Most disciplined traders follow a simple checklist. First, confirm there was a real prior trend to reverse. Second, wait for a decisive close beyond the neckline rather than acting on the shape alone — an unbroken neckline is just a drawing, not a signal. Third, prefer breaks that come with a jump in volume. Fourth, define risk before entering: on a top, a protective stop commonly sits just above the right shoulder (below it for an inverse); if price climbs back there, the pattern has likely failed. Finally, use the measured move to sanity-check the reward against that risk, and remember that a return move to the neckline can offer a second entry. None of this makes the pattern a sure thing — it simply turns a picture into a plan with defined risk.
Common mistakes beginners make
- Front-running the break. Selling (or buying the inverse) before price actually closes through the neckline. Many promising shapes never complete — the right shoulder can simply resume the trend.
- Ignoring the prior trend. A "head and shoulders" in the middle of a sideways range, with no real uptrend before it, has little meaning.
- Demanding perfect symmetry. Real shoulders are rarely identical. Insisting on a flawless, textbook shape means you'll miss most valid patterns.
- Treating the target as a guarantee. The measured move is a guide. Price may stop short at old support or blow past the target — manage the trade, don't just wait for a number.
- Skipping the volume check. A neckline break on weak volume fails more often. Confirmation matters.
How it shows up on Indian charts
The pattern is universal — it appears on the Nifty 50, the Sensex, and individual Indian stocks exactly as it does on US charts, because it reflects human behaviour rather than any local rule. Indian traders often watch for it on daily and weekly charts of index heavyweights and around major events (results season, budget days, RBI policy). The mechanics are identical: connect the two reaction lows for the neckline, wait for a close beyond it, confirm with volume, and project the head-to-neckline distance for a rough target. The only practical differences are the ones that apply to any Indian trade — things like circuit limits on individual stocks and settlement timing — not the pattern itself.
FAQ
Is a head and shoulders pattern bullish or bearish? The standard "top" is bearish — it forms after an uptrend and warns of a fall once the neckline breaks. Its mirror image, the inverse (or bottom) head and shoulders, is bullish and warns of the end of a downtrend.
How do you calculate the price target for a head and shoulders? Measure the vertical distance from the top of the head down to the neckline, then subtract that distance from the point where price breaks the neckline. In the worked example, a head at 560 over a neckline at 480 gives 80 points, so the target from the 480 break is 480 − 80 = 400.
When is the pattern actually confirmed? Only when price closes beyond the neckline — below it for a top, above it for an inverse — ideally on higher volume. Until then it is an unconfirmed shape that can still fail.
Do the two shoulders have to be the same size? No. Symmetry is preferred but not required; shoulders can differ in height and width. What matters is that the head is the highest peak (or lowest trough for an inverse) and the right shoulder is a lower high (or higher low).
Does a head and shoulders pattern always work? No chart pattern is guaranteed. Breaks can fail, price can reverse back through the neckline, and targets can fall short. That is why traders confirm with volume, define a stop, and size positions so a single failed pattern is survivable.
What time frame is best for spotting it? It appears on every time frame, but patterns on daily and weekly charts are generally considered more reliable than those on very short intraday charts, where noise produces more false signals.
Educational content only — not investment advice, and not a recommendation of any security. Chart patterns describe tendencies, not certainties, and can fail. Always do your own research and manage risk. [Sources: StockCharts ChartSchool — Head and Shoulders Top, Charles Schwab — Identifying Head and Shoulders Patterns].
This article is for educational and informational purposes only. It is not financial advice, investment recommendation, or a solicitation to buy or sell securities. Investing involves significant risks. I am not a SEBI-registered investment advisor. Readers should consult their own financial advisor and conduct their own research before making any investment decisions.
Comments
Join the conversation
Sign in to join the conversation.
Follow replies, add your view, and take part in the discussion.
Sign in to commentLoading comments...