

What is RSI (Relative Strength Index) — and why is an RSI above 70 not a sell signal?
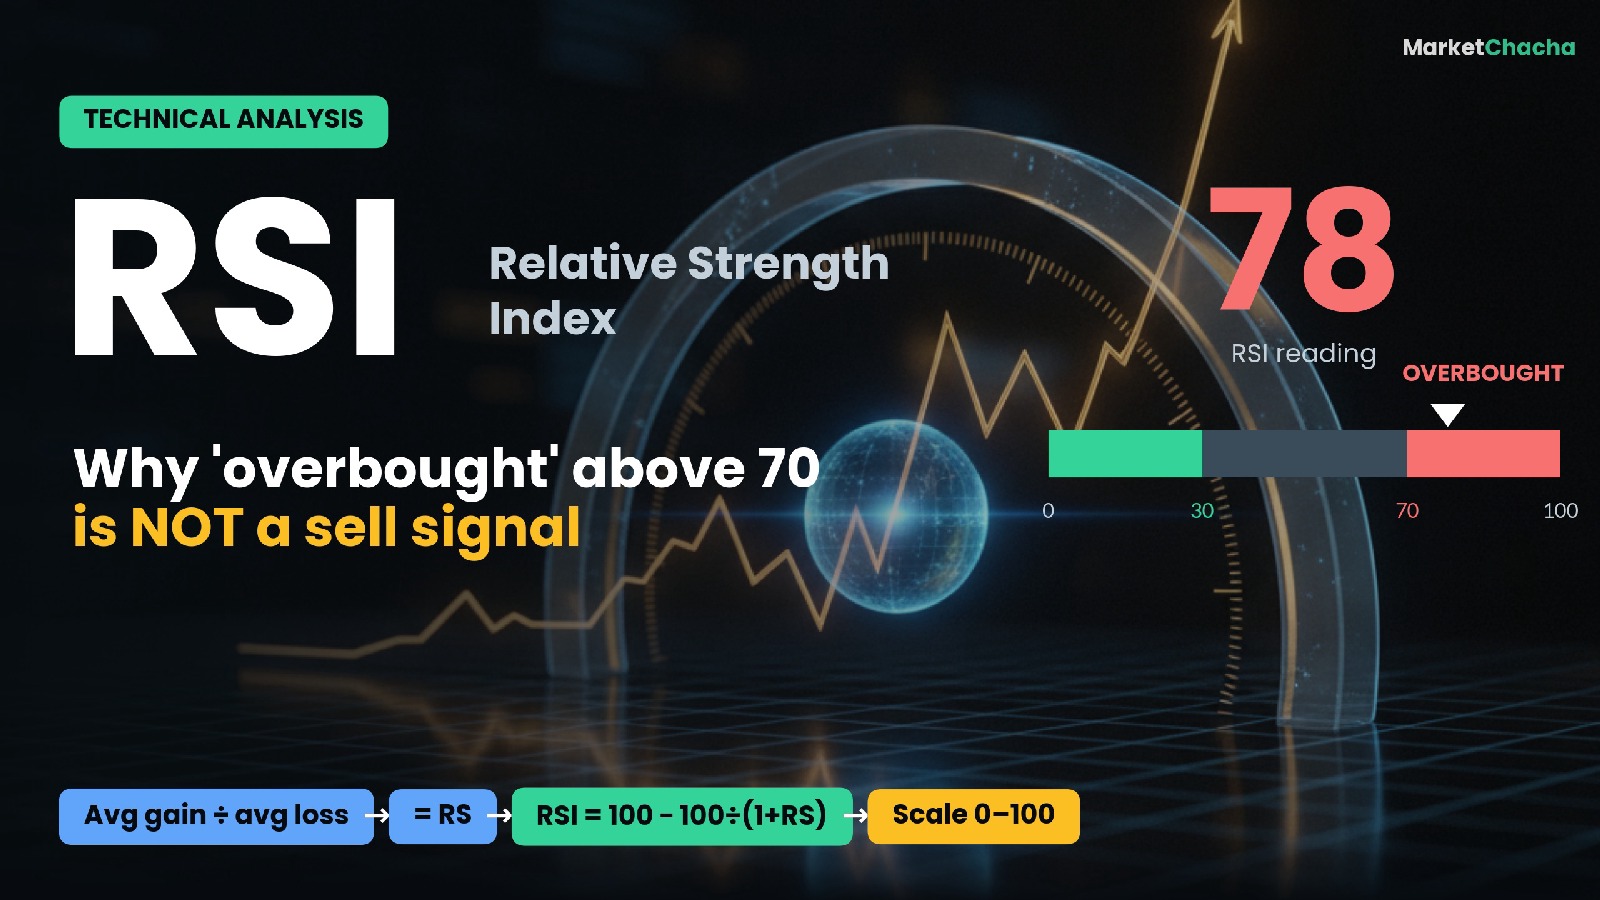
The Relative Strength Index (RSI) is a momentum indicator that measures how fast and how far a stock's price has moved recently, and squeezes that into a single number between 0 and 100. It compares the size of recent up-moves to recent down-moves: a high RSI means gains have dominated, a low RSI means losses have. Traders use it to gauge whether momentum is strong, weak, stretched (often called "overbought") or exhausted (often called "oversold"). It was created by J. Welles Wilder Jr. in his 1978 book New Concepts in Technical Trading Systems, and it is still one of the most widely used indicators on any charting platform.
This guide explains what RSI actually measures, the exact formula and a worked calculation, how to read the 30/50/70 levels, why a reading above 70 is not an automatic sell signal, what divergence is, and the mistakes beginners make. Everything here is illustrative and educational, not a recommendation to buy or sell anything.
What is the RSI, in plain English?
RSI is a momentum oscillator. "Oscillator" means it moves back and forth inside a fixed range — here, 0 to 100 — no matter how high or low the actual share price goes. "Momentum" means it is measuring the speed and strength of recent price changes, not the price itself or whether a company is cheap or expensive.
Think of it like a speedometer for buying pressure. If almost every recent day has closed higher, RSI climbs toward 100. If almost every recent day has closed lower, it falls toward 0. When up-days and down-days roughly balance, RSI sits near 50. Crucially, RSI tells you nothing about valuation, earnings, or fair value — a wildly overpriced stock and a bargain can both show an RSI of 75 if their recent momentum looks the same.
How is RSI actually calculated?
The core formula has two steps. First you calculate Relative Strength (RS), then you convert it into the 0–100 index:
- RS = Average Gain ÷ Average Loss, measured over a set number of periods (Wilder's default is 14).
- RSI = 100 − [ 100 ÷ (1 + RS) ]
For each period you look at the change from the previous close. If the price rose, that day's "gain" is the size of the rise and its "loss" is zero; if it fell, the "loss" is the size of the fall and the "gain" is zero. The first average gain and average loss are simple 14-period averages. After that, Wilder used a smoothing method so each new day mostly carries forward the old average:
- New Average Gain = [ (previous Average Gain × 13) + current Gain ] ÷ 14
- New Average Loss = [ (previous Average Loss × 13) + current Loss ] ÷ 14
Two things fall out of the maths. Because RSI is bounded by the formula, it can never go below 0 or above 100. And if there have been no down-days in the window, Average Loss is zero, RS is infinite, and RSI pins at exactly 100 — a sign of extremely one-sided momentum.
A worked example: calculating RSI step by step
Suppose that over the last 14 days a stock's average gain works out to 1.2 points and its average loss to 0.8 points. Then:
- RS = 1.2 ÷ 0.8 = 1.5
- RSI = 100 − [ 100 ÷ (1 + 1.5) ] = 100 − (100 ÷ 2.5) = 100 − 40 = 60
An RSI of 60 says up-moves have modestly outweighed down-moves — a mild bullish tilt, nowhere near overbought. Now roll forward one day and say the stock closes up by 2.0 points (so today's gain = 2.0, loss = 0). Apply Wilder's smoothing:
- New Average Gain = (1.2 × 13 + 2.0) ÷ 14 = 17.6 ÷ 14 = 1.257
- New Average Loss = (0.8 × 13 + 0) ÷ 14 = 10.4 ÷ 14 = 0.743
- RS = 1.257 ÷ 0.743 = 1.692
- RSI = 100 − [ 100 ÷ (1 + 1.692) ] = 100 − 37.1 = 62.9
One strong up-day nudged RSI from 60 to about 63 — not a violent jump. That gentle response is by design: the smoothing stops a single day from whipping the indicator around.
How to read RSI: overbought, oversold and the 50 line
Three reference levels do most of the work:
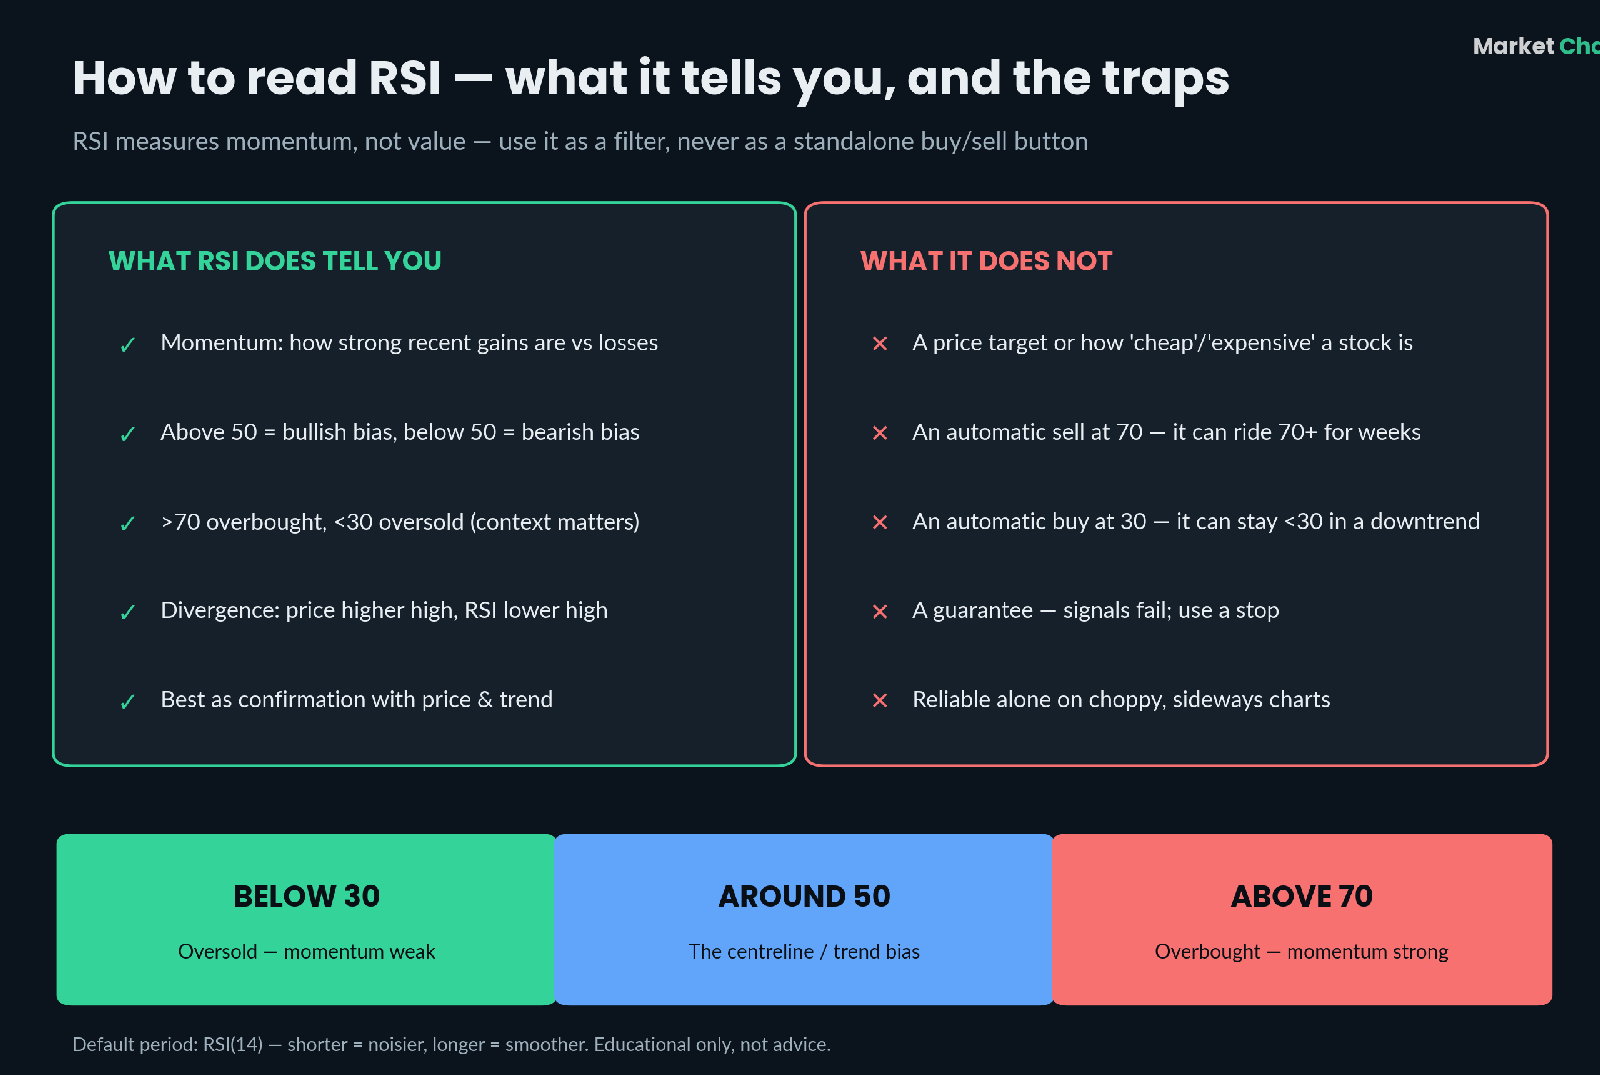
- Above 70 — "overbought." Recent gains have strongly outweighed losses. Momentum is powerful, and sometimes stretched, but strong is not the same as "about to fall."
- Below 30 — "oversold." Recent losses dominate. Momentum is weak, and sometimes exhausted — but weak is not the same as "about to bounce."
- The 50 centreline. Many traders treat RSI holding above 50 as a bullish momentum bias and below 50 as bearish. Some use the 50 line as the real signal and treat 70/30 as extremes.
The 70/30 defaults come from Wilder. Some traders tighten them to 80/20 to get fewer, stronger signals, or shift the bands in trending markets (more on that next).
Why RSI above 70 is not automatically a sell signal
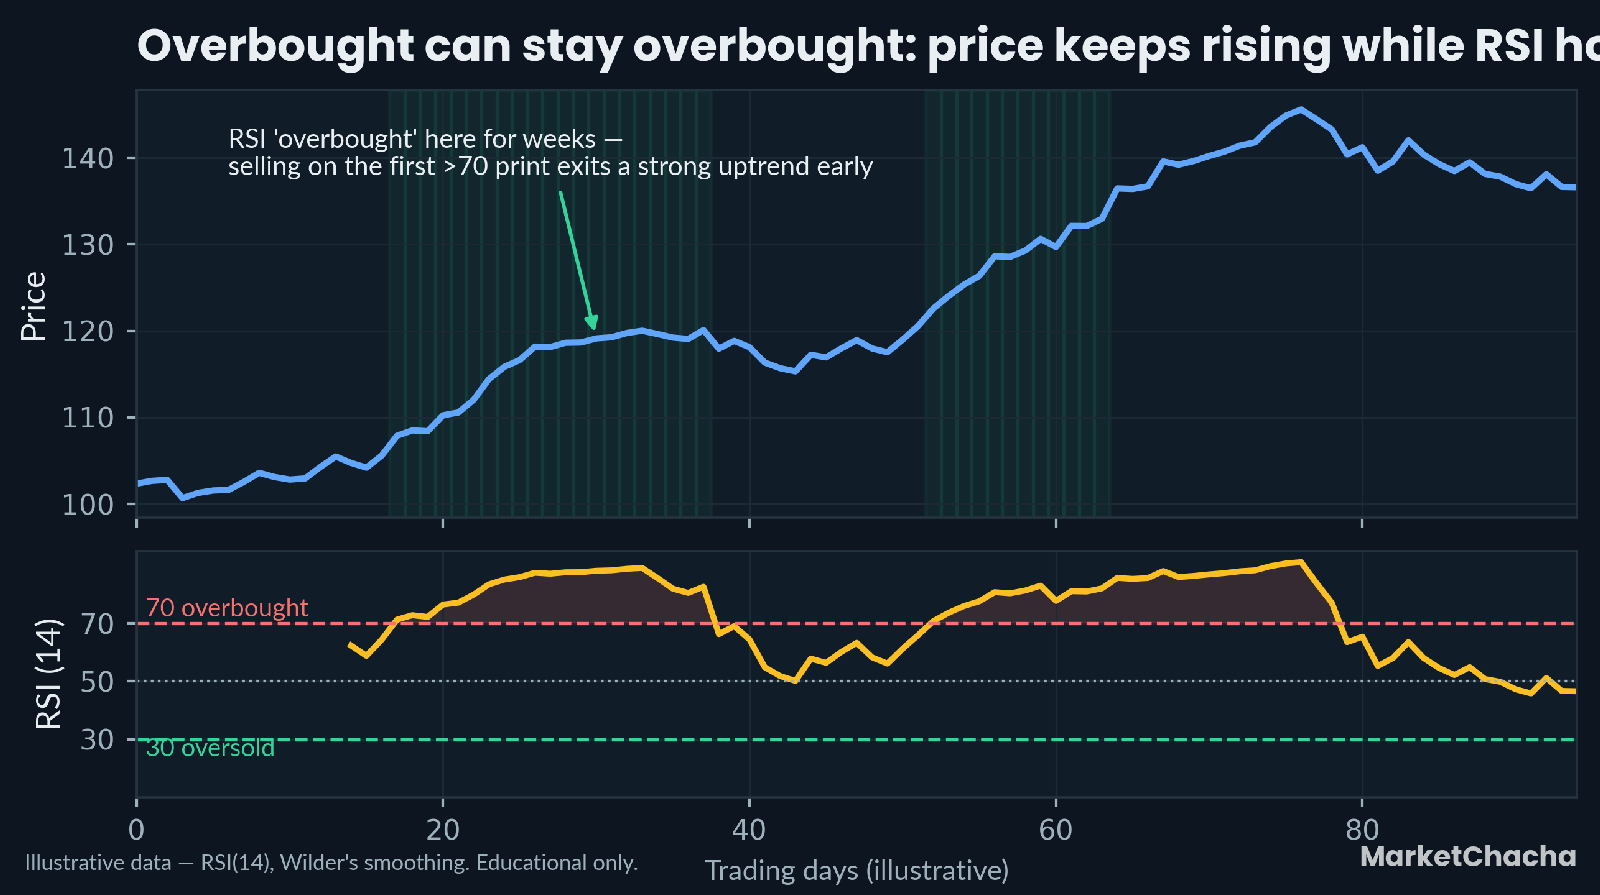
This is the single most common misunderstanding. "Overbought" sounds like "too high, sell now" — but the word only means momentum is strong. In a genuine uptrend, RSI can push above 70 and stay there for weeks while the price keeps climbing. A trader who sells the very first time RSI prints 71 often exits a powerful trend far too early and watches it run without them, as the chart above illustrates.
Some analysts (notably Constance Brown, and the widely cited StockCharts research) point out that RSI ranges actually shift with the trend: in strong bull phases RSI often oscillates roughly between 40 and 90, using 40–50 as support; in bear phases it tends to travel between 10 and 60, with 50–60 acting as a ceiling. In other words, the same "overbought" number means different things depending on the bigger trend. That is why RSI works best as a confirmation tool alongside price structure, trend and volume — not as a lone trigger. Overbought is a reason to pay attention, not an order to act.
RSI divergence: the signal many traders actually watch
Beyond the raw levels, the most respected RSI signal is divergence — when price and RSI disagree about momentum:
- Bearish divergence: price makes a higher high, but RSI makes a lower high. Price is still rising, yet the momentum behind it is fading — a possible warning that the trend is tiring.
- Bullish divergence: price makes a lower low, but RSI makes a higher low. Selling pressure is easing even as price drops — a possible sign of a turn.
Divergence is a heads-up, not a timing device. Trends can keep running long after divergence appears, so most traders wait for price itself to confirm (for example, breaking a short-term level) before acting.
Common mistakes beginners make with RSI
Most RSI mistakes come from treating a momentum gauge as a crystal ball:
- Selling the instant RSI hits 70 (or buying at 30). In a trend, extremes persist. The level is a flag, not a trigger.
- Using RSI alone. With no reference to trend, support/resistance or volume, RSI signals fire constantly and many fail.
- Trusting it in a flat, choppy market. RSI is most useful when there is a real trend or a clear range; in directionless chop it produces noise.
- Forgetting the settings matter. A shorter period (say 7) is jumpier and gives more signals; a longer period (21) is smoother and slower. Compare like with like.
- Confusing RSI with "Relative Strength." RSI compares a stock to its own past, not to the index or to other stocks. Comparing one stock against another is a different tool entirely.
How to actually use RSI in your process
A sensible beginner workflow treats RSI as one input among several:
- Establish the trend first using price and a moving average. RSI behaves differently in uptrends, downtrends and ranges.
- Use the 50 line for bias: above 50 leans bullish, below 50 leans bearish.
- Treat 70/30 as "pay attention," not "act." In a range, extremes can flag turning points; in a strong trend, expect them to persist.
- Watch for divergence as an early warning, then wait for price to confirm.
- Always define risk with a stop or position size, because any single indicator will be wrong regularly.
RSI on Indian stocks (NSE and BSE)
RSI is calculated exactly the same way on Indian stocks as anywhere else — it is pure price maths, so the 14-period default, the 70/30 levels and the formula are identical whether you are looking at a Nifty 50 name on the NSE or a stock on the BSE. Every mainstream Indian charting and broker platform (and free tools like TradingView or NSE charts) plots it out of the box. The one practical caution local to India: many small- and mid-cap stocks hit circuit limits (upper or lower price bands) and can trade thinly. When a stock is circuit-locked or barely trades, its recent price changes are distorted, so RSI — like any momentum indicator — becomes far less reliable on those names than on liquid large-caps.
FAQ
What does RSI mean in the stock market? RSI (Relative Strength Index) is a momentum indicator that scores recent price momentum from 0 to 100 by comparing the average size of up-moves to down-moves. High readings mean gains have dominated recently; low readings mean losses have.
Is an RSI above 70 a sell signal? Not by itself. Above 70 is called "overbought," which only means momentum is strong — and in an uptrend RSI can stay above 70 for weeks while price keeps rising. It is a flag to pay attention, best confirmed by trend, price structure or other tools before acting.
What is a good RSI number to buy at? There is no universal number. Some traders watch for RSI turning up from below 30 in a range, but in a downtrend RSI can stay below 30 for a long time, so "oversold" is not an automatic buy. RSI is a filter, not a standalone buy button.
What is the difference between RSI 14 and other settings? The 14 refers to how many periods the average gain and loss are measured over — Wilder's default. A shorter setting (e.g. 7) reacts faster and gives more, noisier signals; a longer one (e.g. 21) is smoother and slower. The 14-period version is the standard reference.
What is RSI divergence? Divergence is when price and RSI disagree. Bearish divergence is price making a higher high while RSI makes a lower high (fading momentum); bullish divergence is price making a lower low while RSI makes a higher low (easing selling). It is an early warning, not a precise timing signal.
Is RSI the same as Relative Strength? No. RSI compares a stock to its own recent price history. "Relative strength" (without "index") usually means comparing one stock's performance against an index or another stock — a completely different measure.
Educational content only — not investment advice and not a recommendation to buy or sell any security. Indicators can and do give false signals; always do your own research and manage risk. Sources: StockCharts ChartSchool — RSI, J. Welles Wilder Jr., New Concepts in Technical Trading Systems (1978), Investopedia — Relative Strength Index.
This article is for educational and informational purposes only. It is not financial advice, investment recommendation, or a solicitation to buy or sell securities. Investing involves significant risks. I am not a SEBI-registered investment advisor. Readers should consult their own financial advisor and conduct their own research before making any investment decisions.
Comments
Join the conversation
Sign in to join the conversation.
Follow replies, add your view, and take part in the discussion.
Sign in to commentLoading comments...