

What are Bollinger Bands — and why is touching the upper band not a sell signal? (Beginner's In-Depth Guide)
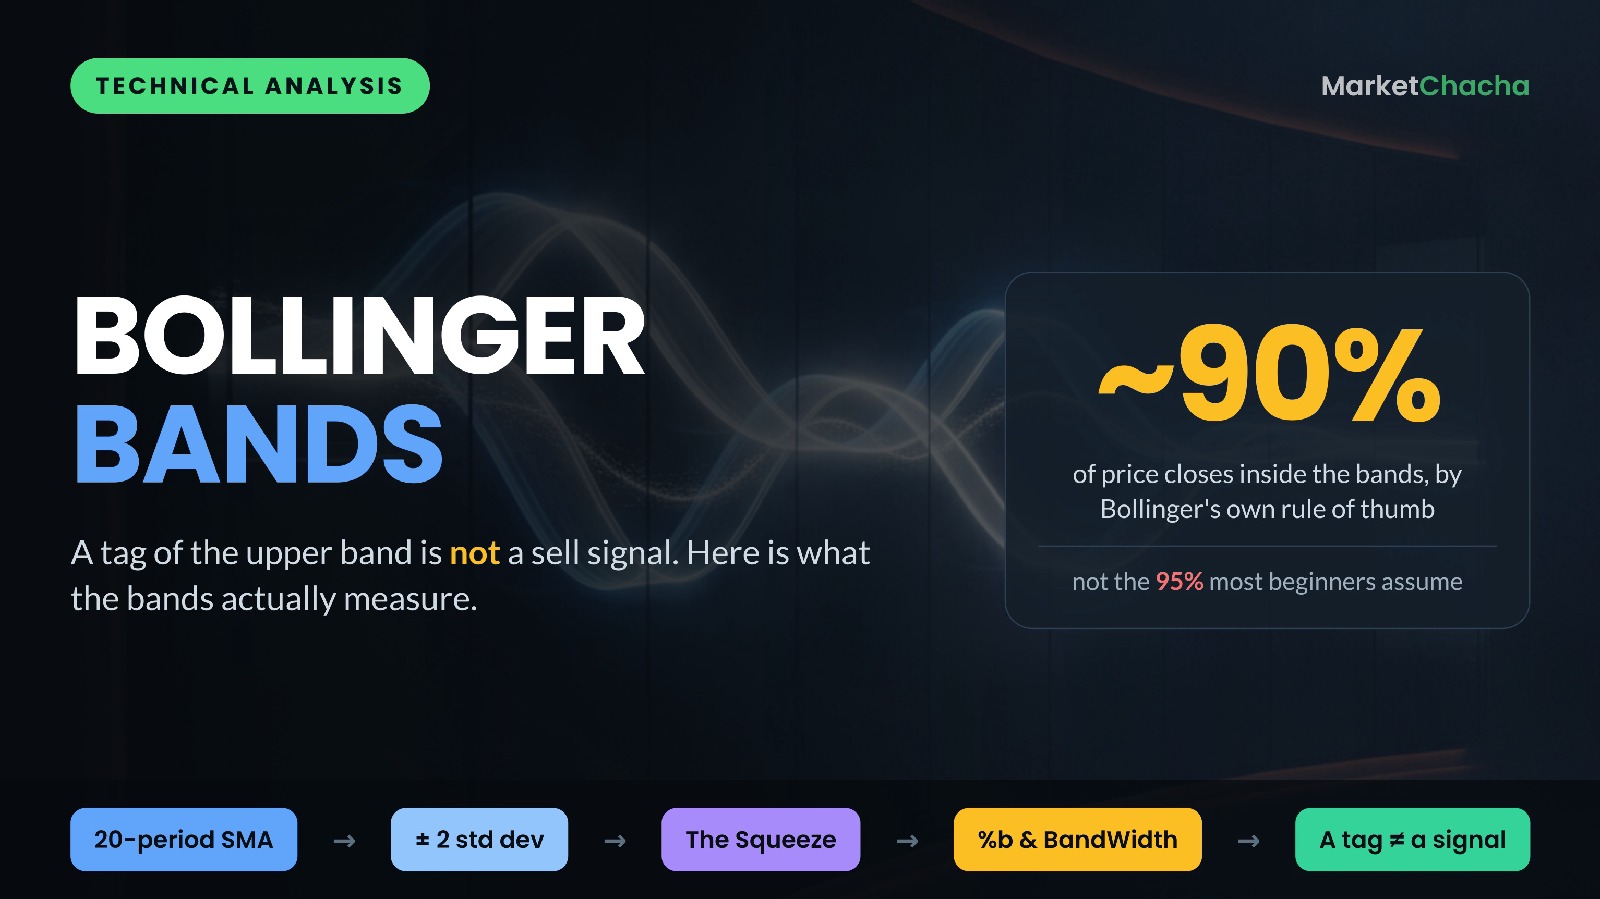
Bollinger Bands are a volatility indicator. They draw three lines on a price chart: a middle line that is a moving average of the closing price (20 periods by default), and an upper and a lower line placed a set number of standard deviations away from that average (two, by default). Because standard deviation is a measure of how much prices have been jumping around, the bands automatically widen when the market gets noisy and squeeze together when it goes quiet. That is the whole idea: the bands do not predict direction — they describe how volatile the recent past has been, and they put today's price into that context.
Below we build the bands from scratch with a worked example you can check on a calculator, explain the statistics myth almost every beginner repeats, decode the Squeeze, %b and BandWidth, and go through the mistakes that cost people money.
What Bollinger Bands actually measure
John Bollinger's insight in the early 1980s was simple: a fixed-width envelope around a moving average is useless, because a stock that moves 1% a day and a stock that moves 6% a day need very different envelopes. So instead of a fixed width, he made the width self-adjusting by tying it to the standard deviation of recent prices.
Standard deviation answers one question: on average, how far have the last 20 closes strayed from their own average? If the last 20 closes are all bunched tightly together, the standard deviation is small and the bands hug the price. If the last 20 closes are scattered, the standard deviation is large and the bands flare out. This gives you a relative reading rather than an absolute one: a price near the upper band is high relative to its own recent behaviour, not high compared to some universal yardstick.
This is why Bollinger Bands work equally well on a ₹80 small-cap, a $400 US large-cap and an index. The maths rescales itself to whatever it is measuring.
The formula — and a worked example you can check with a calculator
With the standard settings the three lines are:
- Middle band = 20-period simple moving average (SMA) of the closing price
- Upper band = middle band + (2 × the standard deviation of those same 20 closes)
- Lower band = middle band − (2 × the standard deviation of those same 20 closes)
Note that the same 20 closes feed both calculations. Bollinger's own rules point out that traditional Bollinger Bands are built on a simple moving average precisely so the average and the standard deviation are consistent with each other.
Now the arithmetic. Take these 20 illustrative closes for a stock that has been grinding higher:
100, 101, 100, 102, 103, 102, 104, 105, 104, 106, 107, 106, 108, 109, 108, 110, 111, 110, 112, 113
- Step 1 — the middle band. Add them up: the total is 2,121. Divide by 20 → SMA = 106.05.
- Step 2 — the standard deviation. Subtract 106.05 from each close, square each result, and add those squares up: they total 306.95. Divide by 20 → a variance of 15.3475. Take the square root → standard deviation = 3.92.
- Step 3 — the bands. Two standard deviations is 2 × 3.92 = 7.84. So the upper band = 106.05 + 7.84 = 113.89 and the lower band = 106.05 − 7.84 = 98.21.
The most recent close was 113.00. That sits just below the upper band of 113.89 — high in the range, but it never actually broke out. That distinction matters, and the next two sections explain why.
One detail worth knowing: the calculation above uses the population standard deviation (dividing the sum of squares by 20). Some platforms use the sample version (dividing by 19), which would give 4.02 here and a slightly wider band at 114.09. If two charting tools ever disagree with each other by a hair, this is usually why — check your platform's documentation rather than assuming one of them is broken.
Why "±2 standard deviations" does not mean 95%
Here is the single most repeated error about this indicator. In a textbook normal distribution, about 95% of observations fall within two standard deviations of the mean. Beginners take that number, apply it to Bollinger Bands, and conclude that a close outside the bands is a rare, roughly one-in-twenty event that must snap back.
Bollinger himself says otherwise. His published rules state plainly: "In practice we typically find 90%, not 95%, of the data inside Bollinger Bands with the default parameters." StockCharts, working from the same source material, cites 88–89%. In the illustrative series charted below, 86% of closes finished inside the bands.
Why the gap? Two reasons. First, the 95% figure assumes prices are normally distributed, and they are not — real markets have fat tails, meaning extreme moves happen far more often than the bell curve allows. Second, the "mean" here is not a fixed constant; it is a 20-period average that is recalculated on every single bar, chasing the price around. The bands are a descriptive tool built on a rolling window, not a probability statement about the future.
The practical takeaway: a close outside the band is uncommon but not rare, and it is certainly not a guarantee of a reversal.
Reading the chart: the Squeeze, the expansion, and walking the band
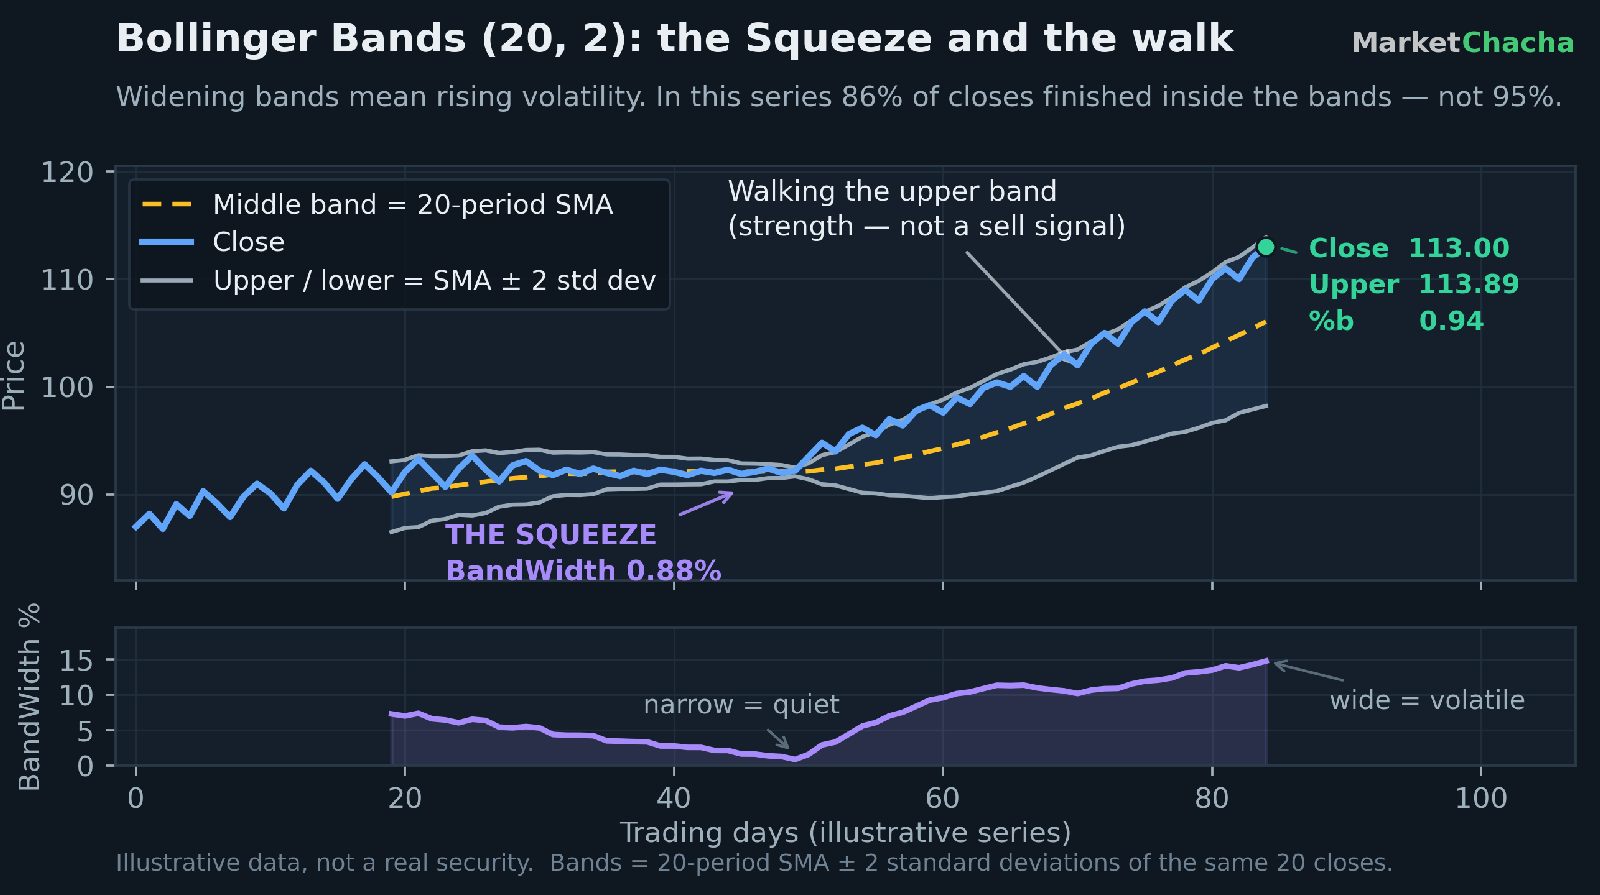
The chart above shows the three behaviours you will see over and over.
The Squeeze. In the middle of the series, price goes quiet and the bands pinch together — BandWidth falls all the way to 0.88%. Bollinger calls this the Squeeze, and the logic behind it is that periods of low volatility tend to be followed by periods of high volatility. Crucially, a Squeeze tells you a bigger move is plausible. It says nothing about which direction, and nothing about when. StockCharts explicitly warns about "head-fakes" here: the first break out of a Squeeze often fails and reverses.
How narrow counts as narrow is relative to the security itself. The usual approach is to pull up eight to twelve months of history and see where BandWidth normally sits for that particular stock, then judge the current reading against its own range — not against some universal threshold.
The expansion. Once the move begins, the bands flare open. In the chart, BandWidth goes from 0.88% at its quietest to roughly 14.8% by the end. Widening bands are a sign that volatility is rising — which is just as consistent with a crash as with a rally.
Walking the band. Through the second half of the series, price hugs the upper band for weeks on end. This is the behaviour that ruins the "sell at the upper band" idea. In a genuine trend, price can walk the upper band bar after bar, and each of those touches is a sign of strength, not exhaustion.
%b and BandWidth: turning the picture into a number
Two companion indicators let you measure what your eye is doing.
%b tells you where price sits within the bands, expressed as a fraction:
%b = (Price − Lower Band) ÷ (Upper Band − Lower Band)
Using our worked example: (113.00 − 98.21) ÷ (113.89 − 98.21) = 14.79 ÷ 15.68 = 0.94. Read the scale like this: %b of 1.0 means price is exactly on the upper band, 0.5 means it is exactly on the middle band, 0 means it is on the lower band, above 1 means it closed above the upper band, and below 0 means it closed beneath the lower band. Our 0.94 says price is high in its range but still inside.
BandWidth tells you how wide the bands are, as a percentage of the middle band:
BandWidth = ((Upper Band − Lower Band) ÷ Middle Band) × 100
Again from the worked example: (15.68 ÷ 106.05) × 100 = about 14.8%. That is the number plotted in the lower panel of the chart, and it is what you watch to spot a Squeeze. Because it is a percentage, you can compare BandWidth across stocks trading at completely different prices.
Common mistakes beginners make
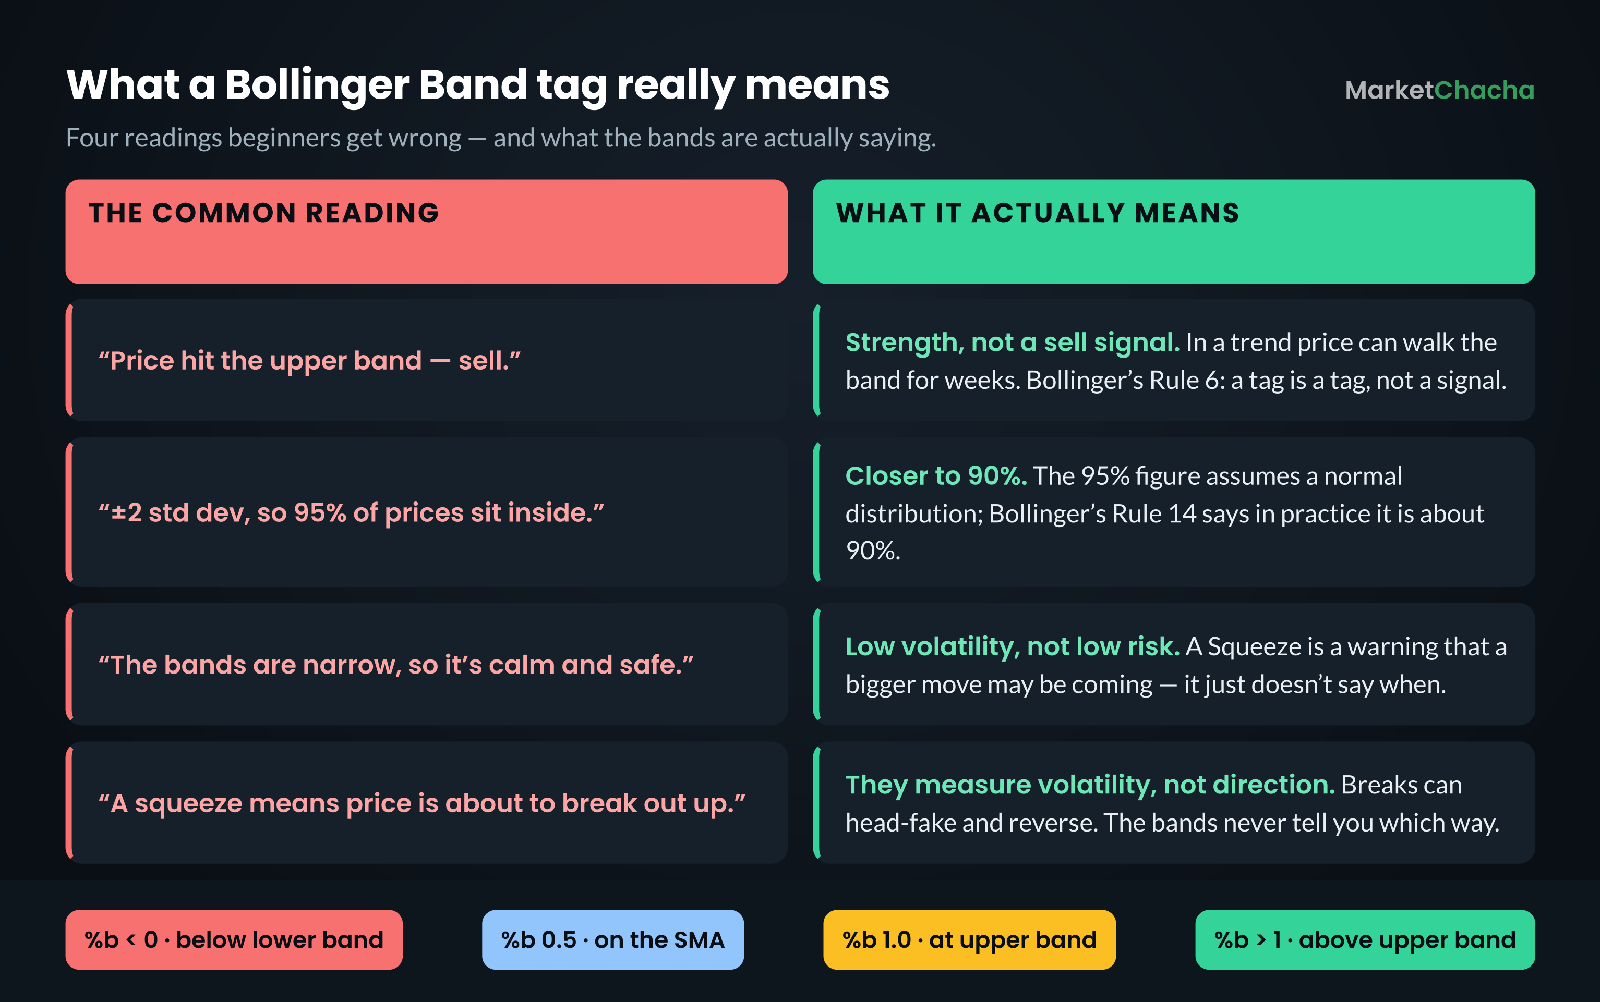
- Treating a band touch as a trade signal. Bollinger's Rule 6 is unusually blunt: "Tags of the bands are just that, tags not signals. A tag of the upper Bollinger Band is NOT in-and-of-itself a sell signal." StockCharts uses the same language — touches are "tags", not signals.
- Expecting the 95%. Covered above. Closes outside the bands are more common than the bell curve suggests.
- Reading a Squeeze as safety. Narrow bands mean low recent volatility. They are arguably a warning, not a comfort.
- Guessing direction from a Squeeze. The bands are symmetric and direction-blind by construction. Anyone telling you a squeeze is "bullish" is adding an assumption the indicator does not contain.
- Fiddling with the settings until it fits. Bollinger's Rule 9 notes the 20 and 2 are "just that, defaults." Shortening the average generally requires fewer standard deviations and lengthening it requires more — but changing settings after the fact so past signals look better is curve-fitting, not analysis.
- Using the bands alone. They describe volatility. They tell you nothing about earnings, trend strength or volume.
How to actually use Bollinger Bands
Used properly, the bands are a piece of context you lay underneath other analysis, not a system in themselves. A workable process looks like this:
- Start with the regime, not the signal. Look at the bands' width first. Are they expanding, contracting, or flat? That tells you whether you are in a quiet market or a volatile one, and quiet markets and volatile markets need different position sizes.
- Establish trend separately. A rising middle band with price persistently in the upper half is a very different picture from price oscillating either side of a flat middle band. In the first case, band touches are continuation; in the second, they are closer to range extremes.
- Use %b to compare, not to trigger. %b turns "near the top of the band" into a number you can screen with and compare across stocks.
- Confirm with something that is not price. Volume, or a momentum indicator like RSI, gives you an independent read. A tag of the upper band with expanding volume behaves very differently from one on fading volume.
- Decide your risk before the trade, not after. Nothing about the bands defines a stop or a size. That is a separate decision, and it is the one that actually determines whether a run of wrong calls is survivable.
Bollinger Bands on Indian charts (and a name that confuses beginners)
The maths is identical on the NSE and BSE — the indicator is scale-free, so it applies to Nifty 50, Sensex, a large-cap or a small-cap without adjustment, and BandWidth being a percentage means you can compare a ₹150 stock with a ₹3,000 one directly. The indicator ships with the same 20-period, 2-standard-deviation defaults there as anywhere else.
There is one trap specific to Indian beginners: "price bands" on an Indian exchange are a completely different thing from Bollinger Bands. NSE applies daily price bands — commonly called circuit filters — of 2%, 5%, 10% or 20% either way on eligible securities, with no fixed price band on scrips that have derivative products (those are managed through dynamic operating ranges instead). Those limits are a regulatory ceiling and floor on how far a stock may move in a session. They are set by the exchange, they are the same for everyone in that bucket, and they physically stop trading beyond that level.
Bollinger Bands are the opposite in every respect: they are computed by you from that stock's own recent closes, they change every single bar, they carry no force whatsoever, and price is entirely free to close outside them — which, as we saw, it does around 10% of the time. A stock hitting its upper circuit and a stock tagging its upper Bollinger Band have nothing to do with one another.
One practical note for Indian charts: a stock that gets locked at a circuit limit for several sessions produces a run of near-identical closes, which collapses the standard deviation and makes the bands pinch dramatically. That Squeeze is an artefact of the circuit filter, not a real volatility signal — worth recognising before you read anything into it.
FAQ
What do Bollinger Bands tell you? They tell you how volatile a security has recently been and where today's price sits relative to that recent range. Wide bands mean high volatility, narrow bands mean low volatility. They do not forecast direction.
What are the best Bollinger Band settings? The defaults are a 20-period simple moving average with bands at 2 standard deviations, and Bollinger's own rules describe these as defaults rather than optimal values. Shorter averages generally pair with fewer standard deviations and longer averages with more, but changing the settings until past signals look good is curve-fitting.
Should I sell when price touches the upper Bollinger Band? No — not on that basis alone. John Bollinger's Rule 6 states directly that a tag of the upper band is not in itself a sell signal. In a strong uptrend price can walk along the upper band for weeks, and every one of those touches signals strength.
What is a Bollinger Band squeeze? A Squeeze is a period when BandWidth falls to historically low levels for that particular security, meaning the bands have pinched tightly together. It suggests volatility is likely to expand, but it gives no clue about direction, and the first break often reverses.
Do 95% of prices really stay inside Bollinger Bands? No. That figure comes from the normal distribution, which markets do not follow. Bollinger's own rules say roughly 90% of data falls inside the bands with default settings; StockCharts cites 88–89%.
What does %b of 0.5 mean? It means price is sitting exactly on the middle band — the 20-period moving average. A %b of 1 puts price on the upper band, 0 on the lower band, and readings above 1 or below 0 mean price closed outside the bands entirely.
Educational content only — not investment advice, and not a recommendation of any security, indicator or strategy. All prices and figures in the worked example and the chart are illustrative, not real market data. Indicator settings and exchange rules change — always check current documentation. [Sources: John Bollinger's Bollinger Band Rules, StockCharts ChartSchool: Bollinger Bands, StockCharts ChartSchool: Bollinger BandWidth, TradingView: Bollinger Bands %b, NSE India: Price Bands] Always do your own research.
This article is for educational and informational purposes only. It is not financial advice, investment recommendation, or a solicitation to buy or sell securities. Investing involves significant risks. I am not a SEBI-registered investment advisor. Readers should consult their own financial advisor and conduct their own research before making any investment decisions.
Comments
Join the conversation
Sign in to join the conversation.
Follow replies, add your view, and take part in the discussion.
Sign in to commentLoading comments...