

Marvell Technology (MRVL): the full file — the numbers, the owners, and what the filings actually show
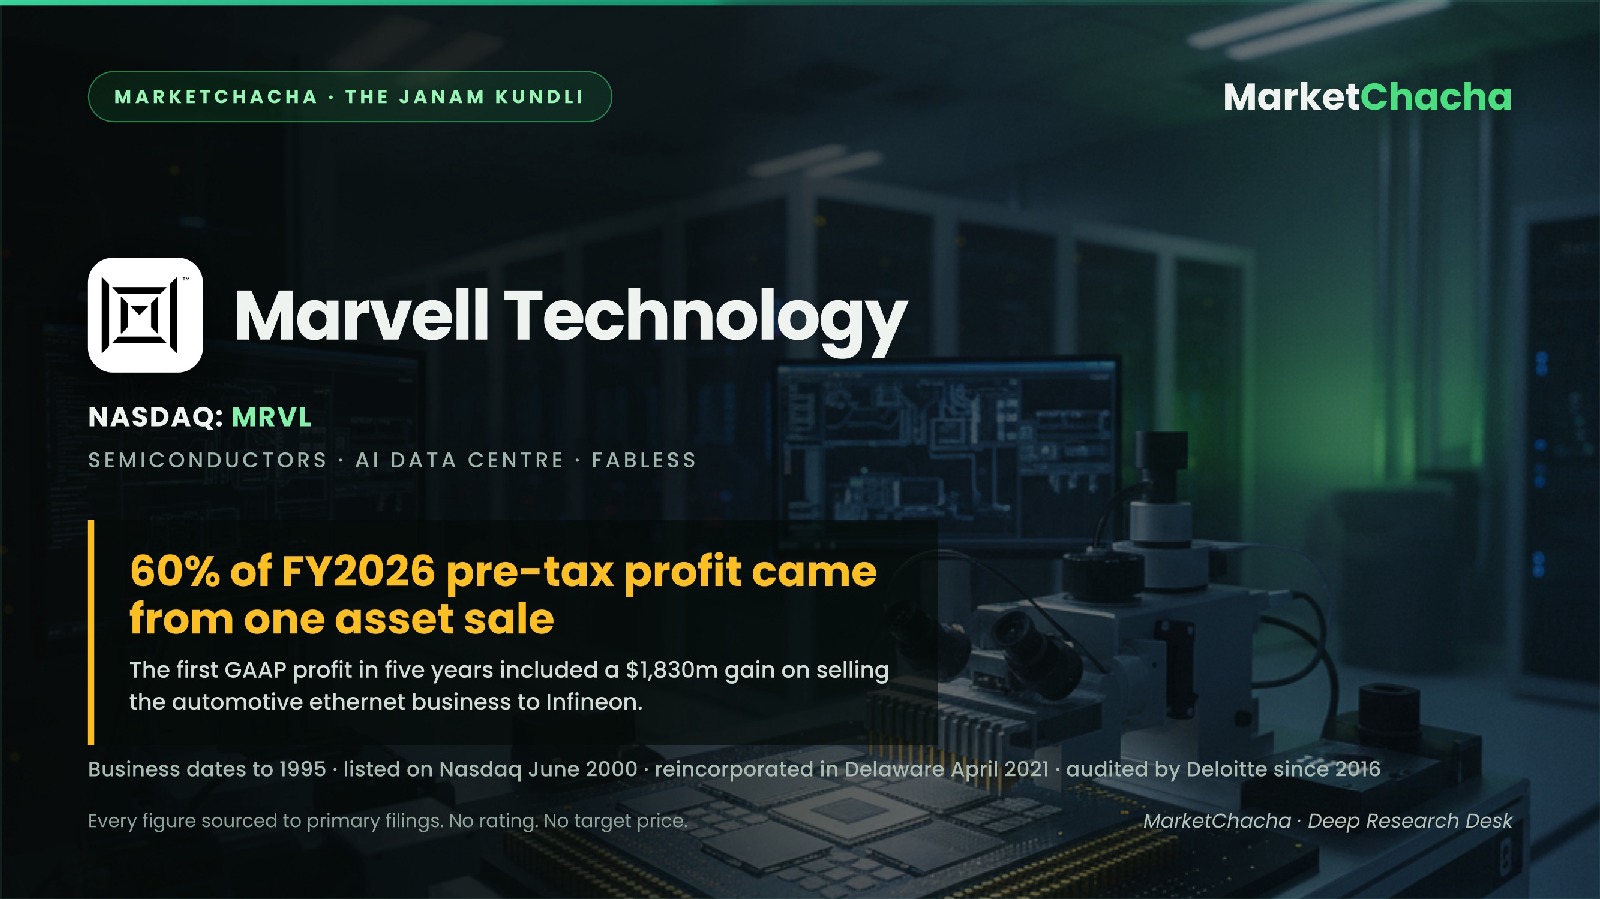
Marvell Technology designs semiconductors it does not manufacture — custom AI accelerators, optical interconnects, ethernet switches, storage controllers — and sells them mostly to a handful of very large buyers, 74% of the revenue now coming from the data centre end market. It made its first GAAP profit in five years in FY2026, and $1,830.4m of that year's $3,046.6m pre-tax income came from selling a business rather than from operations.
The record shows a company rebuilt twice over by acquisition, owning no factory anywhere, with two counterparties accounting for just over half its revenue and three of the largest buyers of AI infrastructure now holding or able to acquire its stock. Every figure below comes from a primary filing, linked at the end.
Origin — the company's birth certificate
The operating business dates to 1995: the FY2026 10-K records that "in April 1995, the Company adopted the 1995 Stock Option Plan", the oldest instrument still on its books. The listed entity has changed identity twice.
Marvell Technology Group Ltd. — incorporated in Bermuda — began trading on Nasdaq as MRVL on 27 June 2000 upon completion of its IPO. In a 2021 reorganisation a newly formed Delaware company, Marvell Technology, Inc., became the listed parent, trading under the same symbol from 20 April 2021 (both facts in Item 5). Both entities still exist with their own SEC identifiers — CIK 0001058057 for the Bermuda company, CIK 0001835632 for the Delaware one — and the Bermuda entity is today a subsidiary of the Delaware one, still named in Exhibit 21.1.
There is no promoter or founding family. The 10-K reports 392 holders of record as of 4 March 2026, a low number reflecting street-name custody rather than a concentrated register. The company's shape is the product of acquisitions — Cavium (November 2017), Inphi (merger agreement 29 October 2020), Innovium, eSilicon and QLogic all appear in Exhibit 21.1 — with two more closing just after the FY2026 year end: Celestial AI on 2 February 2026 and XConn Technologies on 10 February 2026.
The business — what they actually sell
Marvell reports two end markets, and the mix has inverted in two years:
| End market | FY2026 | % | FY2025 | % | FY2024 | % |
|---|---|---|---|---|---|---|
| Data center | $6,100.3m | 74% | $4,164.2m | 72% | $2,216.7m | 40% |
| Communications and other | $2,094.3m | 26% | $1,603.1m | 28% | $3,291.0m | 60% |
| Total net revenue | $8,194.6m | $5,767.3m | $5,507.7m |
Item 1 describes the products as custom ASICs, interconnects, ethernet solutions, fibre channel adapters, processors and storage controllers, with UALink and Ethernet for Scale-Up Networking switches under development. One presentation caveat: the FY2026 10-K folded the former enterprise networking, carrier, consumer and automotive/industrial markets into a single "communications and other" line, so the FY2024 split above is shown on the current basis, not as originally reported.
Who actually buys from them
This is the most concentrated part of the file, and it is disclosed precisely. From Note 2 of the FY2026 10-K:
| Counterparty (as named in the filing) | FY2026 | FY2025 | FY2024 |
|---|---|---|---|
| Distributor A | 37% | 34% | 24% |
| Direct Customer A | 14% | 13% | under 10% |
Two counterparties therefore represented 51% of net revenue in FY2026, up from 47% and from under 34% two years earlier. Separately, the filing states that accounts receivable "was concentrated with four customers at January 31, 2026, who represented a total of 73% of gross accounts receivable", against four customers at 72% a year earlier.
Neither is named. SEC rules require disclosure of the 10%-plus concentration, not the identity — a real limit on verification, since a 37% distributor share does not reveal how many end customers sit behind it. The 10-K states the company believes "these distributors' sales to diverse end customers and geographies further serve to mitigate our exposure to credit risk."
By destination of shipment: China $2,969.9m (36%), Taiwan $1,657.3m (20%, up from 3% two years earlier), United States $1,174.1m (14%). The filing cautions this "is not necessarily indicative of the geographic location of the Company's end customers", since much of what ships to China goes to contract manufacturers serving non-China buyers.
Where it is actually made — plants and supply chain
Marvell owns no wafer fabrication plant. Item 2 lists 983,000 sq ft owned — all in the United States — and 1,515,000 sq ft leased across the US, India (418,000), Israel (171,000), Singapore (142,000), Vietnam (99,000), Canada (90,000), Taiwan (63,000) and Argentina (50,000). Every one is described as research and design, sales, administration or operations. None is a factory.
Manufacturing sits with third parties, and the 10-K is explicit about where: "Most of our products are manufactured by third-party foundries located in Taiwan, and other sources are located in China, Germany, South Korea, Singapore and the United States. In addition, most of our third-party assembly, testing and packaging facilities are located in China, Malaysia, Singapore, Taiwan and Canada."
What is not disclosed: not one foundry, assembly partner or supplier is named anywhere in the 10-K. A reader cannot establish which foundry makes what, or how much wafer supply comes from any one of them. The forward obligations are quantified: $2,665.8m of unconditional purchase commitments to foundries and test and assembly partners at 31 January 2026 ($1,871.8m of it in FY2027), plus $635.3m of technology services and licence fees, $152.0m of capex commitments, and capacity reservation agreements running 4 to 10 years with purchase commitments of at least $458.2m.
Five years of numbers
All figures from the FY2022-FY2026 10-K filings of Marvell Technology. Fiscal years end on the Saturday nearest 31 January, so FY2026 ended 31 January 2026.
| $ million | FY2022 | FY2023 | FY2024 | FY2025 | FY2026 |
|---|---|---|---|---|---|
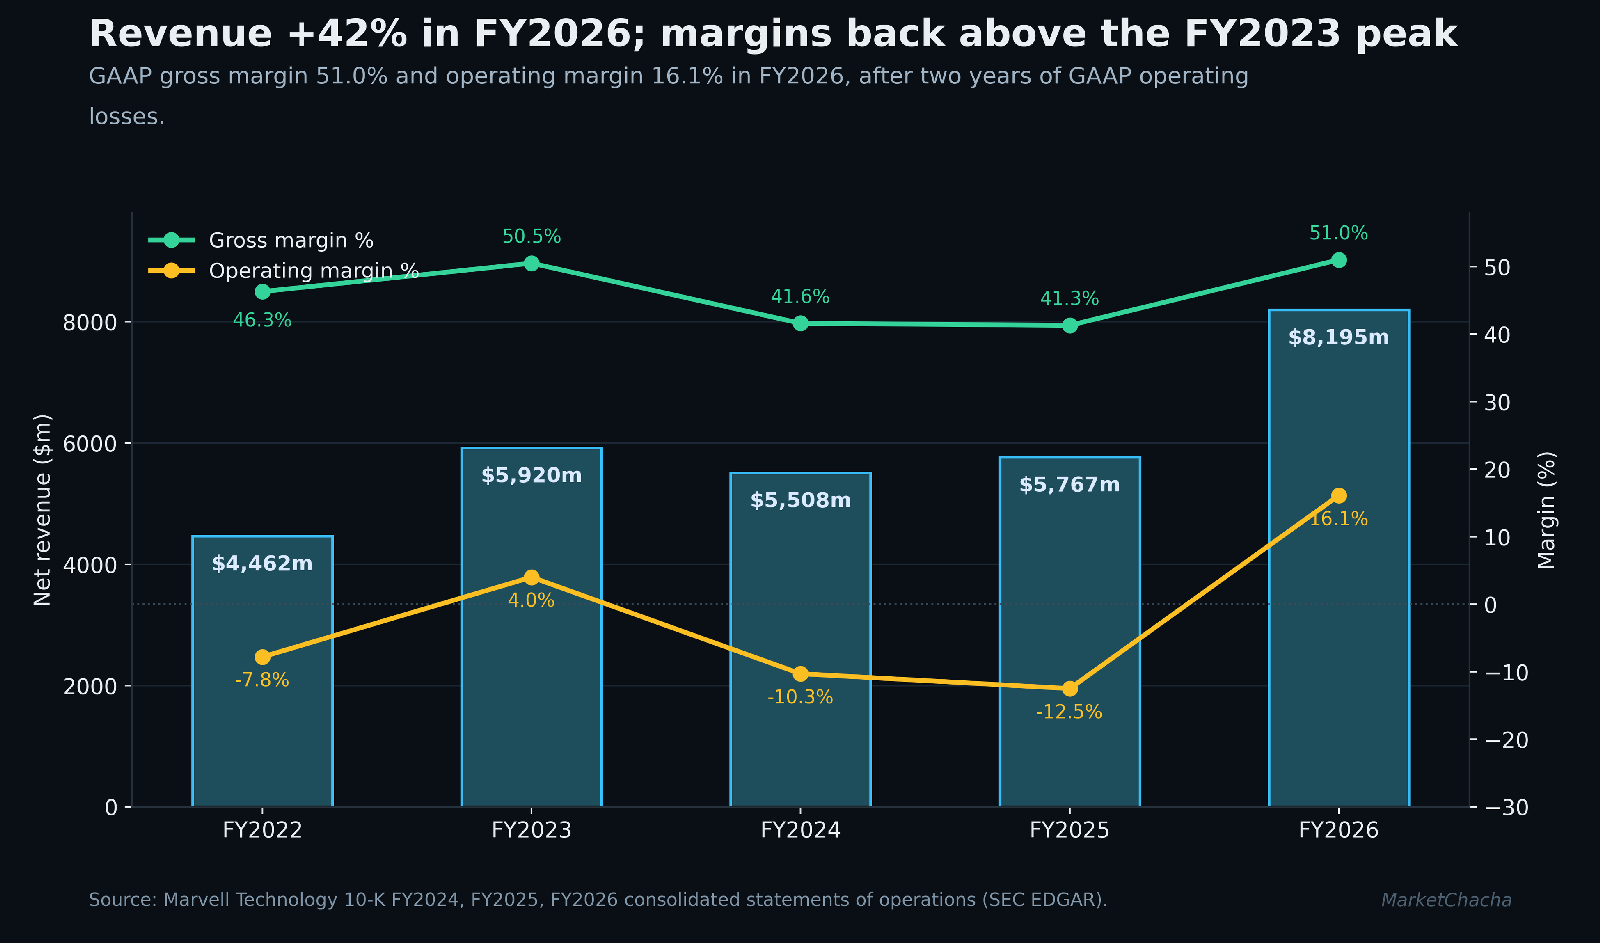
| Net revenue | 4,462.4 | 5,919.6 | 5,507.7 | 5,767.3 | 8,194.6 |
| Gross margin | 46.3% | 50.5% | 41.6% | 41.3% | 51.0% |
| Operating income | (347.7) | 238.0 | (567.7) | (720.3) | 1,322.9 |
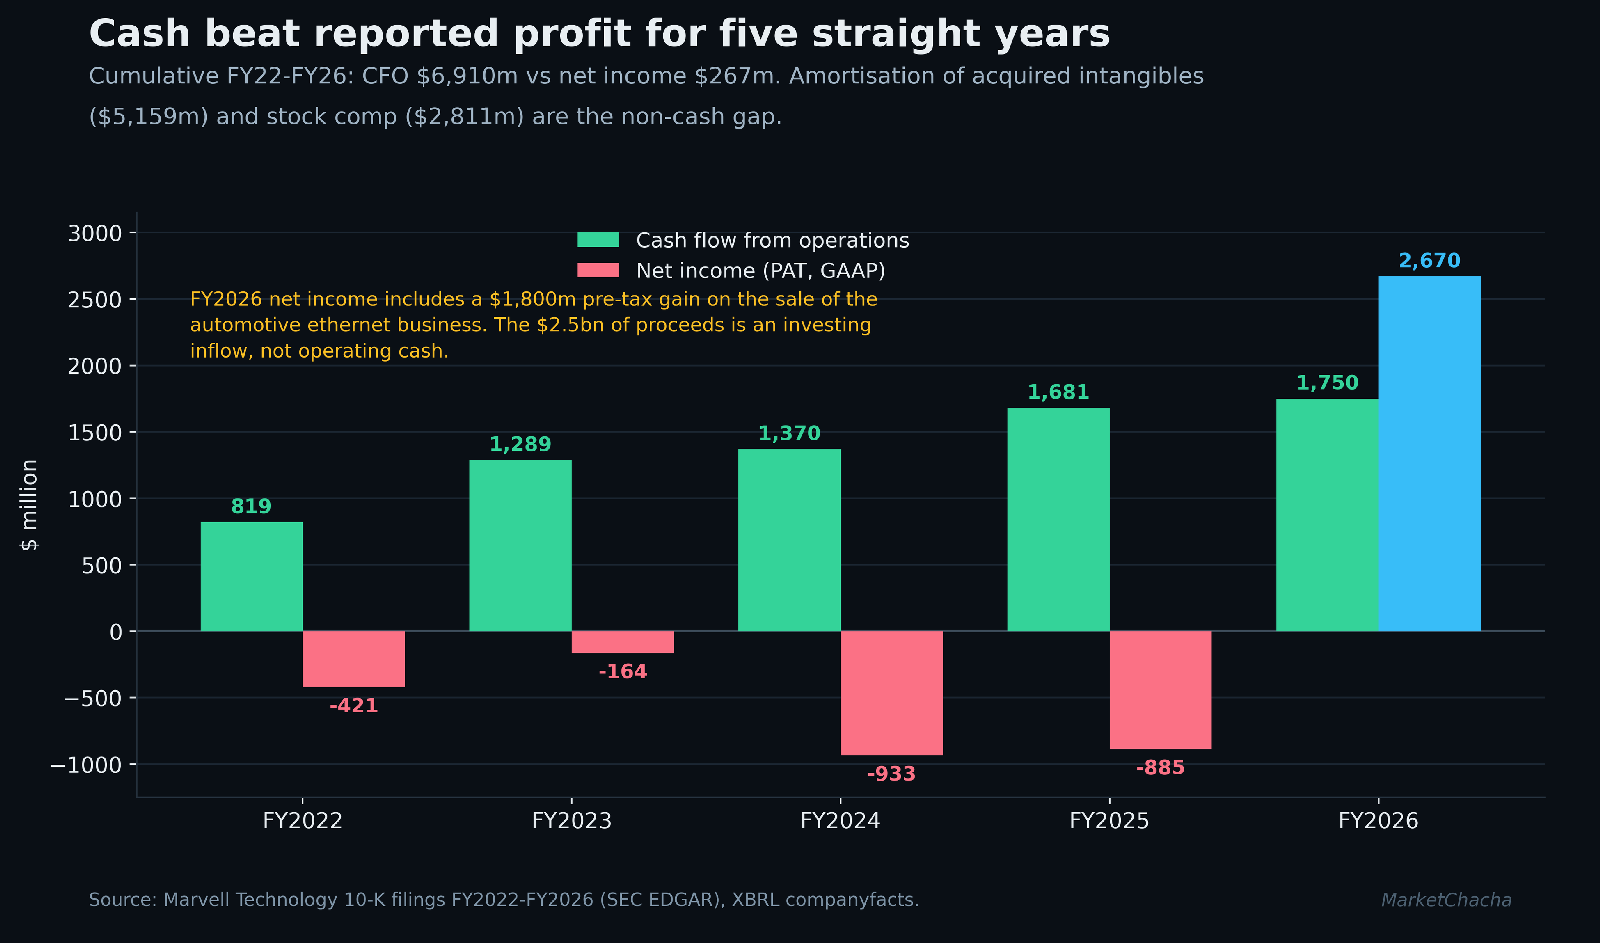
| Net income (PAT) | (421.0) | (163.5) | (933.4) | (885.0) | 2,670.1 |
| Cash from operations | 819.3 | 1,288.8 | 1,370.5 | 1,681.2 | 1,750.5 |
| Diluted EPS ($) | (0.53) | (0.19) | (1.08) | (1.02) | 3.07 |
The arithmetic. Revenue compounded from $2,968.9m in FY2021 to $8,194.6m in FY2026 — a five-year CAGR of 22.5% ((8,194.6 / 2,968.9)^(1/5) − 1). PAT and EPS CAGRs are not meaningful: losses in four of five years leave no positive base to compound from. Cumulative five-year CFO was $6,910.3m against cumulative net income of $267.2m. On price, MRVL closed at $62.46 on 15 September 2021 and $218.82 on 14 September 2026 — +250.3%, a CAGR of 28.5% — though the path was not smooth: $112.40 in January 2025, $62.74 in August 2025, $236.10 on 11 September 2026.
Income statement — FY2026 vs FY2025
| $ million | FY2026 | FY2025 | Change | % |
|---|---|---|---|---|
| Net revenue | 8,194.6 | 5,767.3 | +2,427.3 | +42.1% |
| Cost of goods sold | 4,013.9 | 3,385.1 | +628.8 | +18.6% |
| Gross profit | 4,180.7 | 2,382.2 | +1,798.5 | +75.5% |
| Research and development | 2,075.2 | 1,950.4 | +124.8 | +6.4% |
| Selling, general and administrative | 767.1 | 798.2 | −31.1 | −3.9% |
| Restructuring charges (in opex) | 15.5 | 353.9 | −338.4 | −95.6% |
| Total operating expenses | 2,857.8 | 3,102.5 | −244.7 | −7.9% |
| EBITDA* | 2,613.5 | 636.6 | +1,976.9 | +310.5% |
| EBITDA margin* | 31.9% | 11.0% | +20.9pp | — |
| Operating income | 1,322.9 | (720.3) | +2,043.2 | n/m |
| Interest expense | (202.6) | (189.4) | +13.2 | +7.0% |
| Interest income and other, net | 1,926.3 | 15.0 | +1,911.3 | n/m |
| Profit before tax | 3,046.6 | (894.7) | +3,941.3 | n/m |
| Tax provision / (benefit) | 376.5 | (9.7) | +386.2 | n/m |
| Net income (PAT) | 2,670.1 | (885.0) | +3,555.1 | n/m |
| Net margin | 32.6% | (15.3%) | +47.9pp | — |
| Diluted EPS ($) | 3.07 | (1.02) | +4.09 | n/m |
*EBITDA here is operating income plus depreciation and amortisation ($348.6m FY2026, $304.3m FY2025) plus amortisation of acquired intangible assets ($942.0m FY2026, $1,052.6m FY2025), all from the consolidated cash flow statement. Marvell does not itself report an EBITDA line; this is our computation and the inputs are shown so it can be checked.
Balance sheet — FY2026 vs FY2025
| $ million | 31 Jan 2026 | 1 Feb 2025 | Change | % |
|---|---|---|---|---|
| Cash and cash equivalents | 2,638.8 | 948.3 | +1,690.5 | +178.3% |
| Accounts receivable, net | 2,186.6 | 1,028.4 | +1,158.2 | +112.6% |
| Inventories | 1,388.0 | 1,029.7 | +358.3 | +34.8% |
| Goodwill | 11,062.2 | 11,586.9 | −524.7 | −4.5% |
| Acquired intangible assets, net | 1,754.7 | 2,710.6 | −955.9 | −35.3% |
| Total assets | 22,285.3 | 20,204.5 | +2,080.8 | +10.3% |
| Short-term debt | 499.8 | 129.5 | +370.3 | +286.0% |
| Long-term debt | 3,970.8 | 3,934.3 | +36.5 | +0.9% |
| Accounts payable | 1,073.8 | 622.2 | +451.6 | +72.6% |
| Total liabilities | 7,976.9 | 6,777.5 | +1,199.4 | +17.7% |
| Additional paid-in capital | 12,950.9 | 14,534.1 | −1,583.2 | −10.9% |
| Retained earnings / (deficit) | 1,355.8 | (1,109.2) | +2,465.0 | n/m |
| Total equity (net worth) | 14,308.4 | 13,427.0 | +881.4 | +6.6% |
Four lines moved more than ~40%: cash (+178.3%, funded by the divestiture), receivables (+112.6%), short-term debt (+286.0%, the 2026 notes moving to current as they approach maturity) and accounts payable (+72.6%). Additional paid-in capital fell $1,583.2m while equity rose: $2,054.4m of buybacks including excise tax is charged against paid-in capital, while $2,670.1m of profit turned an accumulated deficit of $1,109.2m into positive retained earnings of $1,355.8m for the first time.
Cash flow — FY2026 vs FY2025
| $ million | FY2026 | FY2025 | Change |
|---|---|---|---|
| Cash from operations (CFO) | 1,750.5 | 1,681.2 | +69.3 (+4.1%) |
| Cash from investing (CFI) | +2,097.8 | (300.7) | +2,398.5 |
| Cash from financing (CFF) | (2,157.8) | (1,383.0) | −774.8 |
| Capital expenditure | 354.1 | 284.6 | +69.5 (+24.4%) |
| Free cash flow (CFO − capex) | 1,396.4 | 1,396.6 | −0.2 (−0.01%) |
The material variances. Revenue rose 42.1% while cost of goods sold rose 18.6% — that gap is the entire gross-profit move, lifting gross margin 9.7 points to 51.0%. Operating expenses fell 7.9%, but almost all of that is restructuring dropping from $353.9m to $15.5m; R&D still rose 6.4%. The $2,043.2m operating-income swing is therefore roughly two-thirds gross profit and one-third the absence of last year's restructuring charge.
Earnings quality. Of $3,046.6m pre-tax profit, operating income supplied $1,322.9m (43.4%); a single non-operating item — the $1,830.4m pre-tax gain on the automotive ethernet sale to Infineon, closed 14 August 2025 for $2.5bn cash — supplied 60.1%. It was not presented as a discontinued operation, so prior-year figures were not recast, and the gain sits inside "interest income and other, net" rather than on its own line. Free cash flow, which excludes the gain entirely, was flat year on year at $1,396m. Both readings are correct; they answer different questions.
The latest quarter, decoded
Q2 FY2027 ended 1 August 2026 (10-Q filed 28 August 2026). Q1 FY2027 figures for interest and tax are derived by subtracting the reported quarter from the reported six-month totals.
| $ million | Q2 FY27 | Q1 FY27 | QoQ | Q2 FY26 | YoY |
|---|---|---|---|---|---|
| Net revenue | 2,739.3 | 2,417.8 | +13.3% | 2,006.1 | +36.6% |
| Gross profit | 1,455.6 | 1,260.8 | +15.4% | 1,010.6 | +44.0% |
| Gross margin | 53.1% | 52.1% | +1.0pp | 50.4% | +2.7pp |
| Research and development | 741.1 | 652.3 | +13.6% | 519.0 | +42.8% |
| Selling, general and administrative | 257.6 | 258.4 | −0.3% | 192.8 | +33.6% |
| Operating income | 459.7 | 339.4 | +35.4% | 290.1 | +58.5% |
| Interest expense | (61.6) | (52.8) | +16.7% | (51.9) | +18.7% |
| Other expense, net | (19.8) | (203.3) | n/m | (4.5) | n/m |
| Profit before tax | 378.3 | 83.3 | +354.1% | 233.7 | +61.9% |
| Tax provision | 70.3 | 48.8 | +44.1% | 38.9 | +80.7% |
| Net income | 308.0 | 34.5 | +792.8% | 194.8 | +58.1% |
| Diluted EPS ($) | 0.33 | 0.04 | +725.0% | 0.22 | +50.0% |
| Diluted shares (m) | 921.2 | — | — | 870.4 | +5.8% |
Read the QoQ carefully. The 793% jump in net income is not an operating event: operating income rose 35.4%, and the rest is the disappearance of a Q1 charge. The six-month cash flow statement identifies it — a $433.7m non-cash change in the fair value of a contingent consideration liability (the Celestial AI milestone shares), partly offset by a $131.0m gain on a forward stock purchase contract. Those marks sit in "other expense, net": −$203.3m in Q1, −$19.8m in Q2. Comparing Q2 to Q1 on headline profit mostly measures the absence of a mark-to-market charge.
The year-on-year comparison is cleaner: revenue +36.6%, operating income +58.5%, net income +58.1%, gross margin +2.7pp. Two quality notes: R&D rose 42.8%, faster than revenue, which the 10-Q attributes to the February 2026 acquisitions; and tax rose 80.7% against 61.9% pre-tax growth, lifting the effective rate from 16.6% to 18.6%. Diluted shares rose 5.8%, so EPS grew 50% against 58% net income growth.
Who owns it — and where those owners are registered
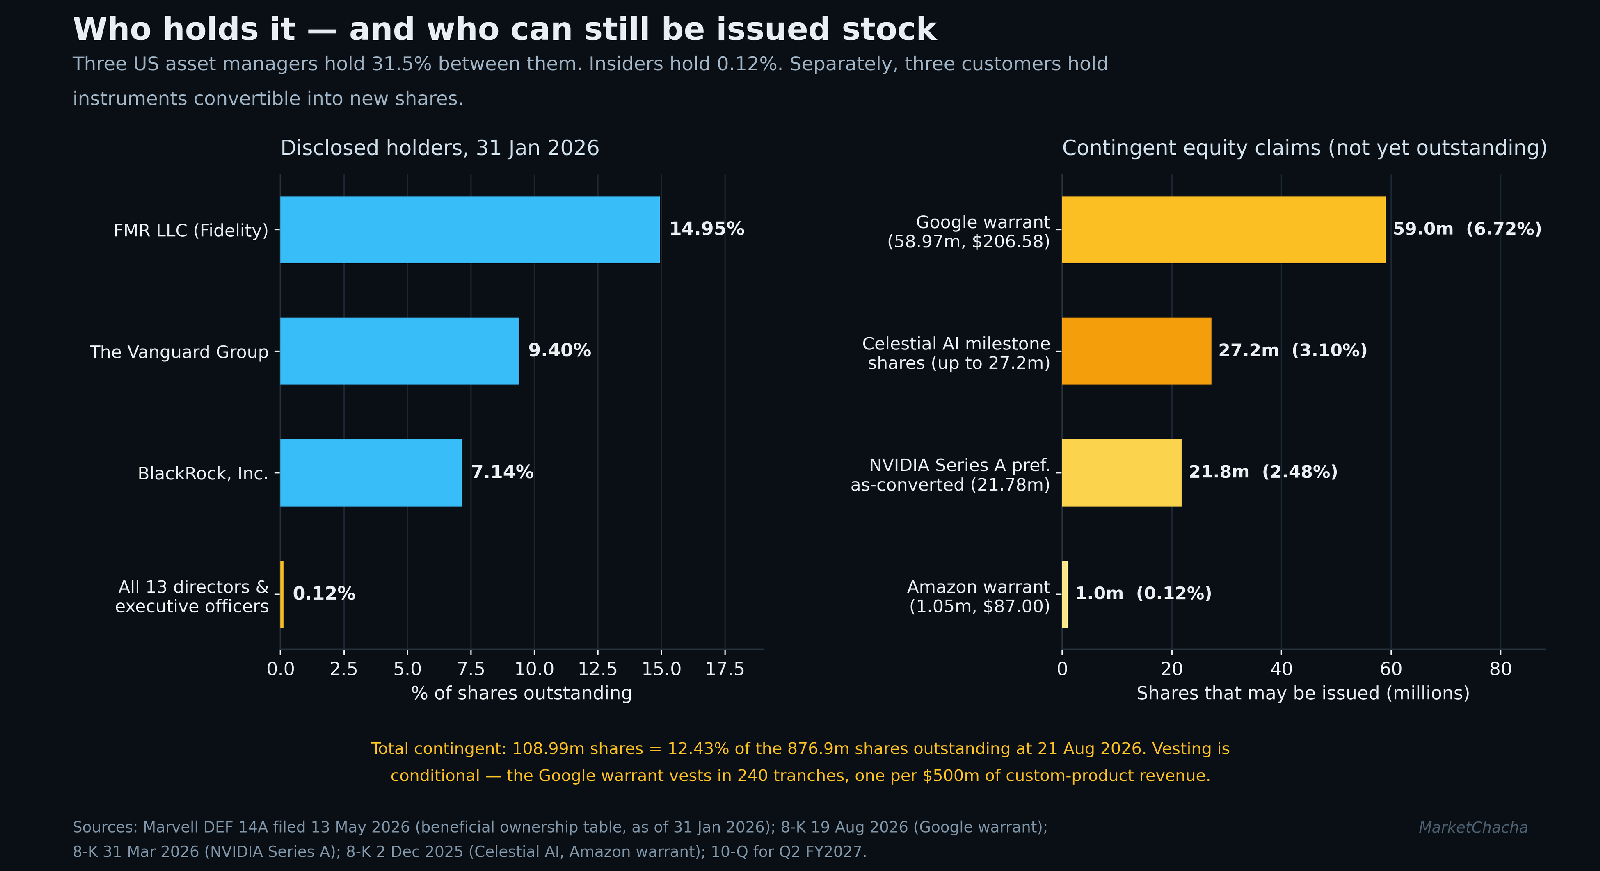
From the beneficial ownership table in the DEF 14A filed 13 May 2026 (holdings as of 31 January 2026, against 847,287,680 shares then outstanding):
| Holder | Shares | % | Registered |
|---|---|---|---|
| FMR LLC (Fidelity), Boston MA | 126,698,928 | 14.95% | United States |
| The Vanguard Group, Malvern PA | 79,610,185 | 9.40% | United States |
| BlackRock, Inc., New York NY | 60,534,116 | 7.14% | United States |
| All 13 directors and executive officers | 1,046,798 | under 1% | — |
Three US-domiciled asset managers hold 31.49% between them, and no offshore holder is individually disclosed above 5% — the disclosed register is entirely domestic and institutional. The whole board and management together hold 1,046,798 shares, or 0.12%; Chairman and CEO Matthew J. Murphy holds 412,871. That is a verified finding in its own right, not an omission.
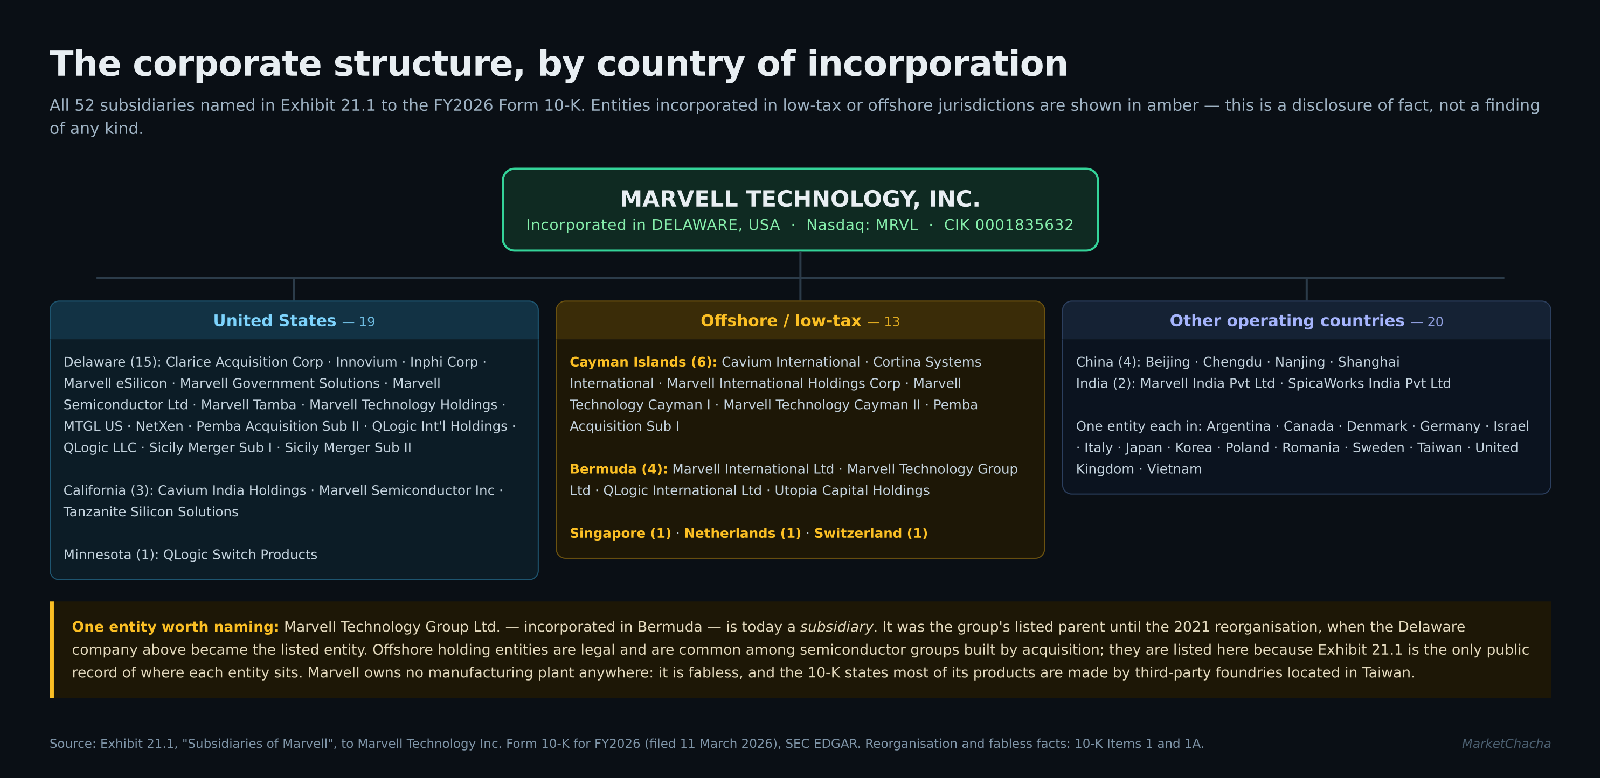
The subsidiary chain is a different picture. Exhibit 21.1 names 52 subsidiaries: 19 US (15 Delaware, 3 California, 1 Minnesota), 20 operating companies in China (4), India (2), Argentina, Canada, Denmark, Germany, Israel, Italy, Japan, Korea, Poland, Romania, Sweden, Taiwan, the UK and Vietnam, and 13 in low-tax or offshore jurisdictions — six in the Cayman Islands (Cavium International, Cortina Systems International, Marvell International Holdings Corporation, Marvell Technology Cayman I and II, Pemba Acquisition Sub I), four in Bermuda (Marvell International Ltd., Marvell Technology Group Ltd., QLogic International Ltd., Utopia Capital Holdings), and one each in Singapore, the Netherlands and Switzerland.
Offshore holding structures are legal and ordinary among semiconductor groups assembled by acquisition: several of these entities arrived attached to companies Marvell bought (Cavium, Cortina, QLogic), and the Bermuda entities are residue of the pre-2021 corporate form. They are set out because Exhibit 21.1 is the only public record of where each entity sits, and because the tax and cash-flow effects of the structure are not separately disclosed.
The unusual part: customers who own stock. Across ten months Marvell issued equity or equity rights to three of the largest buyers of AI infrastructure in the world.
- NVIDIA — on 31 March 2026 bought 2,000,000 shares of Series A Convertible Preferred for $2,000,000,000 in cash, convertible into a maximum of 21,778,000 common shares at roughly $91.8355. It votes with common on an as-converted basis on everything except the election of directors. (NVDA, 8-K filed 31 March 2026.)
- Google — on 18 August 2026 received a warrant for up to 58,970,907 shares at $206.58, exercisable to 18 August 2033. 1,360,867 shares vest on time; the rest vest in 240 equal tranches, one for each $500m of Custom Products revenue from Google and its affiliates through FY2033. (GOOGL, 8-K filed 19 August 2026.)
- Amazon — on 2 December 2025 received a warrant for up to 1,045,171 shares at $87.0029, vesting on purchases of photonic fabric products through 31 December 2030. (AMZN, 8-K filed 2 December 2025.)
Add the Celestial AI milestone shares (up to ~27.2m) and disclosed contingent claims total 108.99m shares, or 12.43% of the 876.9m outstanding at 21 August 2026. None is outstanding today and much may never vest — the Google warrant fully vests only on $120bn of cumulative custom-product revenue. Customer warrants tied to purchase volumes are now an established structure in AI silicon; MarketChacha covered a comparable arrangement in Qualcomm's 25m-share Amazon server-chip deal. Held neutrally: these instruments align a supplier with its buyers, and they also mean the buyers' equity claim grows exactly as the supplier's revenue concentration grows.
Insider dealing, twelve months. We parsed all 69 Form 4 filings covering transactions from 25 September 2025 to 1 September 2026. Insiders sold 327,307 shares on the open market for $47.89m (average $146.31) and bought 27,200 shares for $2.11m (average $77.56) — net −300,107 shares, −$45.78m. A further 1,108,424 shares were withheld for tax on vesting (code F), which is not a market sale. All open-market selling was by executive officers; no non-executive director sold.
Capital history — every time they raised money
IPO on Nasdaq 27 June 2000 (as the Bermuda entity). No stock split, bonus or rights issue is disclosed in the FY2026 10-K. The capital events that matter are recent:
- Debt. Eight tranches of unsecured senior notes at 31 January 2026, disclosed effective rates 1.839% to 6.082%: $500m 2026, $499.9m MTG/MTI 2028, $750m 2028, $500m 2029, $500m 2030, $750m 2031, $500m 2033, $500m 2035. The 2030 and 2035 notes were issued 30 June 2025; the 2026 Term Loan was fully repaid; the revolving facility was undrawn at year end.
- Buybacks. $2,040.1m in FY2026 for 26.6m shares at an average $76.46, against $725.0m for 9.0m at $80.47 in FY2025. Cumulatively the programme has retired 348.5m shares for $7,300.1m (average $20.94). Shares outstanding fell 866.0m → 847.3m over FY2026.
- Dividends. $0.24 per share in FY2026 ($205.1m); the quarterly rate remains $0.06, declared again 25 June 2026.
- Preferential issuance. The $2.0bn NVIDIA placement of 31 March 2026 is the only one in the period — a new Series A Convertible Preferred created by a Certificate of Designation filed the same day, conversion price ~$91.8355, issued under the Section 4(a)(2) exemption. MRVL closed January 2026 at $78.86, so the conversion price sits above where the stock traded two months earlier; the filing does not state the price on the transaction date.
- Acquisition stock. ~24.5m shares to Celestial AI holders at closing (2 February 2026) alongside $1.3bn cash, with up to ~27.2m more on revenue milestones through FY2029; further shares and $280.0m cash for XConn.
Shares outstanding went from 847.3m at 31 January 2026 to 876.9m at 21 August 2026 — up 3.5% in under seven months, despite $400.0m of buybacks in the same half.
Who runs it, and the wider web
Matthew J. Murphy is both Chairman and Chief Executive Officer. Brad W. Buss is Lead Independent Director. The board elected at the 25 June 2026 annual meeting: Sara Andrews, Brad W. Buss, Rebecca W. House, Marachel L. Knight, Matthew J. Murphy, Rajiv Ramaswami and Richard P. Wallace.
The finance seat changed hands in June 2026. On 10 June 2026 Willem Meintjes, CFO since January 2023, notified the company of his resignation effective 15 June; the 8-K states the decision "is not the result of any disagreement with the Company on any matter relating to the Company's operations, policies or practices", and that he remains available in an advisory capacity to 17 April 2027. The same day, Daniel Durn — then a director and Chair of the Audit Committee — resigned from the board and was appointed CFO effective 15 June. Durn was previously CFO of Adobe, Applied Materials, NXP and GlobalFoundries. An audit-committee chair moving directly into the CFO role is legal and disclosed; it is noted because the audit committee oversees the CFO's financial reporting, and no successor chair is named in the documents reviewed. Durn does not appear among directors elected at the June 2026 meeting, consistent with his resignation two weeks earlier.
Auditor. Deloitte & Touche LLP, San Jose, PCAOB ID 34, auditor since 2016 — ten years, no change, no resignation. The FY2026 opinion is unqualified, with no going-concern paragraph and no emphasis of matter. One critical audit matter: excess and obsolete inventory valuation, against the $1,388.0m inventory balance. Fees were $6,117,587 audit, $550,000 audit-related, $854,214 tax and $7,391 other — $7,529,192 total, 81.3% of it the audit itself. Ratification passed 706,475,236 to 2,920,281.
Related-party transactions. Item 7 of the FY2026 10-K states, in full: "Related Party Transactions — None." The proxy describes an audit-committee-administered related-person policy and discloses no transaction requiring Item 404 disclosure — a clean result on a check that often is not.
The regulatory and governance record
SEC. No SEC enforcement action, litigation release or AAER naming Marvell Technology, Inc. was located in this research, and Note 8 discloses no pending regulatory proceeding. Two resolved matters are disclosed: $251.0m of charges for product-related claims recognised through the end of FY2024 and fully resolved in Q4 FY2024, and a $50.0m reserve taken in Q3 FY2025 over a contractual disagreement with a customer connected to the FY2025 restructuring, resolved the following quarter "for an amount that was not materially different than initially estimated." No auditor dismissal: we checked every 8-K since 2024 for Item 4.01 and there is none.
The say-on-pay vote is the notable governance fact. At the 25 June 2026 annual meeting the advisory vote on executive compensation passed with 327,552,779 for and 258,555,897 against — approximately 55.9% support of votes cast for or against. A shareholder proposal for an independent board chairman was defeated with 215,860,927 for and 369,216,217 against, or 36.9% support. Among directors, Brad W. Buss drew the most opposition (26,919,345 against) and Matthew J. Murphy the second most (23,233,506). Say-on-pay is advisory and it passed; it is stated because support in the 50-60% band is materially below the level typical for large US companies and is the kind of result that usually prompts board engagement with holders. Any response would appear in the 2027 proxy.
Exchange surveillance. ASM and GSM are Indian exchange mechanisms and have no US equivalent; MRVL trades on the Nasdaq Global Select Market with no disclosed listing deficiency or trading restriction.
Forensic checks — what the accounts show
| Check | What we found | Source | A benign explanation |
|---|---|---|---|
| 1. 5-year CFO ÷ PAT | Cumulative CFO $6,910.3m vs cumulative PAT $267.2m. Cash exceeded reported profit in every one of the five years. FY2026 alone: 1,750.5 ÷ 2,670.1 = 0.66. | 10-K FY2022-FY2026 cash flow statements | This is the inverse of the classic warning sign. Cumulative amortisation of acquired intangibles ($5,159.3m) plus stock-based compensation ($2,811.1m) is $7,970.4m of non-cash charges — more than enough to explain the gap. FY2026's sub-1 ratio is the mirror image: the $1,830.4m gain is in profit but its $2.5bn of cash landed in investing, not operating. |
| 2. Cash vs interest earned | Cash rose to $2,638.8m. Interest income is not separately disclosed — it is bundled into "interest income and other, net" of $1,926.3m, which also contains the divestiture gain. An implied yield cannot be computed. | 10-K FY2026 MD&A | Bundling interest income with other items is common presentation and not required to be split. The 10-K does state there were no investment securities on hand at 31 January 2026 aside from cash and equivalents, so the balance is genuinely liquid. |
| 3. Implied interest rate on debt | $202.6m ÷ average borrowings of $4,267.2m = 4.75% (FY2025: 4.60%). The 10-K's own disclosed effective rates run 1.839% to 6.082%. | 10-K FY2026 Note 7 — Debt | Entirely consistent. The blended rate sits inside the disclosed tranche range, with older low-coupon notes pulling it below the new 2030/2035 issues. |
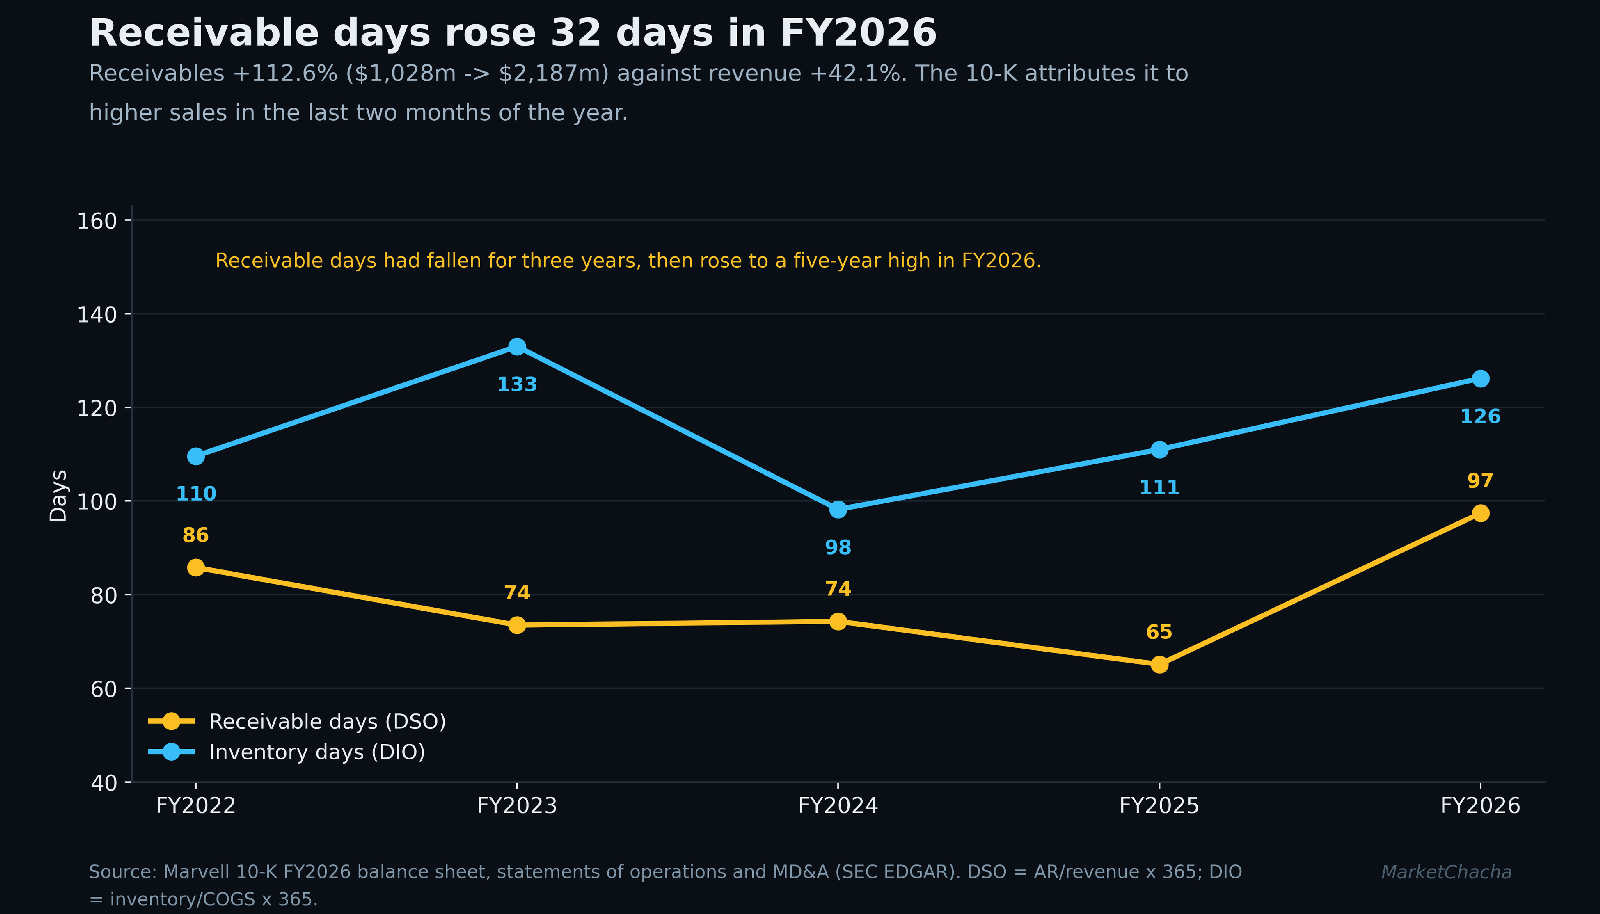
| 4. Receivable and inventory days | DSO 65.1 → 97.4 days (+32.3). Receivables +112.6% against revenue +42.1%. Inventory days 111.0 → 126.2. | 10-K FY2026 balance sheet and MD&A | The MD&A states the increase "was primarily due to higher sales in the last two months of fiscal 2026" — plausible given Q4 was the largest quarter on record. It is still the single largest working-capital move in the file, and the reason FY2026 had a $1.1bn working-capital outflow. |
| 5. Related-party transactions | None. 0% of revenue, 0% of purchases. | 10-K FY2026 Item 7; DEF 14A 2026 | No explanation needed. A clean result. |
| 6. Insider net selling | Net −300,107 shares, −$45.78m over 12 months. Sold 327,307 at avg $146.31; bought 27,200 at avg $77.56. Board and management hold 0.12% in total. | All 69 Forms 4, 25 Sep 2025 – 1 Sep 2026; DEF 14A 2026 | Executives at US large-caps are paid largely in stock and routinely sell, often under Rule 10b5-1 plans; the $45.8m is small against a market value near $192bn. The open-market purchases at ~$77 cut the other way. |
| 7. Auditor | Deloitte & Touche LLP since 2016. No change, no resignation, no qualification in five years. Unqualified FY2026 opinion. One CAM: excess and obsolete inventory. | 10-K FY2026 audit report; 8-K search for Item 4.01 | Nothing to explain. Ten-year tenure with clean opinions and 81% of fees being audit fees is a strong result on this check. |
| 8. Subsidiaries and jurisdictions | 52 subsidiaries; 13 in offshore or low-tax jurisdictions — 6 Cayman, 4 Bermuda, 1 each Singapore, Netherlands, Switzerland. | Exhibit 21.1 to 10-K FY2026 | Most arrived with acquired companies, and the Bermuda entities are residue of the pre-2021 structure in which the listed parent was itself Bermudan. Such structures are legal and widespread in this industry. |
| 9. Dilution and preferential issuance | Shares 847.3m → 876.9m in under seven months. One preferential allotment: $2.0bn of Series A Preferred to NVIDIA at a ~$91.84 conversion price. Contingent claims of 108.99m further shares (12.43%) across the Google and Amazon warrants, NVIDIA conversion and Celestial milestones. | 8-Ks 2 Dec 2025, 31 Mar 2026, 19 Aug 2026; 10-Q Q2 FY2027 | Every instrument is disclosed, priced and conditional. The warrants vest only against actual purchases, so the dilution arrives only if the associated revenue does — which is the point of the structure. |
| 10. Other income as % of PBT | 60.1% of FY2026 pre-tax profit was the divestiture gain ($1,830.4m of $3,046.6m). Operating income was 43.4%. In Q1 FY2027 the same line ran the other way: a −$203.3m charge, including a $433.7m contingent-consideration mark. | 10-K FY2026 MD&A and cash flow; 10-Q Q2 FY2027 | A one-time disposal gain is a real economic event, not an accounting artefact — Infineon paid $2.5bn in cash. The disclosure is clear and the MD&A names it. It simply means FY2026's headline profit and EPS are not a run-rate. |
| 11. Capex vs depreciation | Capex $354.1m vs D&A $348.6m = 1.02x. Asset turnover 0.39x. Goodwill and acquired intangibles were 58.9% of total assets and 87.5% of equity at 1 August 2026. | 10-K FY2026; 10-Q Q2 FY2027 balance sheet | A fabless designer needs little fixed capital — capex tracking depreciation is normal, and low asset turnover follows from a balance sheet dominated by acquisition goodwill rather than plant. For scale, Broadcom's goodwill was 57.2% of its total assets at FY2025 year end. |
| 12. Customer concentration | Distributor A 37% + Direct Customer A 14% = 51% of revenue. Four customers = 73% of gross receivables. Neither is named. | 10-K FY2026 Note 2 | Concentration is inherent to custom silicon: a company that designs a chip for one hyperscaler's programme will, by construction, have a concentrated revenue line. A distributor also aggregates multiple end customers behind one number. |
Valuation arithmetic, for reference only
At $218.82 (14 September 2026 close) and 876.9m shares, market value is about $191.9bn ($196.6bn including the NVIDIA preferred as-converted). Trailing twelve-month net income — Q3 and Q4 FY2026 plus Q1 and Q2 FY2027 — is $2,639.9m, a P/E of about 72.7x; that figure still contains the Q3 FY2026 divestiture gain. Price to book on 1 August 2026 equity of $18,531.6m is 10.4x; on tangible book of $2,311.1m (equity less $13,873.9m goodwill and $2,346.6m intangibles), 83.0x. Named peer: Broadcom at $344.72 against FY2025 diluted EPS of $4.77 is 72.3x. Computations, not judgements — no view on value is offered.
What we could not verify
- The identity of Distributor A and Direct Customer A. The 37% and 14% are disclosed; the names are not, and nothing public resolves them.
- Any named foundry, assembly partner or supplier. The 10-K names countries, never companies, so single-foundry dependency cannot be established from these documents.
- Interest income on the cash balance — bundled with other items, so no implied yield could be computed. Check 2 is incomplete.
- A full 13F aggregation. We used the DEF 14A table, which captures holders above 5% as of 31 January 2026. We did not aggregate every institutional 13F, so a complete top-10 list with quarterly adds and exits is outside what is stated here.
- The tax and cash effect of the offshore subsidiaries. Exhibit 21.1 gives jurisdictions, not each entity's earnings, assets or intra-group flows; the tax note does not break results down by entity.
- The MRVL price on 31 March 2026, the NVIDIA placement date. We have the January month-end close ($78.86) and the conversion price (~$91.8355) but not the close on the day, so the premium or discount cannot be stated.
- Who chairs the Audit Committee after Daniel Durn's June 2026 board resignation — not named in the documents reviewed.
- Q1 FY2027 interest expense and tax were derived by subtraction from reported six-month and Q2 figures, not read from a Q1 statement.
What would change the picture
- The next receivables line. DSO at 97 days either returns toward the 65-75 day band or the "last two months" explanation has to keep being true. The Q3 FY2027 10-Q is the test.
- Whether Distributor A's 37% keeps climbing. It has gone 24% → 34% → 37%; the FY2027 10-K Note 2 gives the next reading.
- Google warrant vesting. Each $500m tranche of custom-product revenue vests 245,871 shares, so how many tranches vest, and how fast, is the clearest public signal of whether that programme is producing revenue.
- The FY2027 audit report — whether the inventory critical audit matter recurs, and whether contingent-consideration fair value (a $433.7m charge in one quarter) becomes a second CAM.
- The 2027 proxy, for the board's response to a 55.9% say-on-pay vote and the named Audit Committee chair.
- Operating income without the one-offs. FY2026's $1,322.9m is the first clean positive in three years; FY2027's first half is $799.1m. Whether that compounds is the whole question, answerable from the income statement alone.
- Broader AI-infrastructure spending, which drives 74% of revenue — see today's movers and the earnings calendar.
Sources
- Marvell Technology, Inc. Form 10-K for fiscal 2026, filed 11 March 2026 — Items 1, 1A, 2, 3, 5, 7, 7A; audit report; consolidated financial statements; Notes 1, 2, 4, 7, 8, 11, 12.
- Exhibit 21.1 — Subsidiaries of Marvell, to the FY2026 Form 10-K.
- Form 10-Q for the quarter ended 1 August 2026, filed 28 August 2026.
- DEF 14A proxy statement, filed 13 May 2026 — beneficial ownership, auditor fees, related-party policy.
- Form 8-K, 25 June 2026 — Item 5.07 annual meeting voting results; Item 8.01 dividend declaration.
- Form 8-K, 11 June 2026 — CFO resignation; appointment of Daniel Durn; his resignation from the board.
- Form 8-K, 19 August 2026 — Google commercial agreement and warrant for up to 58,970,907 shares.
- Form 8-K, 31 March 2026 — $2.0bn NVIDIA Series A Convertible Preferred placement and Certificate of Designation.
- Form 8-K, 2 December 2025 — Celestial AI acquisition agreement, cash and share consideration.
- Form 8-K, 2 December 2025 — Amazon transaction agreement and warrant.
- Form 8-K, 27 August 2026 — Q2 FY2027 results announcement.
- Form 10-K for fiscal 2025, and fiscal 2024 and fiscal 2022 — five-year series.
- SEC XBRL companyfacts, CIK 0001835632 — machine-readable five-year series, cross-checked against the filed statements.
- All Forms 4 filed for Marvell Technology, Inc. — 69 filings covering 25 September 2025 to 1 September 2026.
- SEC XBRL companyfacts, Broadcom Inc. (CIK 0001730168) — peer comparison figures.
- Price history: Yahoo Finance daily and monthly closes for MRVL and AVGO, retrieved 15 September 2026.
- Earlier MarketChacha coverage: Marvell Q2 results: what the numbers say; Why did Marvell rally — up as much as 8%; the Intel kundli (INTC).
FAQ
Did Marvell actually make money in FY2026? Yes — $2,670.1m of net income, its first GAAP profit in five years. But $1,830.4m of the $3,046.6m pre-tax profit was the gain on selling the automotive ethernet business to Infineon for $2.5bn. Operating income was $1,322.9m, which is itself the first clean positive since FY2023.
How concentrated is Marvell's customer base? Two counterparties were 51% of FY2026 revenue — an unnamed distributor at 37% and an unnamed direct customer at 14%. Four customers accounted for 73% of gross receivables at year end. The names are not disclosed and cannot be verified from the filings.
Do NVIDIA, Google and Amazon own Marvell shares? NVIDIA bought $2.0bn of Series A Convertible Preferred in March 2026, convertible into up to 21,778,000 common shares. Google and Amazon hold warrants — up to 58,970,907 and 1,045,171 shares respectively — that vest against their own purchases from Marvell. Together with the Celestial AI milestone shares that is 108.99m potential shares, 12.43% of the current count, none of it outstanding today.
Does Marvell own any chip factories? No. It is fabless. Item 2 of the 10-K lists only design, sales, administration and operations space. The 10-K states most products are made by third-party foundries in Taiwan, with assembly and test mostly in China, Malaysia, Singapore, Taiwan and Canada. No foundry or supplier is named.
Has the auditor ever been changed or raised a qualification? No. Deloitte & Touche LLP has audited Marvell since 2016, the FY2026 opinion is unqualified with no going-concern paragraph, and no Item 4.01 8-K (auditor dismissal or resignation) has been filed. One critical audit matter was raised: valuation of excess and obsolete inventory.
Why did the say-on-pay vote matter? The advisory compensation vote at the June 2026 annual meeting passed with roughly 55.9% support (327.6m for, 258.6m against). It is non-binding and it passed, but that level of support is well below what is typical for a large US company, and a separate proposal for an independent board chairman — the CEO also chairs the board — drew 36.9% support.
Independent research for education and discussion only. Not investment advice, not a recommendation, and not a rating — we issue no buy/sell calls and no target prices. Every figure is sourced from the primary documents linked above; figures can be restated and we can make mistakes, so always verify against the original. Nothing here alleges wrongdoing by any company or individual: where a fact raises a question we state the fact, cite it, and give the benign explanation alongside. Offshore holding structures, pledging and preferential allotments are all legal and common — they are disclosed here as facts, not as accusations.
This article is for educational and informational purposes only. It is not financial advice, investment recommendation, or a solicitation to buy or sell securities. Investing involves significant risks. I am not a SEBI-registered investment advisor. Readers should consult their own financial advisor and conduct their own research before making any investment decisions.
Comments
Join the conversation
Sign in to join the conversation.
Follow replies, add your view, and take part in the discussion.
Sign in to commentLoading comments...