

LALPATHLAB 400+ Rally ?
📊 LALPATHLAB – Technical View
🔹 Long-Term Trend (Since Sep 2025)
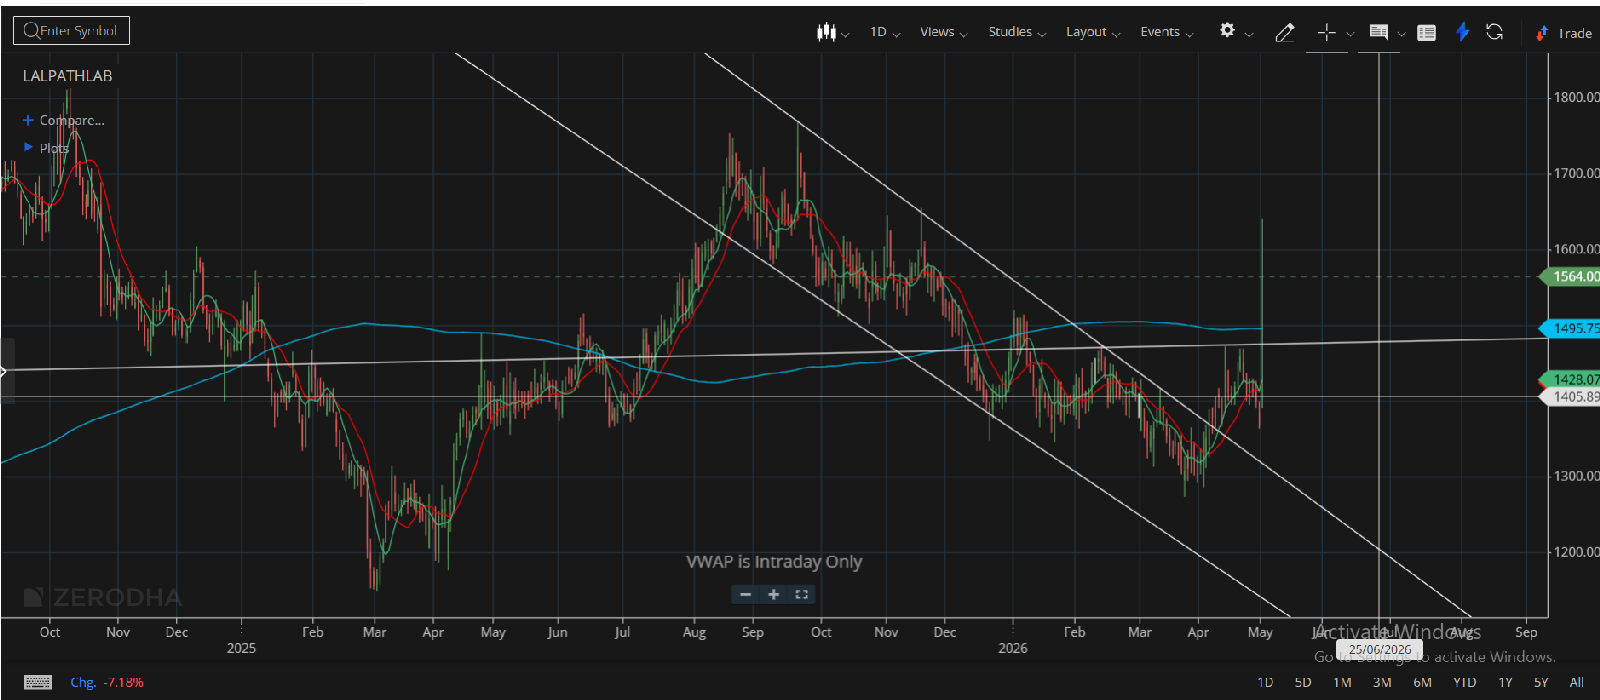
The stock has been in a clear downtrend with consistent lower highs and lower lows. Price followed a downward trendline, indicating continuous selling pressure.
👉 View: Distribution at higher levels followed by a sustained decline.
🔹 Falling Channel (Controlled Downtrend)
Price moved within a structured falling channel:
• Upper band acting as resistance
• Lower band providing support
Repeated rejections near resistance confirm selling on every rise.
👉 View: Controlled and systematic selling, not panic.
🔹 Consolidation + Reversal Pattern (Jan–May 2026)
From mid-Jan to early May, stock moved sideways.
During this phase:
• Inverted Head & Shoulders pattern formed
• Neckline near 1490–1500 zone
• Breakout supported by strong price momentum
👉 View: Early signs of trend shift from consolidation to upward move.
🔹 Key Technical Triggers
✔ Breakout above falling channel
✔ Breakout above 1495 resistance
✔ Support from VWAP & moving averages
✔ Strong bullish candle indicating buying interest
🔹 What to Watch Now
• Above 1500–1520 → Strength may continue towards 1600–1700
• Below breakout zone → Risk of false breakout
🔹 Overall View
The stock is showing a transition from weakness to strength, with improving price structure after a long consolidation phase.
⚠️ Disclaimer
For educational purposes only. Not a buy/sell recommendation. Please consult your financial advisor before investing.
Manjushree Sharma
SEBI Registered Research Analyst (INH000019497)
📞 7000627998
📧 sharma.manjushri@gmail.com
Comments
Join the conversation
Sign in to join the conversation.
Follow replies, add your view, and take part in the discussion.
Sign in to commentLoading comments...