manjushri sharma

manjushri sharma

u/sharma_manjushri • Joined Apr 2026

SEBI Registered Research Analyst | Founder, MS Trading School | Financial Educator | Media-Featured Market Expert | Ex SEBI SMART TRAINER For NSE, BSE, NSDL, CDSL | President, Samridhi Foundation India Manjushree Sharma (Equity Guru MS) is a SEBI-registered Research Analyst and a nationally recognized figure in trading, equity research, and financial education. With over a decade of professional market experience, she has empowered thousands of traders and investors through her research-backed insights and practical training programs.

SEBI Registered Analyst

1 Followers

Follow

15

Reputation

5

Posts

0

Videos

0

Comments

6

Communities

Services Offered

2 services available

Financial services and advisory packages offered by this user.

NIFTY + FUTURE + CASH +OPTIONS COMBO

Signals

₹1999

EQUITY Research-driven stock recommendations focused on wealth creation through fundamentally strong businesses. Receive 1–3 high-conviction trade ideas daily with clear entry, target, and risk management levels. FUTURES High-probability futures trading opportunities based on trend, momentum, and price action analysis. Get 1–3 carefully researched futures trades daily with predefined stop-loss and target levels. OPTIONS Strategic option trading recommendations designed to capitalize on market volatility and directional moves. Receive 1–3 options trades daily with disciplined risk-reward setups. NIFTY Index-focused trading opportunities powered by technical analysis, institutional flow tracking, and market sentiment. Get 1–3 Nifty trading calls daily with precise execution levels.

7000627998Details →

Alpha Trading Signals

Signals

₹5000₹2500

FUTURES High-probability futures trading opportunities based on trend, momentum, and price action analysis. Get 1 carefully researched futures trades daily with predefined stop-loss and target levels. OPTIONS Strategic option trading recommendations designed to capitalize on market volatility and directional moves. Receive 1 options trades daily with disciplined risk-reward setups. NIFTY Index-focused trading opportunities powered by technical analysis, institutional flow tracking, and market sentiment. Get 1 Nifty trading calls daily with precise execution levels.

7000627998Details →

Services listed by individual users. MarketChacha does not verify or endorse any provider.

Shared by manjushri sharma

Posts and videos stay together so the profile feels easy to scan.

Posts (5)Videos (0)Services (2)Comments (0)Communities (6)
sharma_manjushri
c/nifty_analysisSEBI Registered Analyst
u/sharma_manjushri1 month ago

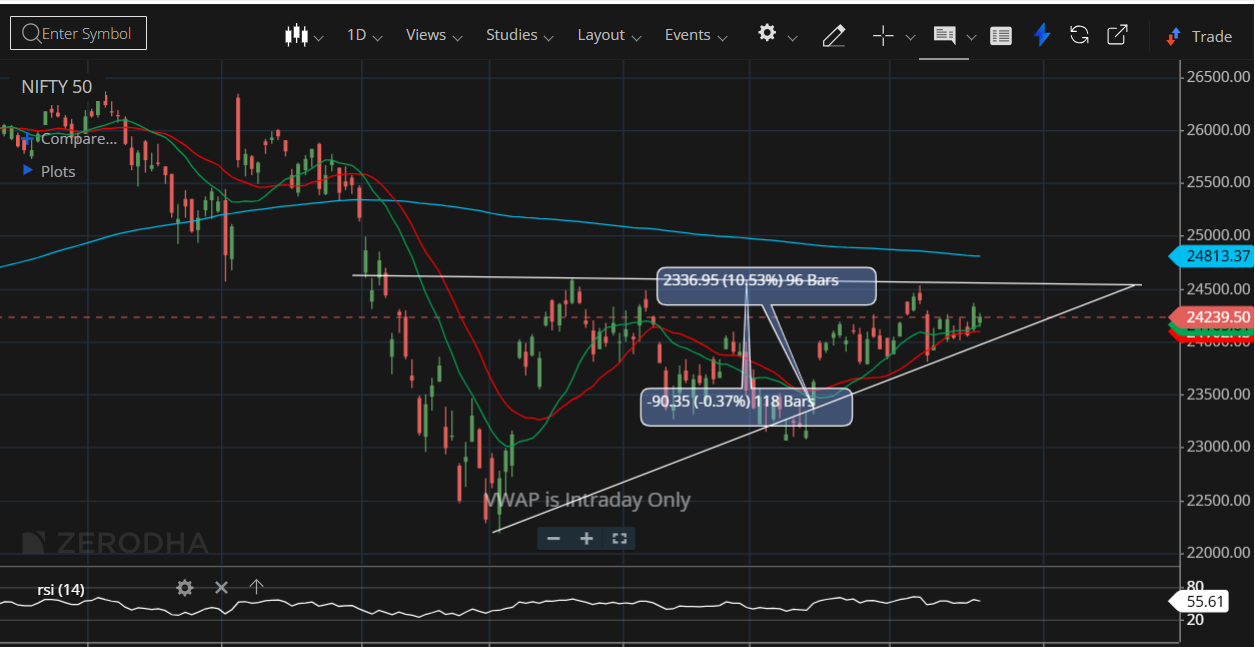
NIFTY Technical Outlook: Ascending Triangle Points to Potential Breakout

NIFTY has recovered strongly from its June low near 22,300 and is now trading near an important resistance zone of 24,500–24,600 . This level has stopped the index from moving higher several times, making it the key hurdle for the next major move. On the daily chart, NIFTY is forming an Ascending Triangle , which is generally considered a bullish pattern. It shows that buyers are becoming more confident, as they are buying every dip at higher levels, while sellers continue to defend the same resistance area. This indicates that buying pressure is gradually increasing. The overall trend remains positive as the index is forming a series of high

NIFTY Technical Outlook: Ascending Triangle Points to Potential Breakout
1
sharma_manjushri
c/nifty_analysisSEBI Registered Analyst
u/sharma_manjushri2 months ago

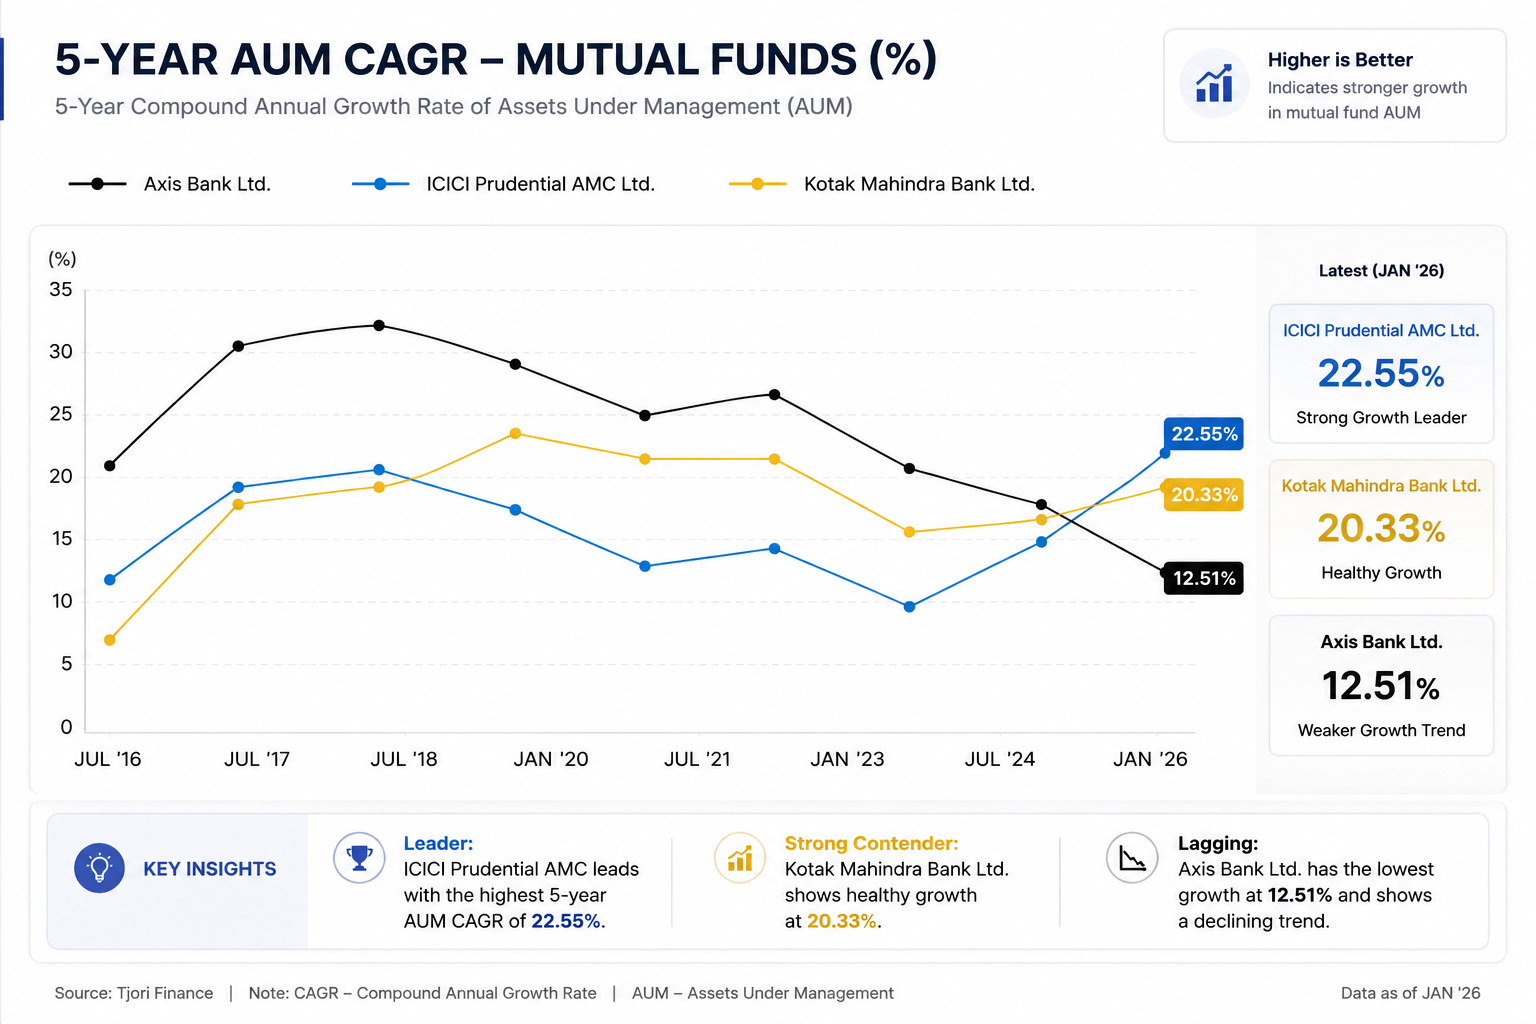
Operational Performance: 5-Year AUM CAGR Comparison

5-Year Mutual Fund AUM Growth: Who's Leading the Race? I recently looked at how three big financial institutions have grown their mutual fund businesses over the last 5 years. Here's what the numbers show: 5-Year AUM CAGR (Growth Rate): • ICICI Prudential AMC: 22.55% • Kotak Mahindra Bank: 20.33% • Axis Bank: 12.51% What does AUM growth actually mean? AUM stands for Assets Under Management. When this number goes up year after year, it means more people are trusting the company with their money. It's a sign of a healthy, growing business. A higher growth rate usually means: - More investors are putting money in - The company is attracting new

Operational Performance: 5-Year AUM CAGR Comparison
3
sharma_manjushri
c/indianmarketsSEBI Registered Analyst
u/sharma_manjushri4 months ago

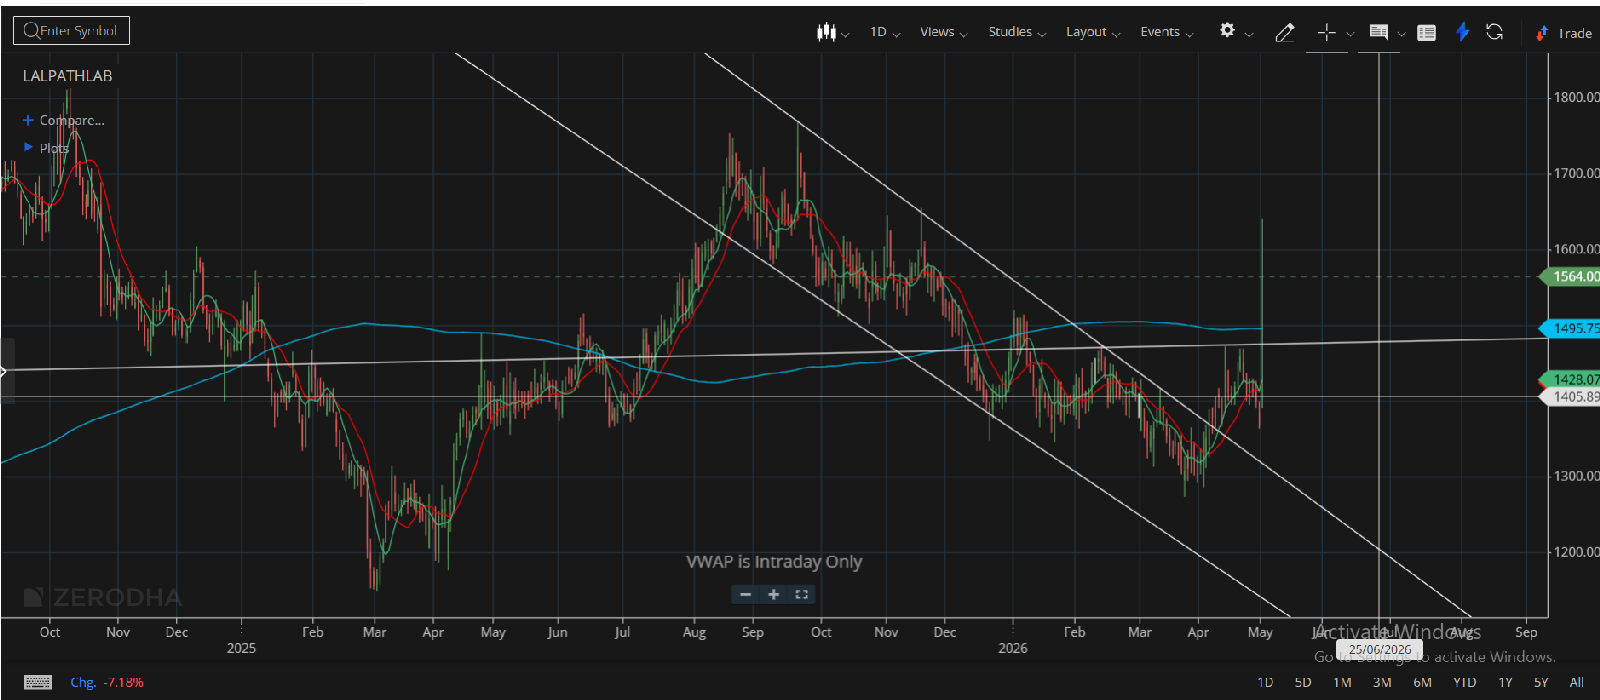
LALPATHLAB 400+ Rally ?

📊 LALPATHLAB – Technical View 🔹 Long-Term Trend (Since Sep 2025) The stock has been in a clear downtrend with consistent lower highs and lower lows. Price followed a downward trendline, indicating continuous selling pressure. 👉 View: Distribution at higher levels followed by a sustained decline. 🔹 Falling Channel (Controlled Downtrend) Price moved within a structured falling channel: • Upper band acting as resistance • Lower band providing support Repeated rejections near resistance confirm selling on every rise. 👉 View: Controlled and systematic selling, not panic. 🔹 Consolidation + Reversal Pattern (Jan–May 2026) From mid-Jan to early

LALPATHLAB 400+ Rally ?
2

No more posts.