

What Is Happening on the HAL Chart?
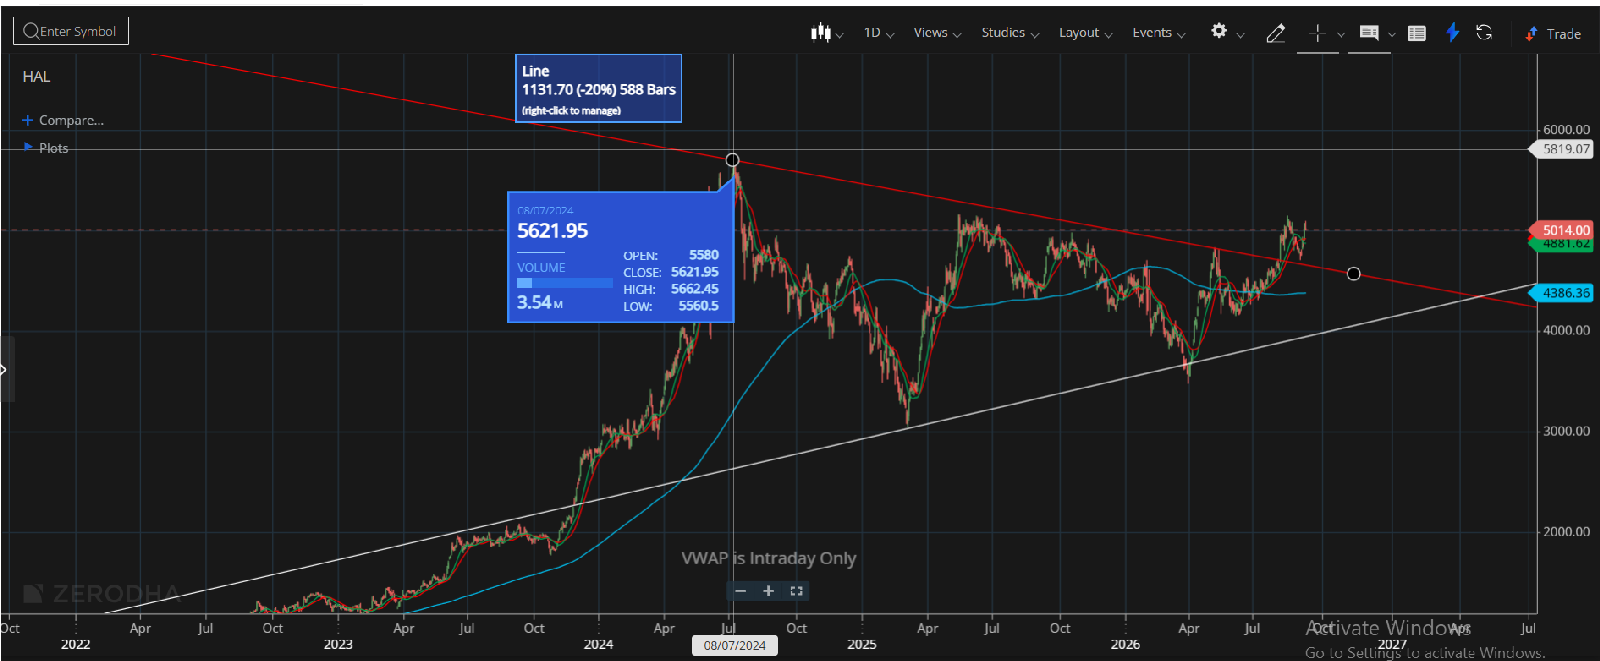
https://whatsapp.com/channel/0029VbBYpzWJJhzg78JVfR3MAfter a significant upward movement, HAL entered a broad consolidation phase. Instead of continuing immediately higher, the stock began forming a series of lower highs and higher lows.
The falling resistance line connects the successive highs, while the rising support line connects the successive lows. As these two trendlines converge, they create the shape of a Symmetrical Triangle.
This is generally considered a continuation pattern, although the eventual breakout can occur in either direction. Therefore, the direction of the breakout and confirmation are more important than the pattern alone.
1. Lower Highs Form the Descending Resistance
The upper boundary of the pattern slopes downward.
Each major rally has encountered selling pressure at progressively lower levels, creating a sequence of lower highs. This demonstrates that sellers have repeatedly defended the upper portion of the consolidation.
However, the recent price action is important because HAL has moved toward—and attempted to cross—the descending resistance line.
A sustained move above this trendline would indicate that the selling pressure represented by the upper boundary is weakening.
2. Higher Lows Show Buying Interest
At the same time, HAL has established a series of higher lows.
The rising lower trendline indicates that buyers have been willing to enter the stock at progressively higher levels rather than allowing the price to return to previous lows.
This creates an important technical conflict:
Sellers → Lower highs
Buyers → Higher lows
As the range contracts, the market approaches a point where one side is likely to gain control.
3. The ₹5,000–₹5,100 Zone Becomes Important
The current price action is concentrated around the ₹5,000–₹5,100 area, which coincides with the upper portion of the triangle and the recent breakout attempt.
A breakout should ideally be accompanied by:
A strong daily candle close above resistance
Sustained price acceptance above the breakout zone
Expansion in trading volume
Follow-through buying in subsequent sessions
A temporary move above resistance followed by a close back inside the triangle could instead represent a false breakout.
4. Why the Pattern Is Interesting for Traders
The significance of the triangle is not simply its shape.
The pattern provides traders with a clearly identifiable framework:
Resistance → Descending trendline
Support → Rising trendline
Trigger → Breakout from the pattern
Invalidation → Failure back inside/below the breakout structure
This allows traders to define their risk before entering rather than buying purely because the stock has moved upward.
5. What Could Happen Next?
If HAL successfully establishes itself above the descending trendline, the market may shift from consolidation to trend continuation.
The immediate area around ₹5,150–₹5,200 can act as the next resistance zone, while the previous major high around ₹5,500–₹5,520 becomes an important larger resistance reference.
On the other hand, rejection from the breakout zone and a move back below the pattern's resistance would weaken the bullish interpretation.
Therefore, the key point is confirmation rather than anticipation.
Technical Takeaway
HAL's daily chart currently presents a Symmetrical Triangle formation following a strong prior uptrend. The recent price action is testing the upper boundary of this structure, making the ₹5,000–₹5,100 region an important technical decision zone.
A sustained breakout with confirmation would strengthen the bullish continuation case, while failure to hold above the breakout area could result in further consolidation within the triangle.
The pattern itself is not a guarantee of direction—the breakout, confirmation, volume and subsequent price acceptance determine the quality of the setup.
Disclaimer
This article is provided strictly for educational and informational purposes to explain technical-analysis concepts and chart patterns. It should not be construed as investment advice, a research recommendation, solicitation, or an offer to buy or sell any security or financial instrument.
Technical analysis is based on historical price and volume behaviour and may not accurately predict future market movements. Markets involve risk, and investors/traders may incur losses. Past performance or historical chart patterns do not guarantee future results.
Any securities or instruments mentioned in this article are used for educational illustration only. Readers should conduct their own research and consider their financial objectives and risk tolerance before making any investment or trading decision.
Comments
Join the conversation
Sign in to join the conversation.
Follow replies, add your view, and take part in the discussion.
Sign in to commentLoading comments...