

Nifty By Equity Guru MS

Nifty By Equity Guru MS

c/nifty_analysis

Welcome to a focused trading community where I share my daily Nifty analysis, trade setups, and real-time market insights. As a SEBI-registered Research Analyst, my goal is to help you understand how smart money moves, not just where the market goes. If you value logic over tips, you’re in the right place.

publicindicesStarted Apr 202613 posts21 members
Log in to join

Join to post, ask questions, and follow the conversations that fit your market style.

Why join c/nifty_analysis?

Real conversations

Ask what you are missing and compare notes.

Focused and relevant

One community, one cleaner thread of discussion.

Learn and grow

Read first, then post when you have a view.

What Is Happening on the HAL Chart?

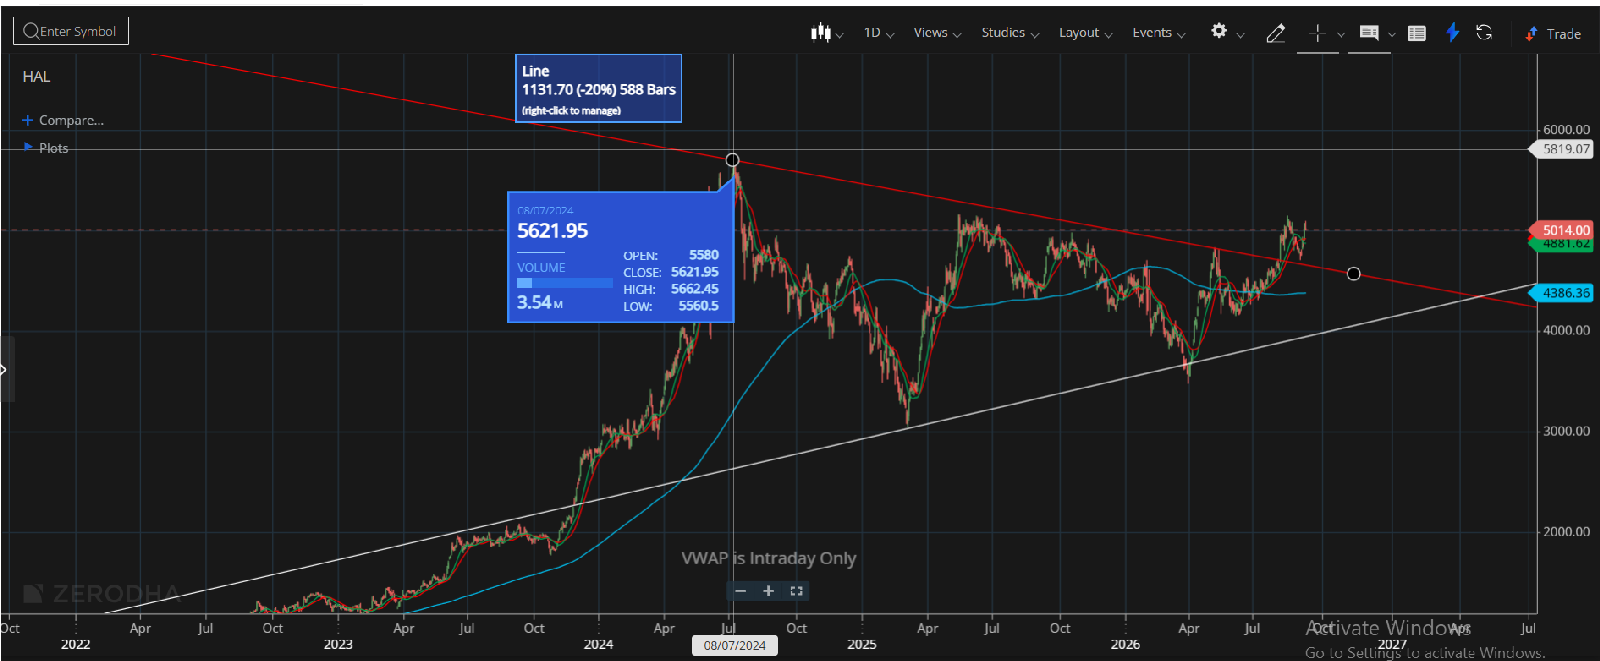
https://whatsapp.com/channel/0029VbBYpzWJJhzg78JVfR3M After a significant upward movement, HAL entered a broad consolidation phase. Instead of continuing immediately higher, the stock began forming a series of lower highs and higher lows . The falling resistance line connects the successive highs, while the rising support line connects the successive lows. As these two trendlines converge, they create the shape of a Symmetrical Triangle . This is generally considered a continuation pattern , although the eventual breakout can occur in either direction. Therefore, the direction of the breakout and confirmation are more important than the patte…
What Is Happening on the HAL Chart?
0
sharma_manjushri
3 months ago

NIFTY Technical Outlook: Ascending Triangle Points to Potential Breakout

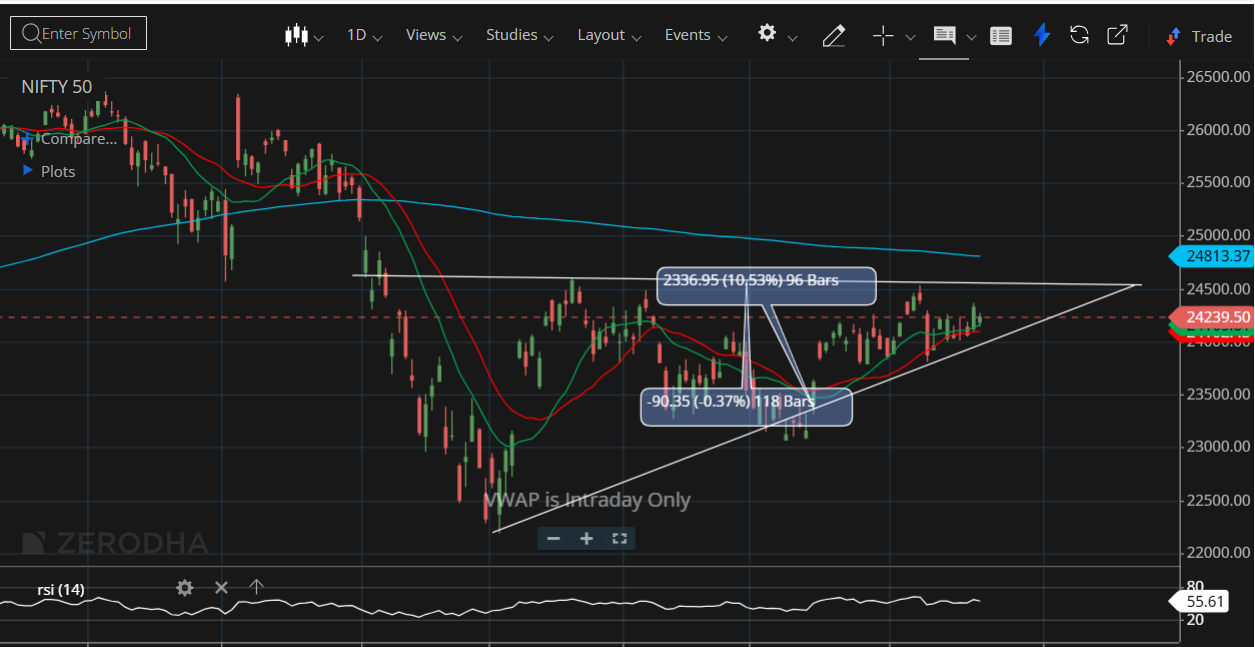
NIFTY has recovered strongly from its June low near 22,300 and is now trading near an important resistance zone of 24,500–24,600 . This level has stopped the index from moving higher several times, making it the key hurdle for the next major move. On the daily chart, NIFTY is forming an Ascending Triangle , which is generally considered a bullish pattern. It shows that buyers are becoming more confident, as they are buying every dip at higher levels, while sellers continue to defend the same resistance area. This indicates that buying pressure is gradually increasing. The overall trend remains positive as the index is forming a series of high…

NIFTY Technical Outlook: Ascending Triangle Points to Potential Breakout
1
sharma_manjushri
3 months ago

Operational Performance: 5-Year AUM CAGR Comparison

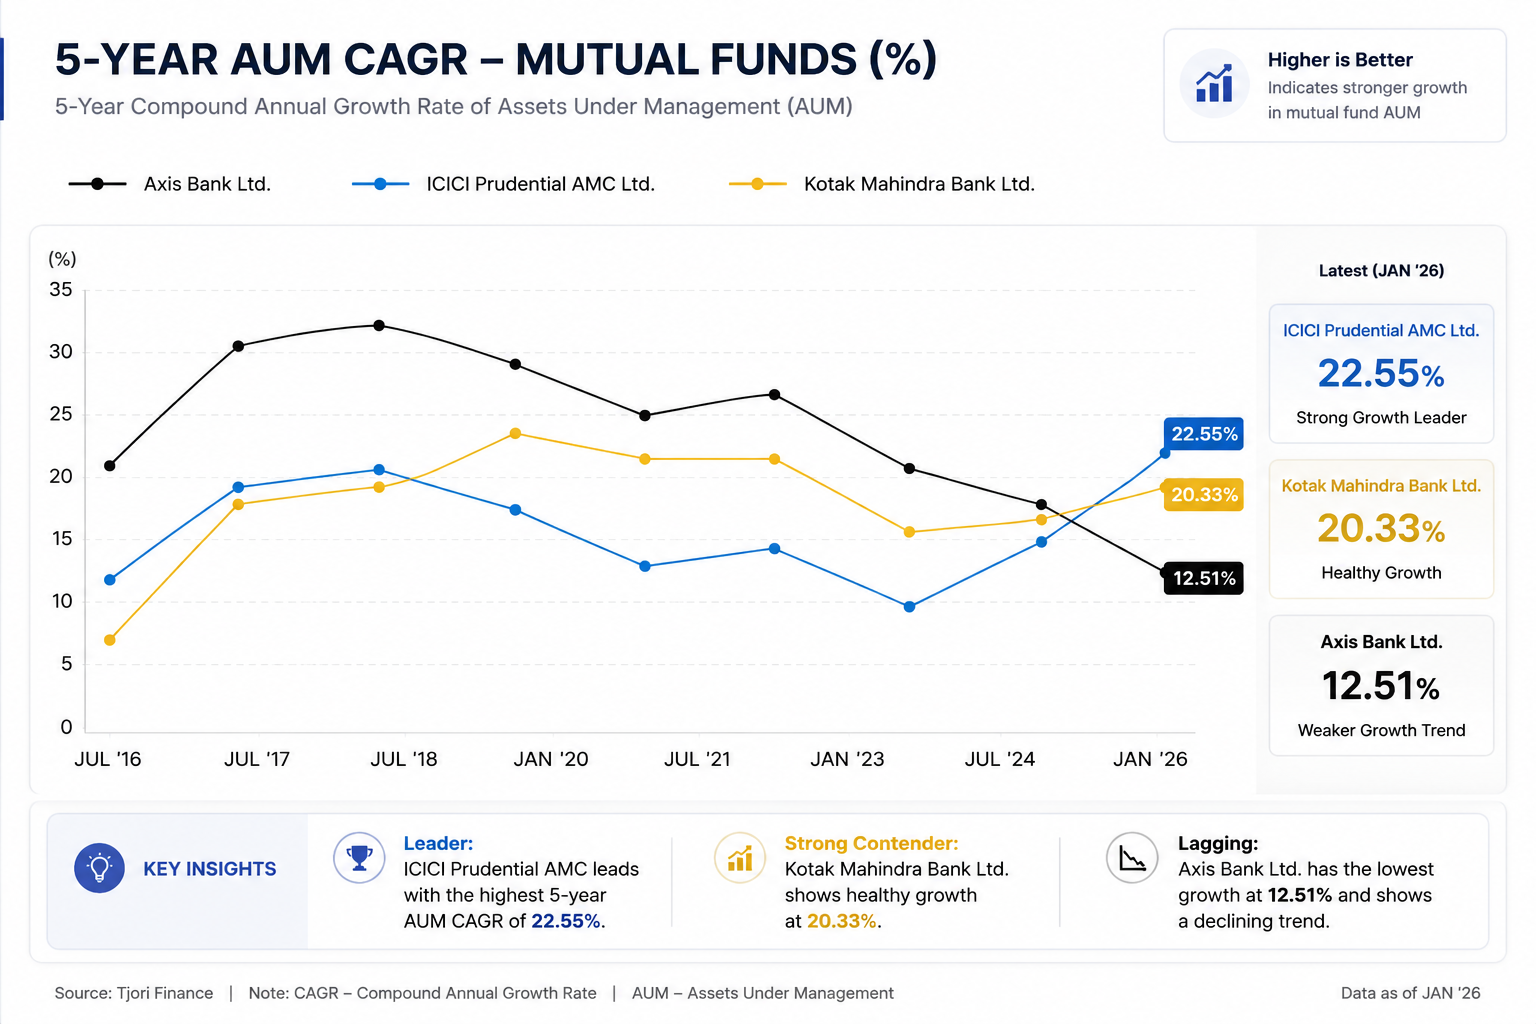
5-Year Mutual Fund AUM Growth: Who's Leading the Race? I recently looked at how three big financial institutions have grown their mutual fund businesses over the last 5 years. Here's what the numbers show: 5-Year AUM CAGR (Growth Rate): • ICICI Prudential AMC: 22.55% • Kotak Mahindra Bank: 20.33% • Axis Bank: 12.51% What does AUM growth actually mean? AUM stands for Assets Under Management. When this number goes up year after year, it means more people are trusting the company with their money. It's a sign of a healthy, growing business. A higher growth rate usually means: - More investors are putting money in - The company is attracting new…

Operational Performance: 5-Year AUM CAGR Comparison
3