

What is volume in stocks — and how do you tell a real breakout from a fakeout?
Volume is simply the number of shares that changed hands in a given period — a day, an hour, a single candle. On its own it tells you nothing about direction. What it tells you is how many people were involved in the price move you are looking at, and that is why traders use it as a lie-detector: a price breaking above resistance on huge volume is a very different event from the same break on a quiet afternoon, even though the chart line looks identical. This guide covers what volume actually measures, how to turn a raw number into the ratio that matters, how a real breakout differs from a fakeout, when a volume spike means nothing at all, and how the same idea works on Indian exchanges.
What volume actually measures — and what it doesn't
Volume counts shares traded, not trades and not money. If one investor buys 10,000 shares in a single order, that is 10,000 of volume, the same as a hundred people buying 100 shares each. The rupee or dollar version of the same idea is called turnover or value traded — shares multiplied by price — which is why a ₹2,000 stock and a ₹20 stock can have wildly different share volumes but similar turnover.
The single most common beginner error is thinking a big volume bar means "more buyers than sellers". That is impossible. Every share sold is a share bought — every trade has both sides, by definition. Volume measures participation, not the balance of demand. A 5-million-share day means 5 million shares found both a willing seller and a willing buyer; whether that was eager buyers lifting offers or panicked sellers hitting bids is something you read from the price, not from the volume bar.
Volume is also, always, relative to the stock itself. NVIDIA (NVDA) has averaged roughly 130 million shares a day recently — about 129.4 million on a 20-day basis per stockanalysis.com and about 130.7 million on a three-month basis per Yahoo Finance, both as of mid-September 2026. For a small-cap, 130 million shares would be an extraordinary event. For NVDA it is an ordinary Tuesday. Comparing one stock's volume to another's is meaningless; comparing a stock's volume to its own recent average is the whole game.
A worked example: turning raw volume into relative volume
The ratio traders actually use is relative volume, usually shortened to RVOL. The arithmetic is deliberately simple:
RVOL = today's volume ÷ the average volume over the last N days (20 days is the most common choice).
Take an illustrative stock trading in a range with resistance at $104. Over the previous 20 sessions it averaged 2,000,000 shares a day. Now two different things happen:
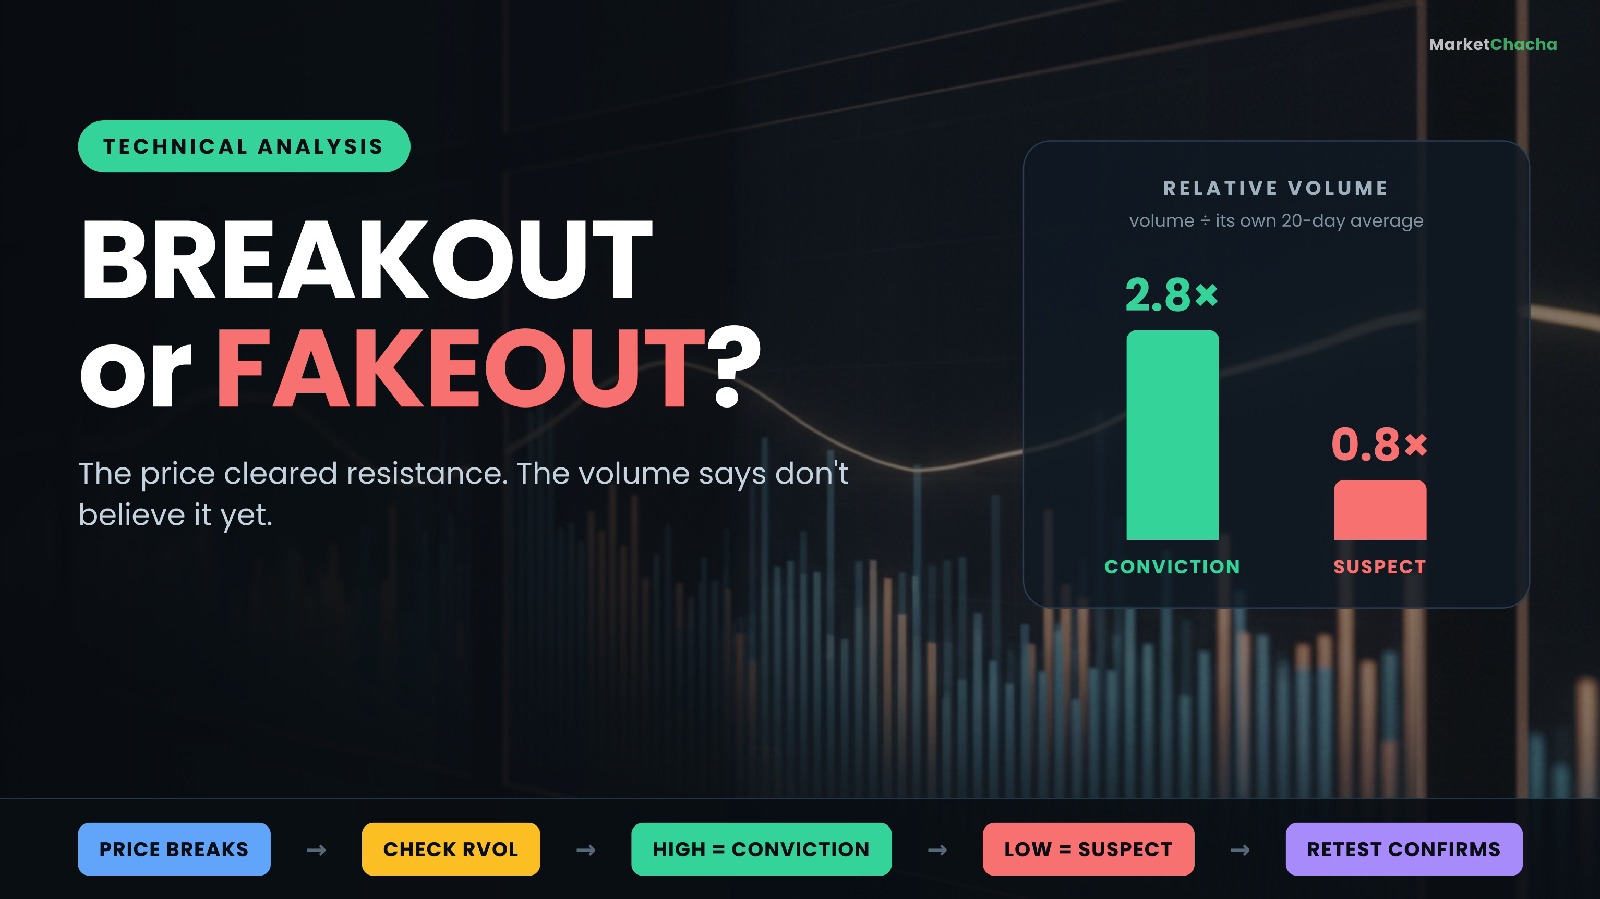
- Case A. Price closes at $107.60, clearly above $104, and the day trades 5,600,000 shares. RVOL = 5,600,000 ÷ 2,000,000 = 2.8×. Nearly three times the normal crowd showed up to push price through that level.
- Case B. Price pokes to $105.10, also above $104, but the day trades only 1,600,000 shares. RVOL = 1,600,000 ÷ 2,000,000 = 0.8×. Fewer people than usual participated in a move that supposedly marked a change of trend.
Both are "breakouts" if you only look at the price line. Only one has a crowd behind it. That difference is the entire reason volume sits under almost every chart by default.
Real breakout vs fakeout: what it looks like on the chart
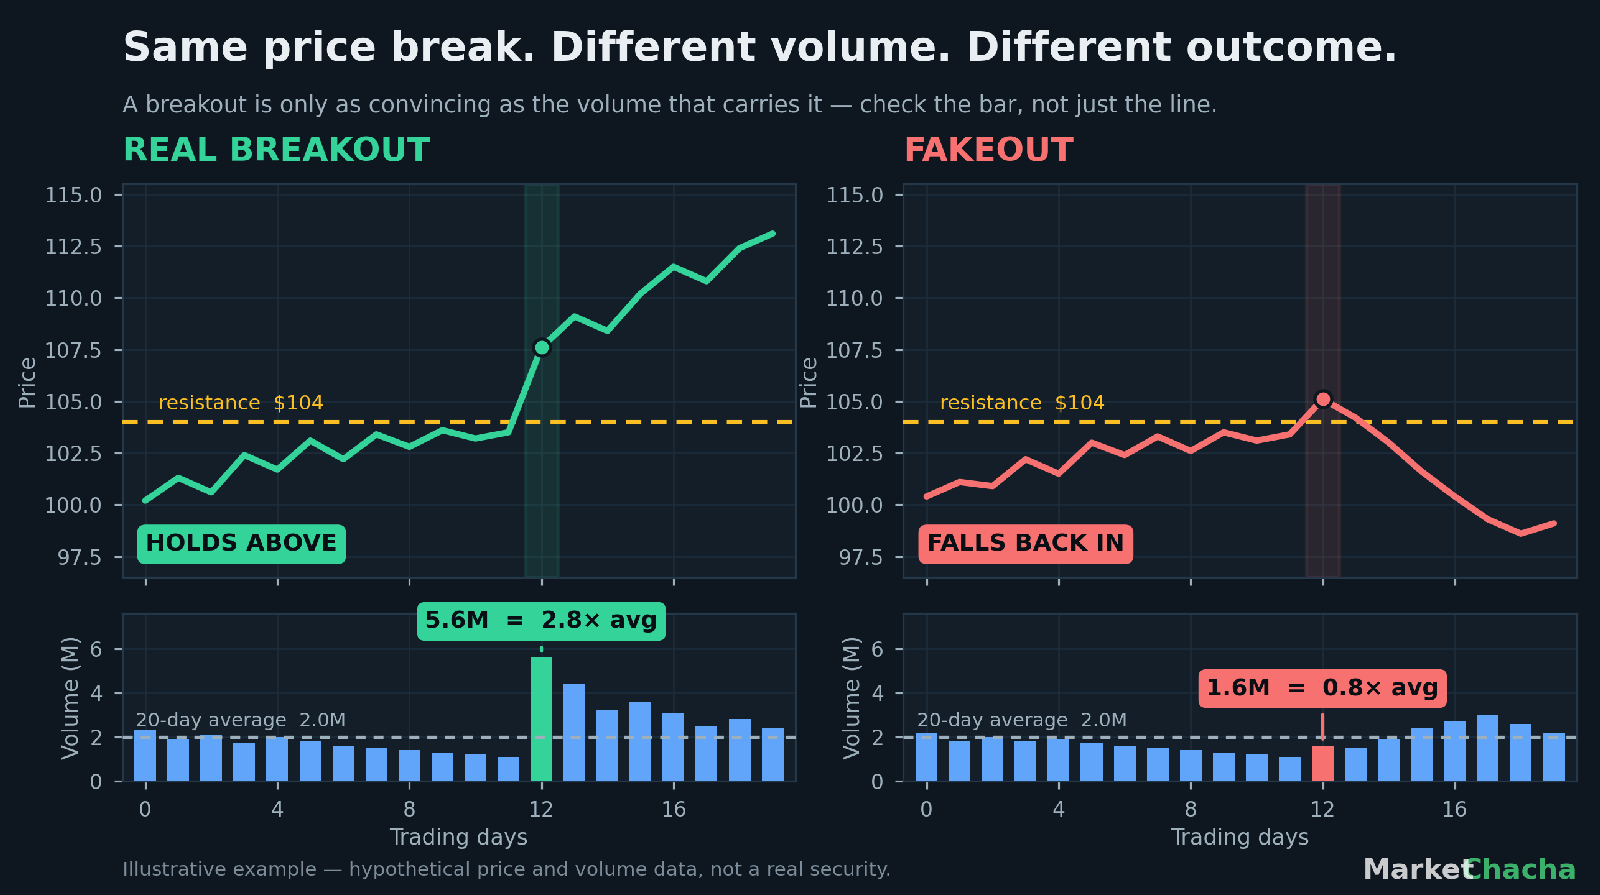
In Case A the heavy bar is followed by volume that stays above average for several more sessions. That persistence matters: one big bar can be a single institution filling an order, but sustained elevated volume suggests a genuine change in who wants to own the stock and at what price. Price holds above the old resistance, and $104 — the ceiling — starts acting as a floor. If you have read our guide to support and resistance levels, this flip is the behaviour that makes a level worth watching in the first place.
In Case B the thin bar is the tell. The move above $104 had no crowd, the stock closes back inside the range within a couple of sessions, and then sells off on rising volume — the mirror image of what you want. Traders call this a fakeout, a false breakout or a failed breakout; the names differ, the anatomy does not. Notice which side the heavy volume showed up on: in a fakeout the conviction arrives on the way back down.
The same logic grades the classic chart formations. A flag or pennant breakout is conventionally read as stronger when the flagpole formed on heavy volume, the flag itself drifted on light volume, and the breakout re-expands volume. A head and shoulders neckline break is read as more convincing when the break itself carries above-average volume. Volume rarely gives you a signal by itself — it grades the move the price just made.
Why volume matters even if you never trade a breakout
There is a second, more practical reason to check volume, and it applies to long-term investors too: volume is your exit. A stock that trades 50,000 shares a day may look cheap and interesting, but if you build a position of 20,000 shares you own 40% of a typical day's entire trading. Selling that in a hurry means walking the price down against yourself. This is the difference between a paper price and a price you can actually get, and it shows up as a wider bid-ask spread and worse fills.
Thin volume also makes a chart less trustworthy. Levels, patterns and indicators all assume the price is the product of many participants disagreeing. In a stock where four trades set the day's range, the pattern is mostly noise.
Volume patterns worth knowing
- Volume dry-up. A quiet, contracting range with steadily falling volume is often described as a coiled spring — nobody is arguing about price. Many breakout traders specifically look for this before a move.
- Climax volume. An enormous volume bar after an extended trend, with the price closing far from its extreme, is commonly read as exhaustion — the last wave of participants getting in at the worst moment.
- Volume divergence. Price makes a new high but each successive push comes on lighter volume, suggesting the move is running on fewer and fewer participants.
- Up-volume vs down-volume. Rather than the bar height alone, many traders compare volume on up days against volume on down days over the same stretch to judge which side is more motivated.
Treat every one of these as a description, not a rule. None is a guarantee, and all of them fail regularly.
When a big volume spike means nothing at all
This is the part most beginner guides skip, and it is where RVOL quietly misleads people. Volume can explode for reasons that have nothing to do with anyone's opinion of the stock:
- Derivatives expiry and witching days. When stock options, stock index options and stock index futures all expire on the same day, volume balloons market-wide. This happens on the third Friday of March, June, September and December, and today, Friday 18 September 2026, is exactly such a session — these are routinely among the heaviest-volume days of the quarter. The accurate name is triple witching; you will still see it called "quadruple witching", a legacy term from when single-stock futures also expired alongside, but those have not traded in the US since 2020. Either way, a 3× RVOL reading on a day like this tells you about the calendar, not about the company. You can check what's coming on the MarketChacha calendar.
- Index rebalancing. When a stock is added to or dropped from a major index, funds tracking that index must trade it, often in one enormous closing auction. That is forced, mechanical demand.
- Block and bulk deals. One institution selling a large stake to another can print millions of shares in a single transaction that says nothing about broad participation.
- Scheduled news. Earnings day volume is almost always a multiple of normal. That is information arriving, not a breakout confirming.
Before you treat a volume spike as conviction, ask the boring question first: was there an obvious mechanical reason for it?
Three things volume is not
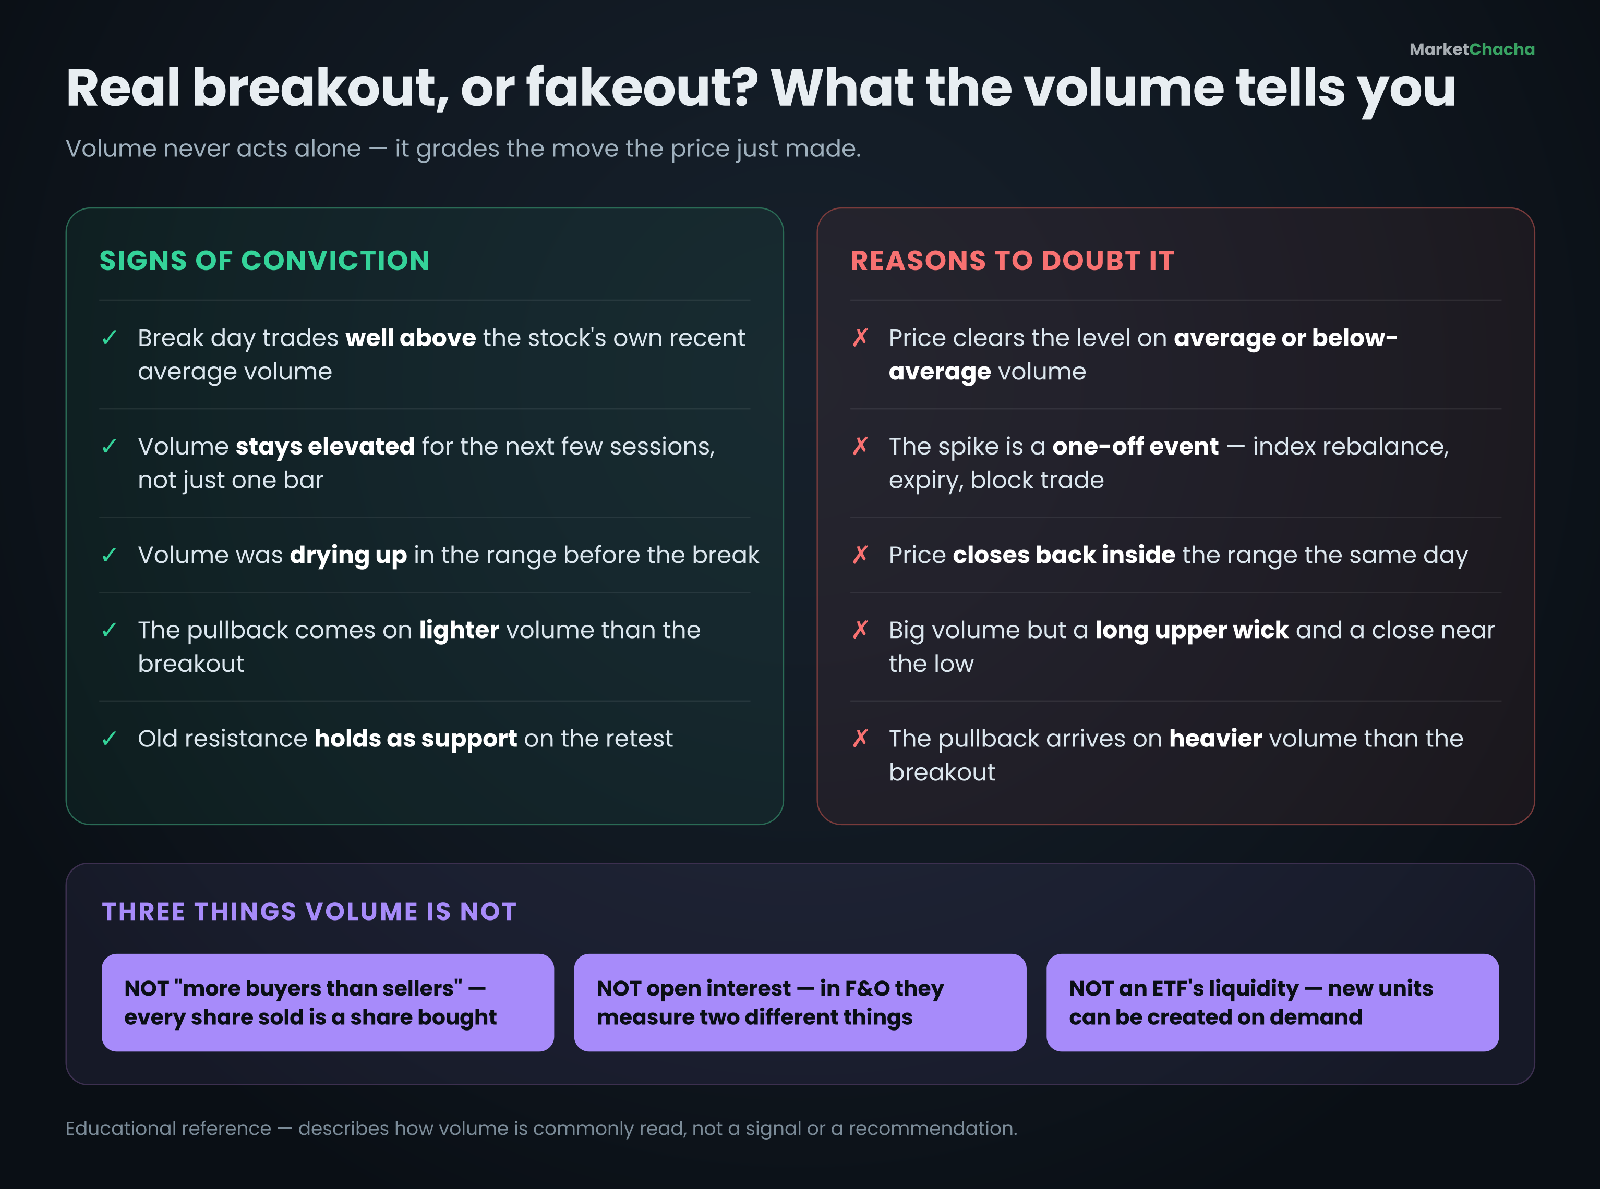
It is not "more buyers than sellers." Covered above, and worth repeating because the phrase appears constantly in market commentary.
It is not open interest. In futures and options, volume counts contracts traded during the session while open interest counts contracts still outstanding at the end of it. A day can have huge volume and falling open interest — that is positions being closed, not new money arriving.
It is not an ETF's liquidity. An ETF's on-screen volume can be modest while the fund remains easy to trade in size, because authorised participants can create new units from the underlying basket. Judging an ETF purely by its displayed volume is one of the more expensive beginner mistakes.
One structural footnote for US stocks: a large share of American equity trading does not happen on a stock exchange at all. Off-exchange activity reported through FINRA's Trade Reporting Facilities was 50.6% of total consolidated volume in 2025, against a record average of 17.6 billion shares traded per day, per Cboe's 2025 US Equities Year in Review and SIFMA's 2026 Capital Markets Fact Book; Cboe's live market-share page showed a five-day average of roughly 51% as of 17 September 2026. Those off-exchange prints are included in the consolidated volume your chart shows — but a feed that displays only one exchange's volume will understate the real figure substantially.
Common mistakes beginners make
- Reading volume in isolation. Volume grades a price move. Without the price context — where the bar closed within its range, which level was involved — the number means little.
- Comparing across stocks. Always compare a stock to its own average, never to another ticker.
- Using intraday RVOL without adjusting for time of day. Volume is heavily front- and back-loaded: the open and the close are far busier than midday. Comparing 10:15 a.m. volume against a full-day average will make almost every morning look explosive. Proper intraday RVOL compares this 10:15 against previous days' 10:15.
- Treating a fixed multiple as a rule. You will often see "1.5× or 2× average volume confirms a breakout". It is a widely used convention, not a law of markets, and no threshold reliably separates real moves from false ones. Liquid large-caps and thin small-caps behave very differently.
- Forgetting the calendar. See the section above. Expiry, rebalance and earnings days distort everything.
How to actually use volume: a practical checklist
- Set the baseline. Put a 20-day (or 50-day) average volume line on your volume panel so every bar is instantly readable as a ratio rather than a raw number.
- Check the calendar before the chart. Expiry day, index rebalance, results date — rule out mechanical causes first.
- Read the close, not just the bar. Heavy volume with a close near the high of the range is read very differently from heavy volume with a long upper wick and a close near the low.
- Wait for persistence. One bar is an event; several sessions of above-average volume is a change in participation.
- Watch the retest. Conventionally, a pullback to the broken level on light volume is read as constructive; a pullback on heavy volume is read as the breakout failing.
- Size to the liquidity, not to the idea. Whatever the chart says, check that your intended position is small relative to typical daily volume.
How this works in India
The mechanics are identical on the NSE and BSE — volume is shares traded, turnover is the rupee value — but Indian markets publish one extra number that US investors do not get, and it is genuinely useful: delivery volume.
A large share of Indian equity volume is intraday, squared off before the close, and never actually settled into anyone's demat account. The exchanges publish, for every stock every day, the deliverable quantity and the percentage of deliverable quantity to traded quantity. A breakout on heavy volume where only 20% of that volume was taken to delivery has a very different character from the same breakout where 70% went to delivery. The second suggests people actually took ownership; the first suggests day traders passing the parcel. Many Indian investors treat delivery percentage as a conviction filter layered on top of ordinary volume — it is available free on the NSE website and in most broker terminals.
The expiry-day distortion is if anything sharper in India, because the derivatives calendar is unusually active and the rules recently changed. Under SEBI's framework standardising expiry days, effective 1 September 2025, NSE equity derivative contracts expire on Tuesdays and BSE contracts on Thursdays. Volume on those sessions is inflated by position rolls and settlement activity, so relative-volume readings on an expiry day should be discounted the same way you would discount a witching Friday in the US.
One structural difference works in India's favour. There is no meaningful off-exchange or dark-pool segment for Indian cash equities — trades execute on the NSE and BSE order books, and large negotiated trades go through the disclosed bulk-deal and block-deal windows. The volume on your screen is, to a much greater extent than in the US, the whole picture. Bulk and block deal disclosures are published daily by the exchanges, which makes it straightforward to check whether a strange volume spike was simply one large institutional transaction.
FAQ
What does volume mean in the stock market? Volume is the number of shares traded during a period — a day, an hour or a single candle. It measures how many shares changed hands, not whether buyers or sellers were stronger, since every trade has a buyer and a seller.
What is a good relative volume for a breakout? There is no official threshold. Many traders use a convention of roughly 1.5 to 2 times the stock's 20-day average volume as a sign of genuine participation, but this is a rule of thumb rather than a rule — thin small-caps and heavily traded large-caps behave very differently, and no multiple reliably separates real breakouts from false ones.
How do you tell a fake breakout from a real one? Look at whether the crowd showed up. A breakout on well-above-average volume that stays elevated for several sessions, then pulls back to the broken level on light volume, is the conventional picture of a real one. A break on average or below-average volume, a close back inside the range, or a pullback on heavy volume all point the other way.
Does high volume mean a stock will go up? No. Volume has no direction of its own. High volume on a day the stock falls hard means a lot of people participated in the decline. Volume tells you how significant a move was, not which way the next one goes.
Why is volume so high on some days for no reason? Usually there is a mechanical reason rather than a company one: a derivatives expiry or witching day, an index rebalance forcing tracker funds to trade, a single large block deal, or a scheduled earnings release. Check the calendar before reading a spike as conviction.
What is the difference between volume and open interest? Volume counts contracts or shares traded during a session. Open interest, which applies to futures and options, counts positions still open at the end of it. High volume with falling open interest means positions are being closed rather than new ones opened.
Educational content only — not investment advice, and not a recommendation of any security or strategy. Chart examples use illustrative, hypothetical data. Market data and rules change — always verify current figures with the source. [Sources: Cboe 2025 US Equities Year in Review, Cboe US Equities Market Volume Summary, SIFMA 2026 Capital Markets Fact Book, stockanalysis.com, Yahoo Finance, TradeStation (2026 witching dates), NSE India, SEBI] Always do your own research.
This article is for educational and informational purposes only. It is not financial advice, investment recommendation, or a solicitation to buy or sell securities. Investing involves significant risks. I am not a SEBI-registered investment advisor. Readers should consult their own financial advisor and conduct their own research before making any investment decisions.
Comments
Join the conversation
Sign in to join the conversation.
Follow replies, add your view, and take part in the discussion.
Sign in to commentLoading comments...