

What is a recession, actually — and is it really two quarters of negative GDP?
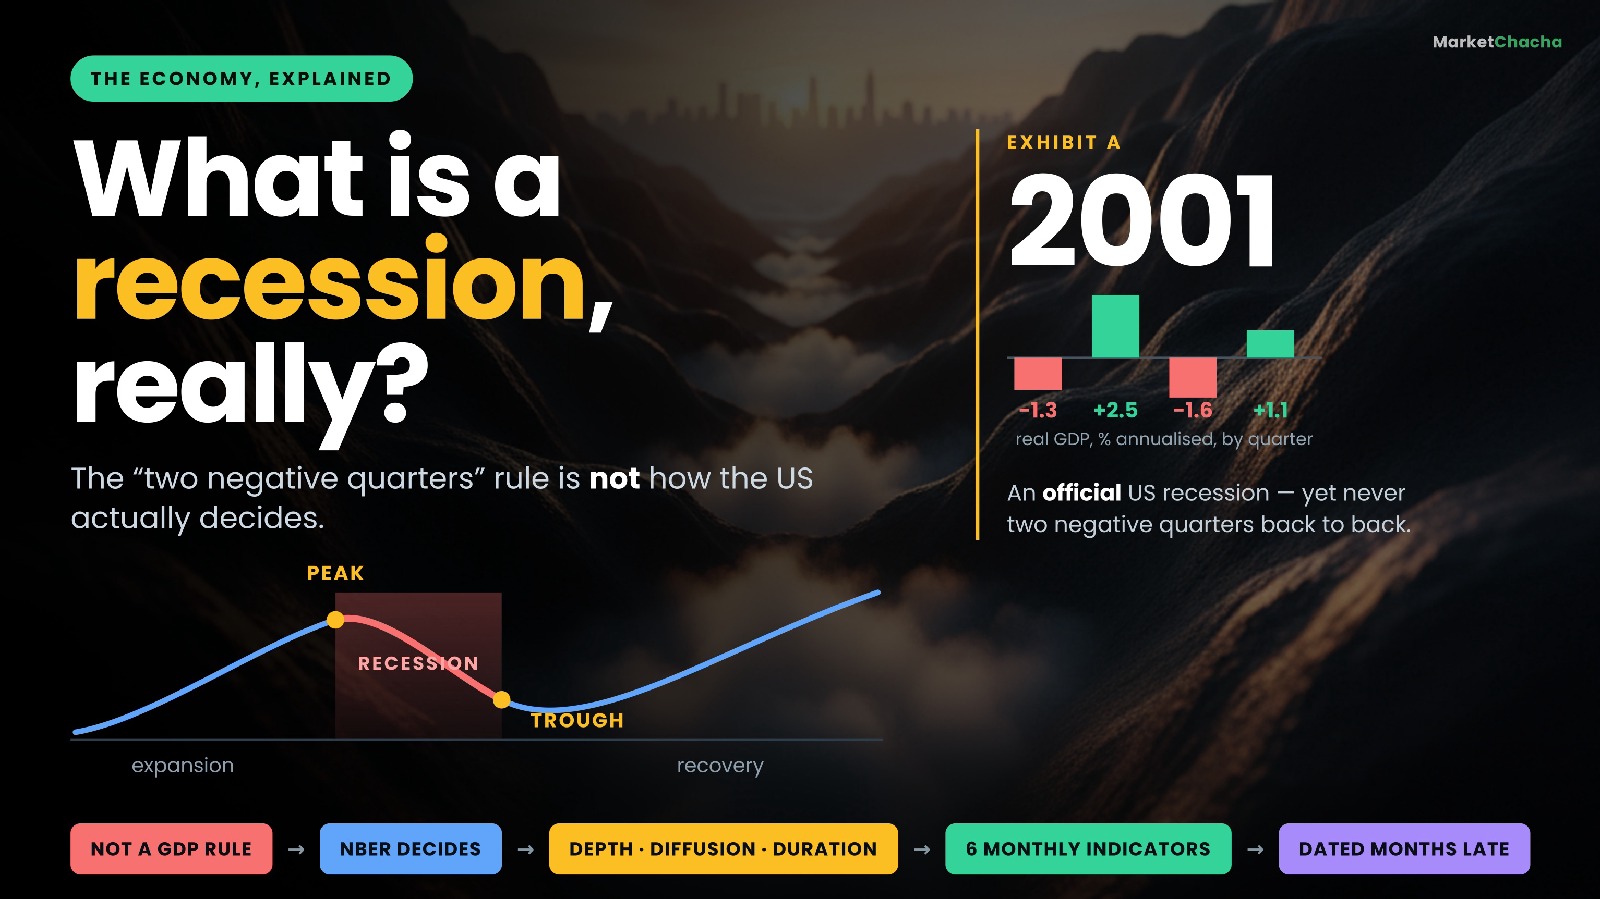
A recession is a significant decline in economic activity that is spread across the economy and that lasts more than a few months. That is the actual wording used by the National Bureau of Economic Research (NBER), the private, non-profit body whose Business Cycle Dating Committee officially dates US recessions. Notice what is not in that sentence: GDP, quarters, or any formula at all. The famous "two consecutive quarters of falling GDP" line is a rule of thumb the press adopted decades ago — a useful shorthand that has been flatly wrong in both directions. The 2001 recession was official without two negative quarters in a row. The first half of 2022 had two negative quarters as first reported and was never called a recession.
This guide walks through what a recession officially is, the six monthly numbers the committee actually reads, a worked example you can check yourself, why the announcement always arrives months late, the real-time signals people watch instead, and how the same question is answered in India.
So is a recession two quarters of negative GDP, or not?
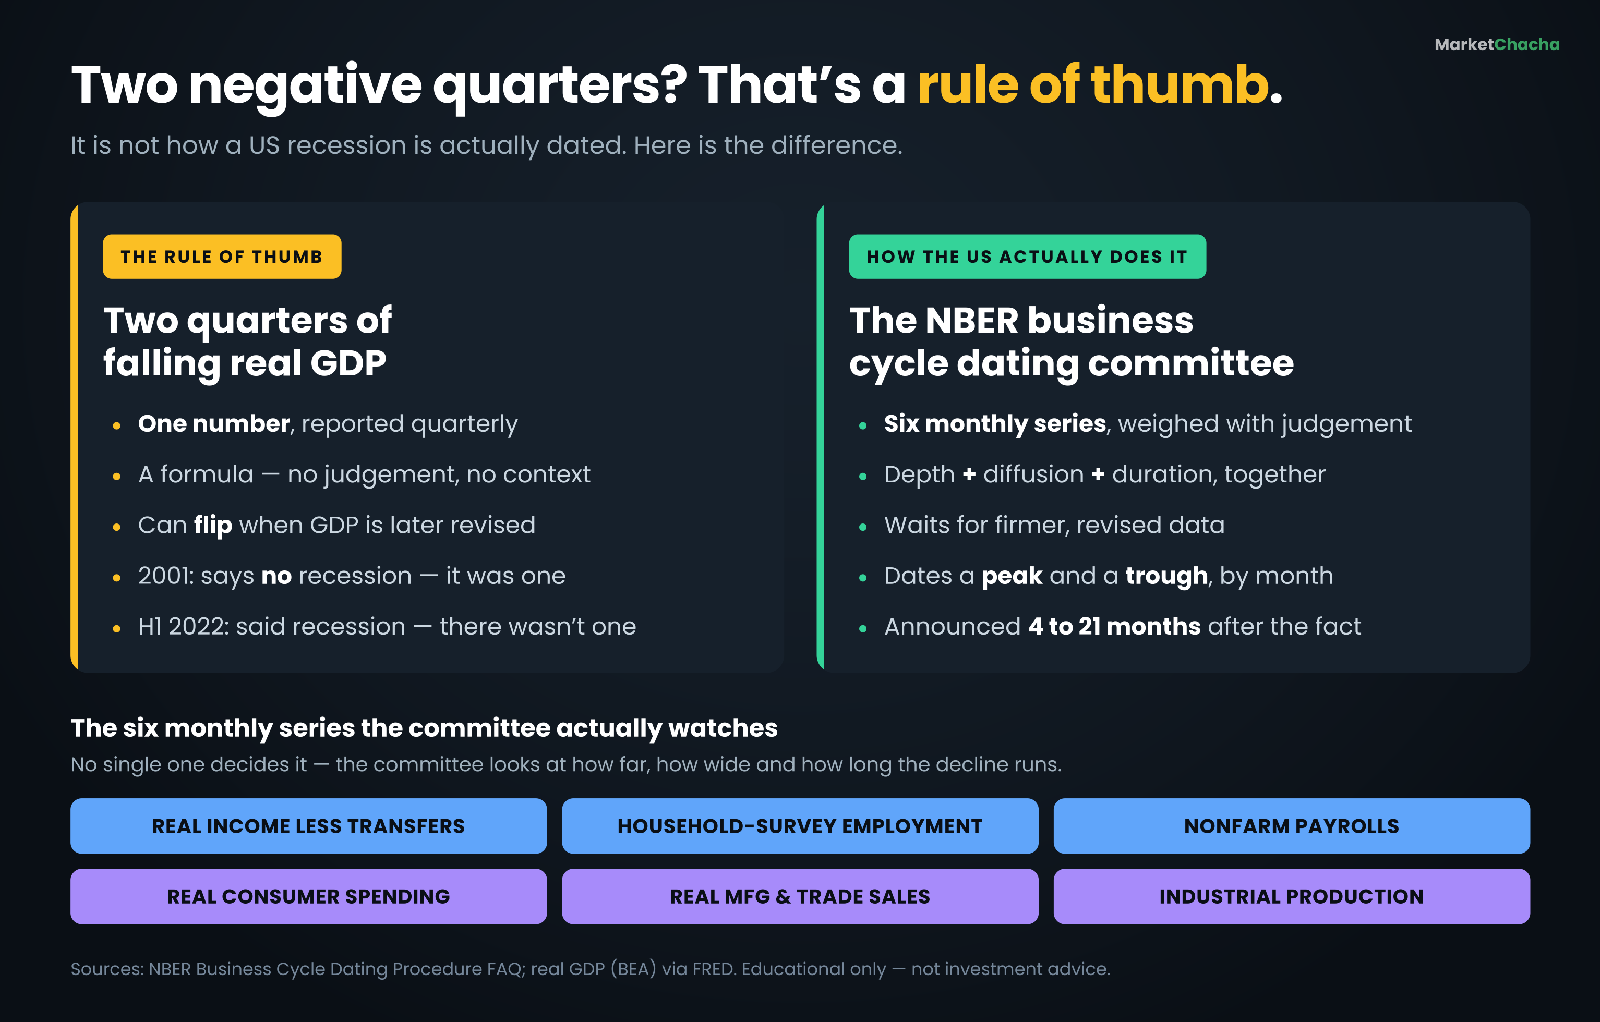
The rule of thumb is not useless. The NBER itself says that "most of the recessions identified by our procedures do consist of two or more consecutive quarters of declining real GDP, but not all of them." So it is a common symptom of a recession — it is simply not the definition, and in the US it has never been the official test.
Three things make the shortcut fragile. First, it rests on a single number, and GDP is published only quarterly. Second, that number is estimated three times and then revised again in annual updates, so a "negative quarter" can quietly turn positive a year later. Third, it ignores breadth entirely: a quarter can go negative because of one volatile line item (a swing in inventories, or a drop in government spending) while jobs, incomes and consumer spending are all still growing.
It is also worth knowing that the rule is not universal practice abroad by choice — it is often a fallback because no dating committee exists. The euro area does have one, the CEPR-EABCN Euro Area Business Cycle Dating Committee, and it also rejects the mechanical test, defining a recession as "a significant, broad-based decline in activity" instead.
One more piece of precision that trips people up: a recession is the stretch from a peak to a trough — a period of diminishing activity, not diminished activity. The trough is the low point, the moment things stop getting worse. That is why the NBER says the 2020 recession ended in April 2020, a month when US unemployment was 14.8%. The economy was terrible; it had simply stopped deteriorating.
How the US actually decides: depth, diffusion and duration
The NBER committee dates business cycle turning points by month, not by quarter, and it weighs three criteria, often called the three D's:
- Depth — how far activity falls.
- Diffusion — how widely the fall is spread across industries and indicators.
- Duration — how long it lasts.
Crucially, these are not boxes to tick independently. In the committee's own words, "while each of the three criteria — depth, diffusion, and duration — needs to be met individually to some degree, extreme conditions revealed by one criterion may partially offset weaker indications from another." That single sentence explains the 2020 recession: it lasted only two months, which on duration alone would fail, but the depth and diffusion were so extreme that they offset it. Real GDP fell at a 28.0% annualised rate in the second quarter of 2020 (BEA data via FRED), and essentially every indicator collapsed at once.
The six monthly numbers the committee actually watches
Because GDP is quarterly and heavily revised, the committee leans on monthly series instead. These are the six it names:
- Real personal income less transfer payments — income the economy actually generated, stripped of government payments like stimulus cheques and unemployment benefits, which rise because of a downturn.
- Nonfarm payroll employment — jobs counted from employers' payroll records.
- Employment from the household survey — jobs counted by asking households, a separate and differently-constructed count.
- Real personal consumption expenditures — what households actually spend, adjusted for prices.
- Real manufacturing and trade sales — sales through the goods pipeline, adjusted for prices.
- Industrial production — physical output of factories, mines and utilities.
No single one of these decides anything. The point of having six is diffusion: if five are still climbing while one dips, the decline is not "spread across the economy."
A worked example: run the rule on 2001, then on 2022
Case 1 — 2001: an official recession the rule misses. Here are the four quarters of 2001, real GDP growth at a seasonally adjusted annual rate (BEA, current data via FRED):
- Q1 2001: −1.3%
- Q2 2001: +2.5%
- Q3 2001: −1.6%
- Q4 2001: +1.1%
Two negatives, but never back to back. Run the rule of thumb and you get "no recession." The NBER dates a recession from March 2001 to November 2001 — eight months — because payrolls, industrial production and manufacturing sales were falling together for most of that stretch, even as the quarterly GDP line zig-zagged.
Case 2 — the first half of 2022: the rule fires, and nothing happens. On 28 July 2022 the BEA's advance estimate said real GDP had fallen at a 0.9% annual rate in Q2 2022, after a 1.6% fall in Q1. Two consecutive negative quarters: the rule triggers, and much of the press ran with it. The NBER never dated a recession. Look at what the committee's own indicators were doing over those same six months:
- Nonfarm payrolls rose in every single month from January to June 2022, adding about 2.5 million jobs in half a year (149.82m in December 2021 to 152.36m in June 2022).
- Real personal consumption spending rose from an annualised $15,059bn in December 2021 to $15,224bn in June 2022 (+1.1%).
- Industrial production rose from an index level of 100.6 to 101.0 over the same months.
Depth: shallow. Diffusion: absent. Duration: short. The rule of thumb fired, the actual test did not come close.
And here is the arithmetic that should retire the shortcut for good. After later revisions, today's BEA data for those same two quarters reads −1.0% in Q1 2022 and +0.6% in Q2 2022. The Q2 number moved by 1.5 percentage points (−0.9% to +0.6%) purely through revision. The "signal" that launched a thousand headlines does not exist in the data any more.
What a recession actually looks like in the data
The chart below plots the US unemployment rate every month since 1948, with NBER-dated recessions shaded. Three things jump out.
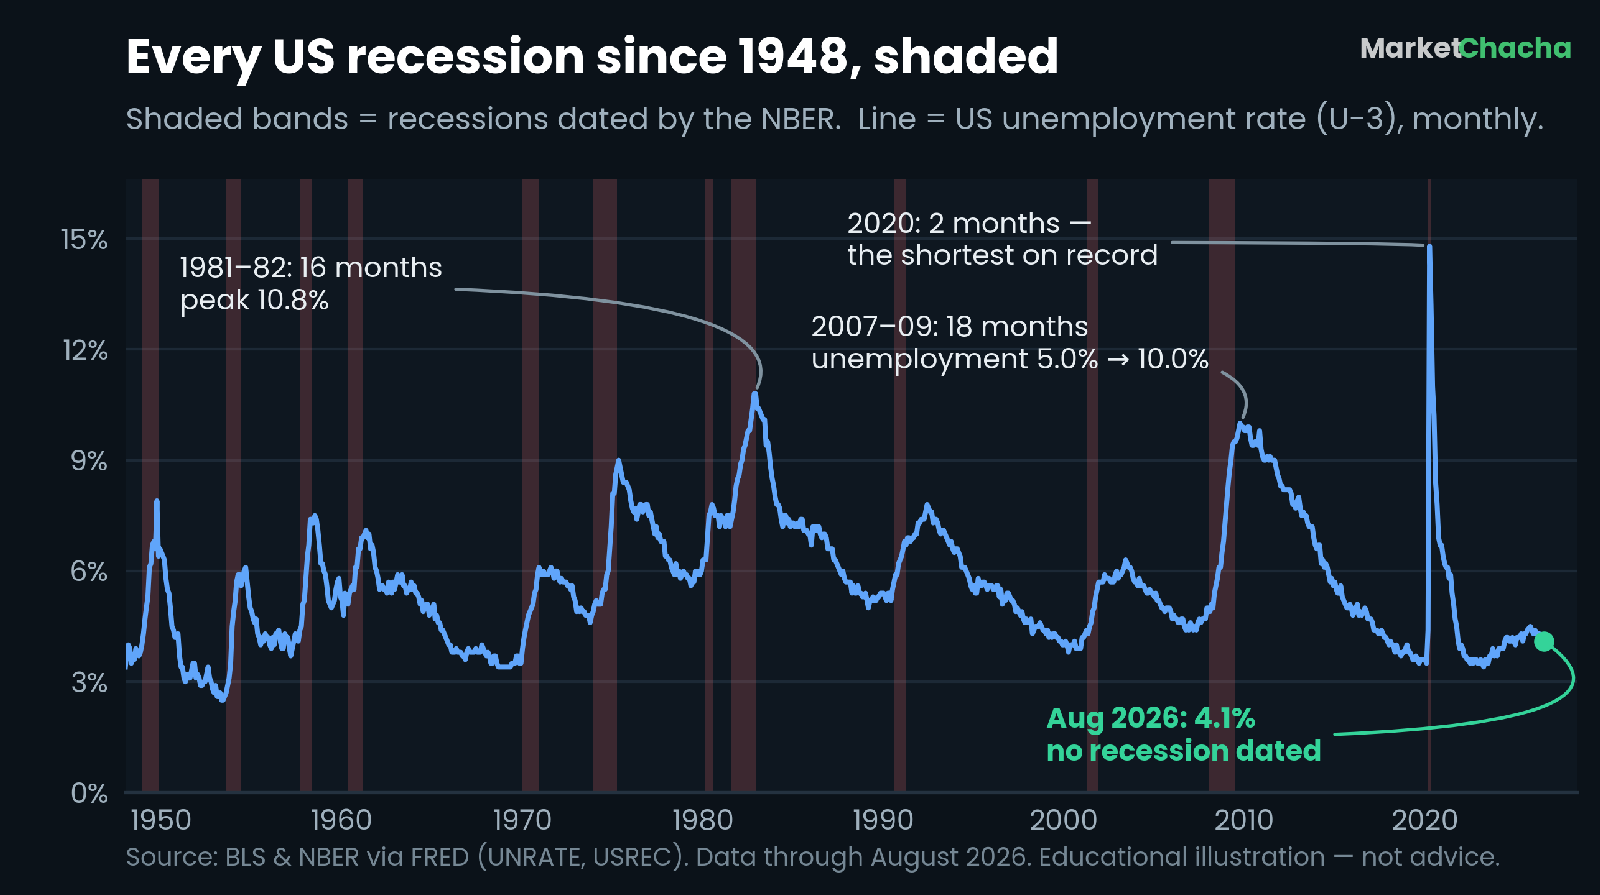
They are usually short, and hugely variable. Across the twelve recessions the NBER has dated with peaks from 1948 through 2020, the average contraction ran 10.3 months. The shortest was 2020 at two months; the longest was December 2007 to June 2009 at eighteen. Expansions are far longer: the one that ran from June 2009 to February 2020 lasted 128 months, the longest in the NBER's records.
The job market lags. In the 2007–09 recession, unemployment went from 5.0% in December 2007 (the peak month) to 10.0% in October 2009 — and that October high came four months after the recession had officially ended in June 2009. In 1981–82 unemployment topped out at 10.8%. In 2020 it hit 14.8% in April, the very month the NBER later marked as the trough.
Where things stand now. As of the latest data at the time of writing, US unemployment was 4.1% in August 2026, unchanged on the month, with nonfarm payrolls up 162,000 (BLS, Employment Situation released 4 September 2026). The NBER has no recession dated for the current period. That is a statement of fact about published data, not a forecast — a peak, if one ever comes, would only be dated long afterwards.
Why you always find out too late
The NBER has no fixed timing rule, and its own published record shows announcements arriving anywhere from 4 to 21 months after the turning point they identify. Two concrete examples:
- The February 2020 peak was announced on 8 June 2020 — four months later, and unusually fast.
- The April 2020 trough was announced on 19 July 2021 — fifteen months after the recovery had begun.
The committee is deliberately slow. It waits for data to be revised and for the picture to firm up, because reversing a call would be far more damaging than making it late. The practical consequence is simple and often missed: an official recession call is a historical record, not a warning. By the time it arrives, most of the event has already happened. That is the argument for having a plan before the cycle turns rather than after — which is exactly what an emergency fund is for.
The real-time signals people watch instead — and their limits
Because the official call is late, analysts lean on faster indicators. Two of the best known:
The Sahm rule. It signals a recession when the three-month moving average of the national unemployment rate (U-3) rises by 0.50 percentage points or more above the lowest three-month average of the previous twelve months. Work it through with the latest data. The three most recent monthly unemployment readings are June 2026 at 4.2%, July at 4.1% and August at 4.1%. Their average is (4.2 + 4.1 + 4.1) ÷ 3 = 4.13%. The lowest three-month average over the preceding twelve months was 4.20%. So 4.13% − 4.20% = −0.07 percentage points, against a 0.50 trigger. Not triggered, and not close. (FRED publishes this as SAHMCURRENT; its August 2026 value is −0.07, matching the arithmetic above.)
The inverted yield curve. When short-dated Treasuries yield more than long-dated ones, the bond market is effectively pricing in rate cuts, which usually means it expects weakness ahead. It has preceded most post-war US recessions, but with long and wildly inconsistent lead times. We cover the mechanics separately in what the Treasury yield curve is and why an inverted one scares investors, and the underlying policy rate machinery in what an interest rate really is and why the Fed moves it.
The limit on all of these is the same, and it matters: they are empirical regularities drawn from about a dozen post-war recessions. A pattern that held twelve times is a pattern, not a law. Each of these signals has also produced readings that went nowhere.
How to actually track it yourself, step by step
Everything below is free and public. You do not need a terminal.
- Step 1 — bookmark the source of truth. The NBER's business cycle dating pages carry the official peak and trough dates and every committee announcement. Nothing else is "official."
- Step 2 — watch the monthly jobs report. The BLS Employment Situation gives you nonfarm payrolls and the U-3 unemployment rate, two of the committee's six indicators, on the same morning each month.
- Step 3 — treat quarterly GDP as provisional. The BEA publishes an advance, then a second, then a third estimate of each quarter, and revises again in annual updates. Never build a conclusion on an advance estimate alone.
- Step 4 — pull the series on FRED. Free, no account needed. Useful tickers: UNRATE (unemployment), PAYEMS (payrolls), INDPRO (industrial production), PCEC96 (real consumer spending), USREC (the NBER recession indicator, which draws the shaded bands), and SAHMCURRENT.
- Step 5 — know when the numbers land. Data releases move markets precisely because they are scheduled; our economic calendar lists the upcoming US and India release dates.
- Step 6 — read breadth, not one print. Ask how many of the six indicators are falling, how far, and for how long. That is literally the committee's job.
What getting this wrong costs you
The cost is rarely the label — it is the decision the label triggers.
A false positive looks like mid-2022: a mechanical rule fires on an advance GDP estimate, the word "recession" is everywhere, and people change plans on a number that later gets revised away. A false negative is the mirror image: because the official call lands 4 to 21 months late, waiting for confirmation guarantees you learn about the downturn well after it began, and sometimes after it has already ended.
There is a third, quieter cost: conflating a recession with a falling stock market. They are different things measured on different clocks. Share prices are forward-looking and can fall hard with no recession at all, or start rising while the recession is still officially running — the 2007–09 recession ended in June 2009, months after equities had bottomed. Using one as a proxy for the other produces bad conclusions in both directions.
None of this is a case for predicting recessions. It is a case for understanding that the information is late by construction, which is a fact about the measurement system, not about anyone's forecasting skill.
Common mistakes beginners make
- Treating the two-quarter rule as the definition. It is a shorthand, it is not the US test, and 2001 and 2022 both break it.
- Acting on an advance GDP estimate. First estimates are the least reliable version of the number, as the 1.5-point revision to Q2 2022 shows.
- Confusing a recession with a depression. There is no official definition of a depression at all; it is an informal term for a downturn far deeper and longer than a normal recession.
- Assuming the end of a recession means things feel better. The trough is the low point, not the recovery. Unemployment kept rising for four months after the 2007–09 recession officially ended.
- Reading a single month as a trend. Monthly data is noisy and revised; the committee looks at depth, breadth and persistence together.
- Expecting a timely announcement. There will never be one. The system is built to be accurate, not fast.
How this works in India
India has no equivalent of the NBER. There is no committee that formally dates business cycle peaks and troughs, so the conversation defaults to the two-quarter technical rule far more than it does in the US — and in practice, Indian commentary talks about a growth slowdown far more often than a recession, because trend growth is high enough that outright contraction is rare.
The bigger trap is a measurement difference that catches almost everyone. India's headline quarterly GDP growth from the Ministry of Statistics (MoSPI/NSO) is reported year-on-year — this quarter compared with the same quarter a year earlier. The US headline is a seasonally adjusted quarter-on-quarter rate, annualised. These are different calculations with different sensitivities, so an Indian "−7.5%" and an American "−7.5%" do not describe the same thing at all, and the two-quarter rule means something different in each system.
India's clearest brush with the term came in November 2020. In its first-ever "nowcast", the Reserve Bank of India indicated the economy had entered a technical recession — two successive quarters of contraction — for the first time in its history. The April–June 2020 quarter had contracted roughly 24% year-on-year, and the RBI's nowcast put the July–September quarter at about −8.6%.
That "first in history" claim came with a large asterisk, and it is a good illustration of how definitions drive headlines. India's quarterly GDP series only begins in 1996, so a first-ever quarterly recession is partly a statement about data history. On annual GDP, India had contracted four times before — 1957–58 (−1.2%), 1965–66 (−3.7%), 1972–73 (−0.3%) and 1979–80 (−5.2%) — driven mostly by failed monsoons and oil shocks. Whether 2020 was "India's first recession" depended entirely on which definition you picked, which is the same lesson the US 2001 and 2022 cases teach.
If you want to track the Indian cycle yourself, the equivalents of the US releases are MoSPI's quarterly GDP and GVA estimates, the monthly Index of Industrial Production, the RBI's bimonthly monetary policy statements and its Monthly Bulletin, and the monthly S&P Global India PMIs for a faster (if survey-based) read.
FAQ
Is a recession officially two quarters of negative GDP? Not in the United States. The NBER defines a recession as a significant, broad decline in activity lasting more than a few months, and dates it by month using six monthly indicators. Most recessions do happen to include two negative quarters, but 2001 did not, and the two negative quarters first reported for early 2022 were never declared a recession.
Who officially declares a recession in the US? The Business Cycle Dating Committee of the National Bureau of Economic Research, a private non-profit research organisation. It is not a government agency, and its dates are announced anywhere from about 4 to 21 months after the turning point itself.
How long does a recession usually last? Across the twelve US recessions the NBER dated with peaks from 1948 to 2020, the average contraction lasted 10.3 months. The range is wide: two months in 2020, eighteen months in 2007–09.
What is the difference between a recession and a depression? A recession has a recognised definition and an official US dating body; a depression has neither. "Depression" is an informal term for a downturn dramatically deeper and longer than a typical recession, with the 1930s as the reference point.
Does the stock market always fall in a recession? No, and the timing rarely lines up. Share prices are forward-looking, so they often fall before a recession is dated and start rising while it is still officially running — equities bottomed months before the 2007–09 recession ended in June 2009. A falling market is not proof of a recession, and a rising one is not proof there is none.
Does India have an official recession definition? No. India has no NBER-style dating committee, so commentary leans on the two-quarter technical rule applied to MoSPI's quarterly GDP. Remember that India reports quarterly growth year-on-year while the US reports an annualised quarter-on-quarter rate, so the two headline numbers are not directly comparable.
Educational content only — not investment, tax or insurance advice, and not a recommendation of any product. Rates, fees and rules change — always check current terms with the provider. [Sources: NBER Business Cycle Dating Procedure FAQ, NBER US Business Cycle Expansions and Contractions, BEA, GDP Q2 2022 advance estimate, BLS Employment Situation, FRED (UNRATE, USREC, PAYEMS, INDPRO, PCEC96, SAHMCURRENT), CEPR-EABCN Euro Area Business Cycle Dating Committee FAQ, Business Standard on the RBI's first nowcast, Business Today on India's earlier annual contractions]. Always do your own research.
This article is for educational and informational purposes only. It is not financial advice, investment recommendation, or a solicitation to buy or sell securities. Investing involves significant risks. I am not a SEBI-registered investment advisor. Readers should consult their own financial advisor and conduct their own research before making any investment decisions.
Comments
Join the conversation
Sign in to join the conversation.
Follow replies, add your view, and take part in the discussion.
Sign in to commentLoading comments...